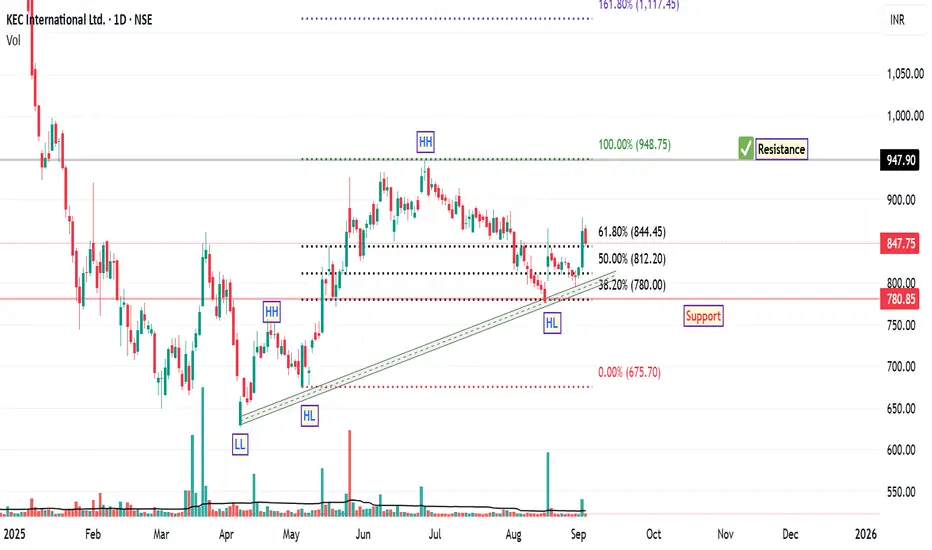
KEC International: Bullish Structure with StrengthSince April 7th, the price structure of KEC International has demonstrated a notable bullish trend reversal, characterized by the formation of higher highs and higher lows along an ascending trendline. This pattern is often interpreted by technical analysts as a sign of strengthening upward momentum.
A recent Fibonacci retracement, drawn from the swing low to the swing high of the current rally, revealed a pullback to the 38.2% level—a zone commonly viewed as a potential support area within a prevailing uptrend. The stock responded positively to this level, rebounding and subsequently closing above the 61.8% retracement level, which is another key technical threshold.
Interestingly, the price has retested the 61.8% level and held firm, suggesting that this area may be acting as a support base. Additionally, the stock has managed to close above its 200-day EMA, a long-term trend indicator that many market participants use to assess broader directional bias. A sustained position above the 200 EMA is generally considered constructive from a trend-following perspective.
From a structural standpoint, based on current chart dynamics, the next potential resistance zone appears to be near ₹948, while the suggested support level is around ₹780 . These levels are derived from historical price action and technical confluence zones, and may serve as reference points for monitoring future price behaviour.
Disclaimer: This analysis is intended solely for educational and informational purposes. It does not constitute investment advice or a recommendation to buy, sell, or hold any financial instrument. Market conditions are subject to change, and trading decisions should be made based on individual research, risk assessment, and consultation with a licensed financial advisor.
Fibonacci Retracement
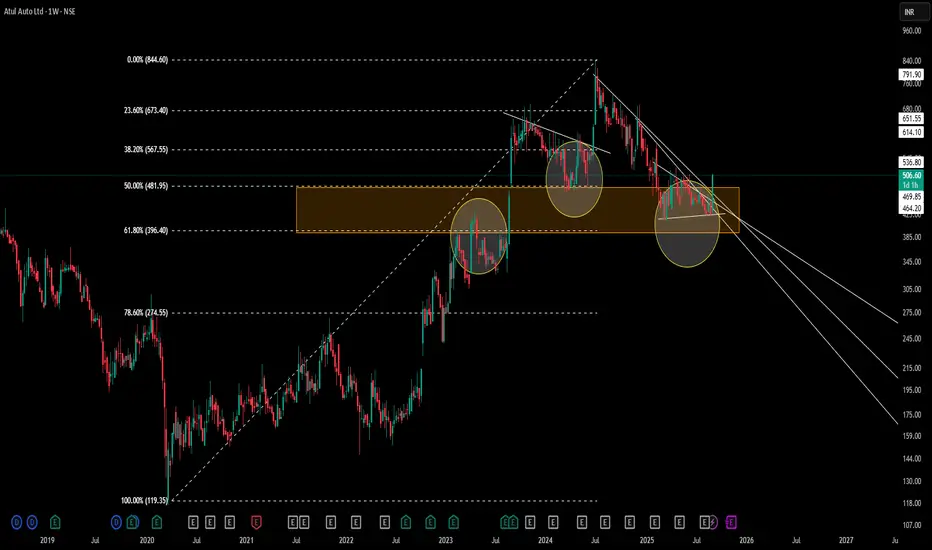
Atul Auto | MTF Fibonacci Confluence structuresWeekly Chart Analysis
– Drew a multi-timeframe Fibonacci from the 119.35 low (Mar ’20) to the 844.60 high (Oct ’24) on the Monthly time frame .
– Highlighted the 50–61.8% retracement zone (481.95–396.40) as an orange supply/demand area.
– Circles mark historical pivots where price reacted as support or resistance within this zone.
Key Observations
-Price consistently respected the 50–61.8% band during prior rallies and pullbacks.
-Recent price action formed a contracting triangle (CT) at the lower edge of the Fibonacci zone.
-Volume contraction noted inside the triangle, suggesting supply–demand equilibrium.
Disclaimer: This analysis is provided for educational and informational purposes only and does not constitute financial advice. Trading involves risk, and you should perform your own research and consider your risk tolerance before making any trading decisions.
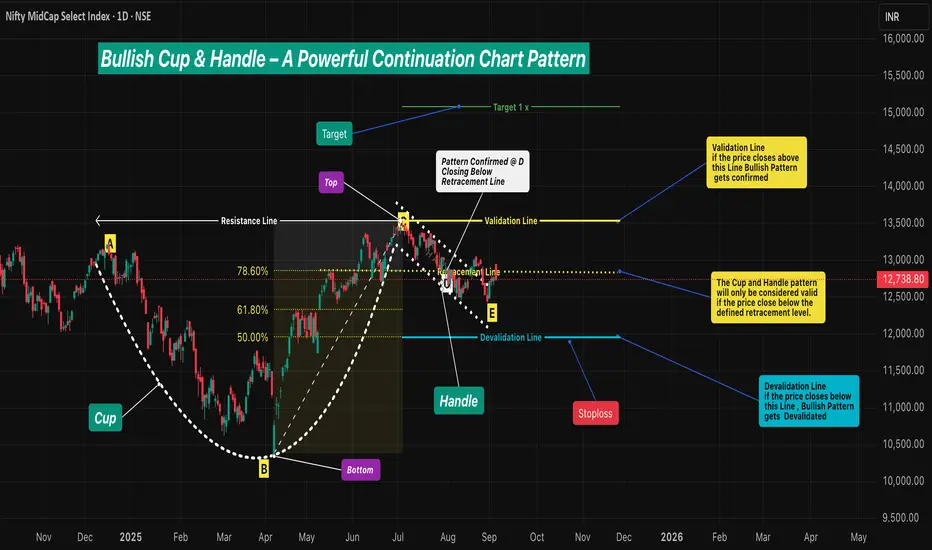
Bullish Cup & Handle – A Powerful Continuation Chart Pattern🔹 Intro / Overview
☕ The Cup and Handle is a 📈 bullish continuation pattern often studied in technical analysis.
⚔️ It forms when there is a fight between bulls 🐂 and bears 🐻 — the Cup develops as both remain strong.
📉 During the Handle, sellers 🛑 temporarily gain strength.
📈 But when price closes above the Validation Line, buyers regain control 💪 and bullish momentum dominates.
____________________________________________________________
📖 How to Identify
✅ Validation → The pattern is valid if price closes above the Validation Line.
❌ Devalidation → The pattern is invalid if price closes below the Devalidation Line(before Validation).
📉 Retracement Rule →The pattern is only confirmed if the price closes below the Retracement Line during the Handle formation.
This ensures a proper pullback forms before breakout .
____________________________________________________________
📖 Key Points of Pattern
✅ A valid Cup requires the retracement condition — confirmation occurs only if price closes below the Retracement Line .
⚖️ Balanced Highs → Point A (left peak) and Point C (right peak) should be relatively close in price, ensuring a proper Cup shape 🍵.
🔒 The Handle must not break the structural integrity of the Cup.(No Close Below Devalidation Lines)
____________________________________________________________
🎯 Trading Plan (Educational Only)
📌 Entry → Considered only after confirmation when price closes above the Validation Line.
🛡️ Stop-Loss (SL) → After validation, the Devalidation Line may act as an SL.
🎯 Target (TP) →
First Target → 1R (equal to the risk defined by Entry–SL distance).
Remaining Lots → Trail using ATR, Fibonacci levels, Box Trailing, or structure-based stops.
____________________________________________________________
📊 Chart Explanation
🍵 The Cup forms with a rounded base Point B and two balanced tops: Point A (left peak) & Point C (right peak) - The marginal price difference should be small to ensure a reliable Cup.
📈 The Retracement Line ( Point D ) confirms the pattern only if price closes below the Fibonacci Level of 78.60% and above the 50.00% .
📉 The Handle develops as price pulls back, with Point E marking the Handle low. and Good Handle of Cup is Formed (this low should not go below 50.00% Level )
📏 The Fibonacci retracement levels are drawn from Point B (Cup base) to Point C (right peak). These levels provide a reference framework to observe Retracement (minimum 78.60%) , Validation (100.00%) , and Devalidation (50.00%) areas for educational study of the structure.
____________________________________________________________
👀 Observations
✨ Works best after a strong uptrend 🚀 or at major support–resistance zones 🧱.
⚖️ A balanced Cup (Top Right ≈ Top Left) improves reliability.
📏 Handle Formation
The Handle should be shorter than the Cup depth — and should also be longer than the required minimum depth for proper structure.
If the Handle is too deep, it weakens the setup — and also if it is too short, the formation loses reliability.
____________________________________________________________
❗ Why It Matters
🔍 Shows the market battle between buyers and sellers.
💪 Highlights how buyers regain dominance after retracement validation.
⚖️ Balanced structure + strict rules = better filtering of weak setups.
📝 Provides clarity on entry, SL, and TP with a structured framework.
____________________________________________________________
🎯 Conclusion
The Cup and Handle pattern, when validated through Fibonacci retracement rules 📉, balanced highs ⚖️, and proper Handle structure 🔒, offers a disciplined framework for studying bullish continuation setups.
🔥 Patterns don’t predict. Rules protect.
____________________________________________________________
⚠️ Disclaimer
📘 For educational purposes only.
🙅 Not SEBI registered.
❌ Not a buy/sell recommendation.
🧠 Purely a learning resource.
📊 Not Financial Advice.
Multi-Confirmation Price Action: Fibonacci Zones, Base BreakoutsExplore multi-confirmation techniques using Fibonacci retracement to identify high-probability base breakout zones. Learn how to spot double bottom and inverted head & shoulders patterns at demand levels and execute confirmation trades for precision entries

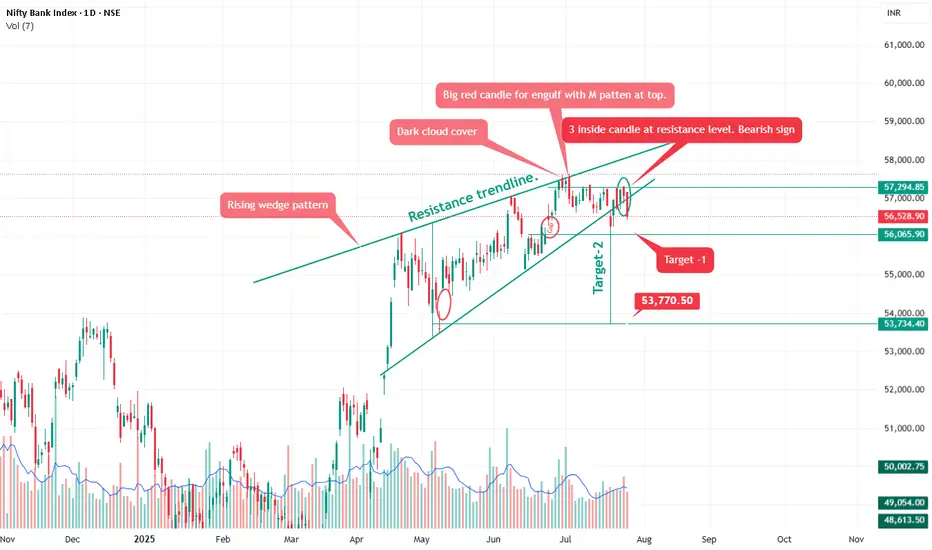
Bank nifty Rising wedge pattern.Pattern Analysis
Rising Wedge Pattern:
A bearish pattern typically seen near tops. It shows narrowing price movement with higher highs but declining momentum.
Breakdown confirmed as price has fallen below the lower wedge support trendline.
Confirms selling pressure and rejection from the top near 57,300–57,500 zone.
🕯️ Candlestick Signals
Dark Cloud Cover:
A bearish reversal pattern indicating sellers have taken control after a bullish phase.
Big Red Candle + ‘M’ Pattern:
Bearish engulfing at resistance – strong indication of a top formation.
3 Inside Down Candlestick Pattern at Resistance:
Recent red candles have higher volume, confirming institutional selling activity.
As anticipated in our previous analysis, Bank Nifty corrected from the 57,000 level to 56,056, validating the bearish setup.
It is also expected to short here 56,550 add on any rise up to 57,700-57,950 for target mentioned on chart.
Alternative Scenario: Be aware that the rising wedge could potentially break upwards. If the price breaks decisively above the resistance trendline with strong volume, the bearish outlook would be invalidated.
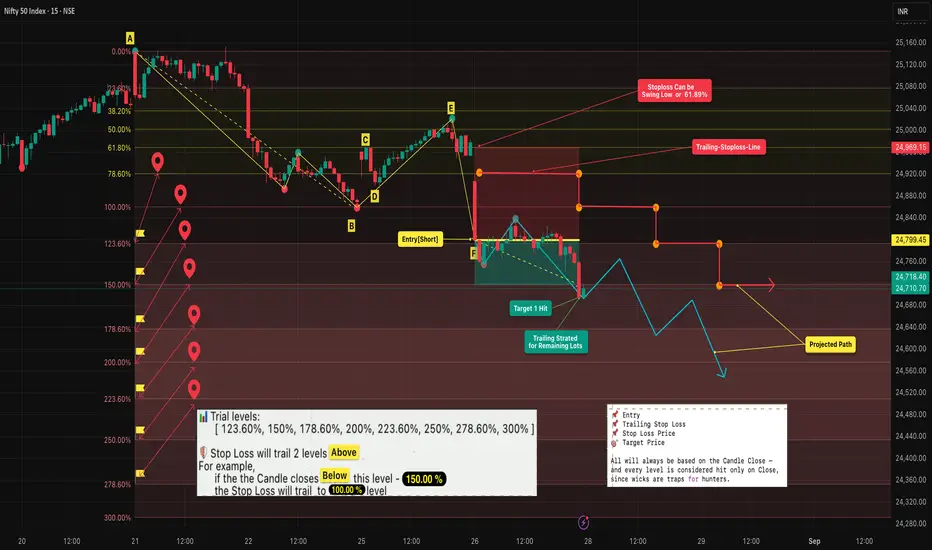
Fibonacci Retracement Trailing : Lock Profits & Ride Trends🔹 Intro / Overview
Managing trades after entry is just as critical as spotting the entry itself.
In this idea, we apply Fibonacci retracements with a trailing stop system to capture profits while staying disciplined.
A well-structured trailing plan helps traders:
✅ Lock in gains early
🛡️ Protect capital against reversals
📊 Stay rule-based instead of emotional
---
📖 Concept
- A swing High (A) to Low (B) defines our Fibonacci retracement zones.
- Retracements (C, E) test Fibonacci levels but don’t confirm entry until structure is validated.
- Entry (F) occurs only after a successive close confirms the short trade.
- Stop Loss (SL) is placed at the 61.8% retracement (closer and more protective than the far swing).
- Trailing: SL trails forward only , two Fib levels behind price. It manages the remaining position after booking partial profits.
---
📊 Chart Explanation (Step-by-Step)
1️⃣ Swing Definition
📍 A = Swing High
📍 B = Swing Low
2️⃣ Retracement Testing
- C → first retracement (no confirmation)
- D → invalid as no proper close
- E → deeper retracement, still no entry
3️⃣ Entry Point
✅ At F, successive closes confirm → short entry taken
4️⃣ Stop Loss (SL)
📉 Set at 61.8% retracement for tighter risk management
5️⃣ Targets & Trailing
🎯 Target 1 hit → exit one lot, secure partial profits
🔄 Remaining lots managed with trailing system:
• SL adjusted only forward , never backward
• SL trails as price moves down:
• 150% → SL to 100%
• 178.6% → SL to 123.6%
• 200% → SL to 150%, etc.
6️⃣ Projected Path
🔍 Blue/red paths illustrate how price could move while trailing locks in gains
---
🔍 Observations
📌 Entry validated on structure → reduces false signals
🎯 Booking partial profits builds confidence and ensures realized gains
🔄 Trailing maximizes potential while staying safe
📊 Fib-based progression keeps decisions mechanical, not emotional
---
✨ Why It Matters
✔ Turns static Fibonacci into a dynamic strategy
✔ Prevents giving back profits when trends reverse
✔ Adds confidence and discipline in trade management
✔ Teaches how to scale out smartly
---
✅ Conclusion
Fibonacci retracement alone gives levels — but combining it with a trailing stop system transforms it into a complete trade plan.
By booking partial profits and trailing the rest:
🛡️ You protect capital
🚀 You ride trends longer
🤝 You trade with discipline instead of emotion
---
⚠️ Disclaimer
For educational purposes only · Not SEBI registered · Not a buy/sell recommendation · No investment advice — purely a learning resource
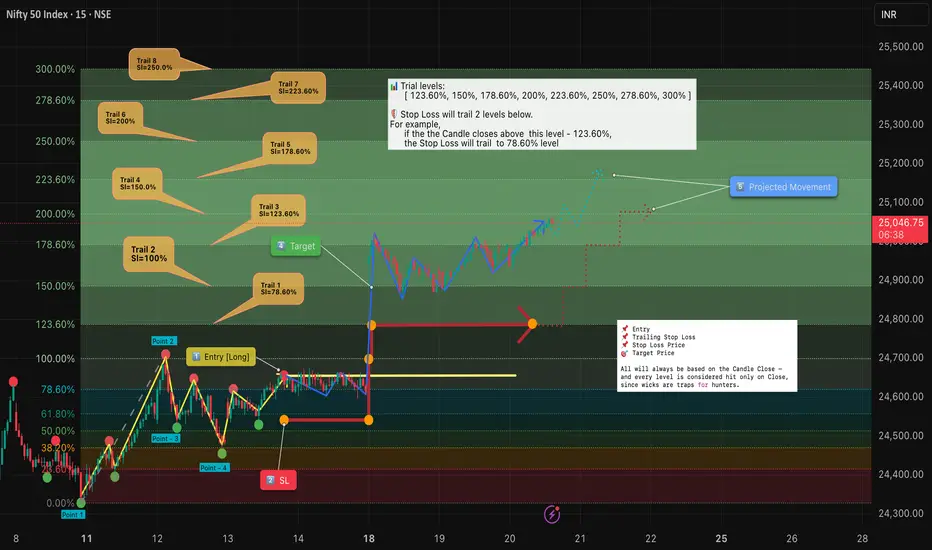
Trailing Stops: Protect Profits & Ride the Trend with Discipline🔹 Intro / Overview
Managing a position after entry is just as important as identifying the entry itself.
Here, we are specifically discussing trailing stops using Fibonacci retracements .
A well-structured trailing stop helps traders:
✅ Lock in profits
🛡️ Reduce risk
📊 Stay objective in the face of market noise
This idea shows how trailing stops can be applied in a structured way to complement Fibonacci retracements and trend management.
📖 Concept
📍 A trailing stop is a dynamic stop-loss that adjusts as price moves in your favor.
🔄 Instead of staying fixed, it “trails” price at a chosen distance — capturing more upside while capping downside.
🧩 Traders often trail stops using swing lows/highs, moving averages, or volatility measures like ATR .
📊 Chart Explanation (Step-by-Step)
1️⃣ Entry Criteria
✅ Successive closes above 78.6% confirm the long entry.
2️⃣ Stop Loss (SL)
📉 Placed at the previous swing low for structure-based protection.
⏩ SL adjustments move forward only with trailing rules — never backward.
3️⃣ Trailing Levels
👉 SL always trails two levels below the current trail level if the candle closes above it.
📈 Trail 1: 123.60% → SL moves to 78.60%
📈 Trail 2: 150.00% → SL moves to 100.00%
📈 Trail 3: 178.60% → SL moves to 123.60%
📈 Trail 4: 200.00% → SL moves to 150.00%
📈 Trail 5: 223.60% → SL moves to 178.60%
📈 Trail 6: 250.00% → SL moves to 200.00%
📈 Trail 7: 278.60% → SL moves to 223.60%
📈 Trail 8: 300.00% → SL moves to 250.00%
4️⃣ Target Points
🎯 At Target 1 , book one lot to secure profits.
📊 Remaining positions can be trailed further with the next levels.
5️⃣ Projected Path
🔍 Dotted blue/red projections illustrate potential movement under this trailing system.
🔍 Observations
📌 Objective Entry : Requires successive closes above 78.6%, reducing false signals.
🎯 Partial Profit Booking : Taking one lot off at Target 1 ensures realized gains.
🔄 Two-Level Trailing : Locks in profits while leaving room for trend continuation.
📊 Rule-Based Framework : Clear Fibonacci-based progression keeps decisions mechanical and consistent.
✨ Why It Matters
✔ Prevents turning winning trades into losers.
✔ Builds confidence by removing emotions from exit decisions.
✔ Lets profits run while maintaining protection.
✅ Conclusion
Trailing stops are not about perfection — they’re about discipline .
By systematically adjusting stops as the market moves, traders:
🛡️ Protect capital
🚀 Let profits run
🤝 Remove emotions from decision-making
When combined with Fibonacci retracements , trailing stops provide a structured framework to manage trades effectively after entry.
⚠️ Disclaimer : For educational purposes only · Not SEBI registered · Not a buy/sell recommendation · No investment advice — purely a learning resource
Coal India trade based on open = high theory
observations:-
recent trend has been upside
yesterday's candle made open = high, making it suitable to take up the short
target marked p 377, 371 based on Fibo levels
stop 386
lets enjoy this short trade

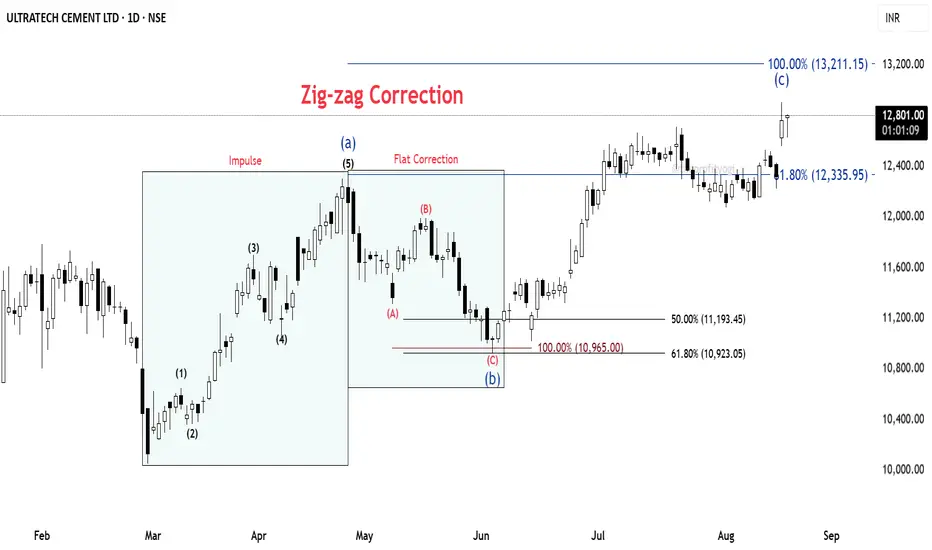
ULTRACEMCO: Wave C started from strong Fib clusterULTRACEMCO – Daily Chart Analysis
🔹 Base Point: The count begins from the low made on 3rd March 2025.
🔹 From this low, the price moved up in the form of a clear impulse wave, completing a 5-wave structure.
🔹 This was followed by a corrective fall, retracing 61.8% Fibonacci of the prior impulse.
⚡ Correction Phase:
The decline is counted as an ABC Flat correction (red).
Within this, the C wave extended fully to the 100% Fibonacci projection.
At this point, we observe a strong cluster zone formed by the 61.8% retracement and 100% extension, indicating confluence and potential support.
📈 Current Development:
From this support, the price has begun to move up again, showing the characteristics of a fresh impulse.
The overall structure fits into a larger Zig-Zag correction, where Wave C is still under development.⏳
📝 Summary:
✅ Impulse up (5 waves)
✅ Flat correction (A-B-C) complete at Fib cluster
🚀 Wave C of Zig-Zag unfolding
#ULTRACEMCO #NSEStocks #ElliottWave #Fibonacci #WaveAnalysis #TradingSetup #PriceAction
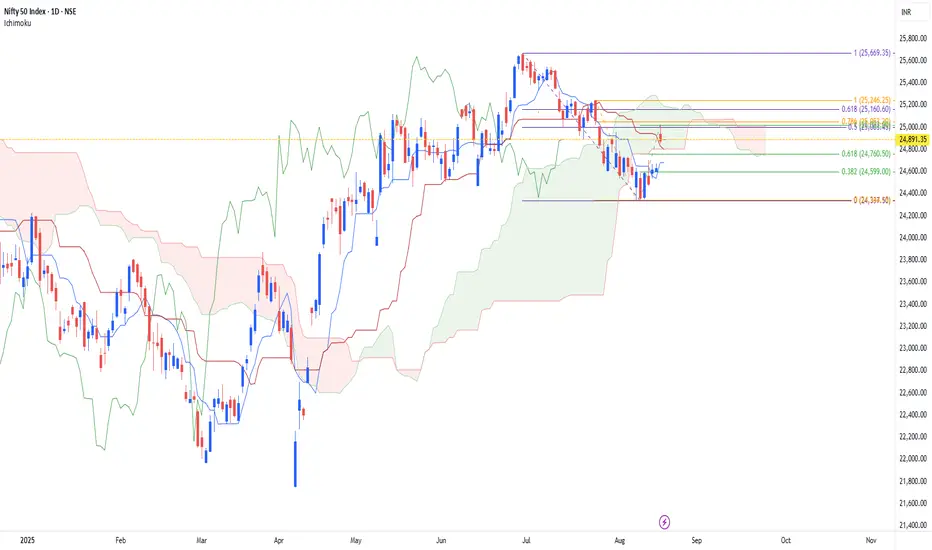
Nifty Short Entry Based on TRIPLE CROWN Theory
combining specific Fibo Retracement level, identified areas that can be used to go short in NIFTY
range to go short is - 25160 to 25000, which got triggered yesterday,
let us go for short till yesterday's high is not breached
target will be 24760 and 24600 and then 24340
stop can be placed 25000
this trade is purely based on entry when the price falls in TCZ (The Triple Crown Zone), which is price zone based on FIBO RETRACEMENT LEVELS IN A SPECIFIC ORDER
note :-
more then entering the trade
it will be more interesting to understand this theory and its impact if price stays in TCS zone today and how it reacts here on
stay tuned
have a good day to all
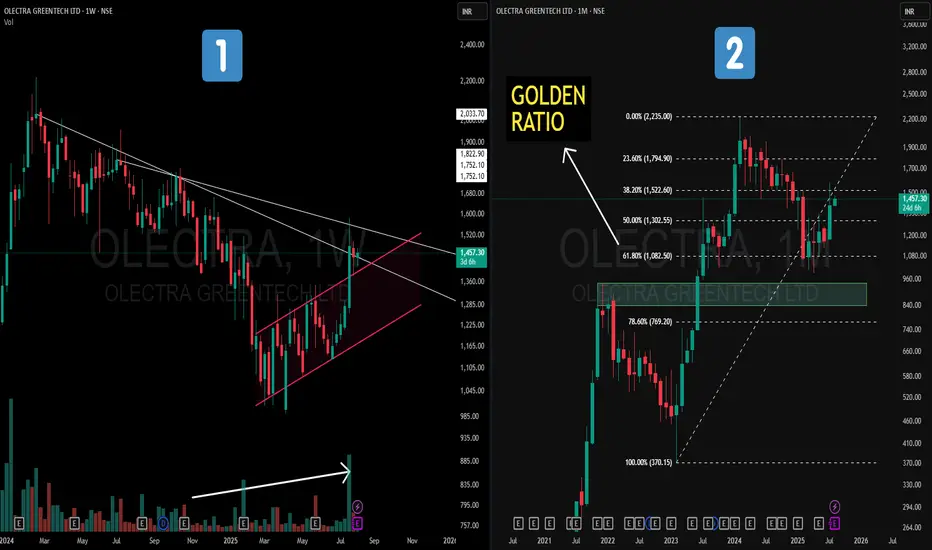
Olectra Greentech – Golden Ratio on MTF + Hidden channel on WTF📝 Description
📌On the Weekly Chart (Left) – Price action has formed a strong counter-trend (CT) breakout from a prolonged downtrend. Hidden within the structure is a parallel channel (highlighted in pink), with volume gradually increasing in the recent rally — a positive sign of accumulation.
📌On the Monthly Chart (Right) – A Fibonacci retracement drawn from the Feb 2023 low to the Feb 2024 high (a one-year strong uptrend) shows price taking support exactly at the 61.8% Golden Ratio. This reaction from a key retracement zone is aligned with historical technical behavior.
This is not a forecast, but rather a technical observation of structure, retracement behavior, and volume dynamics.
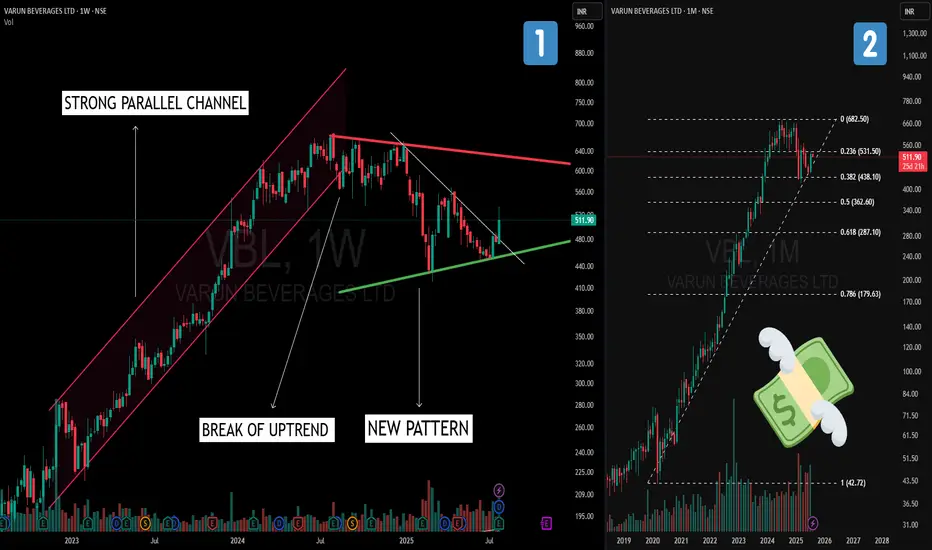
Varun Beverages: From Parallel Channel to Symmetrical TriangleOn the monthly timeframe (right chart), Varun Beverages shows a classic Fibonacci retracement pullback to the 38.2% level after an extended rally.
>Shifting to the weekly timeframe (left chart), we observe:
-Parallel Channel during the earlier uptrend phase, reflecting a strong trending structure.
-A break of the uptrend that transitioned into a sideways phase.
-Formation of a Symmetrical Triangle – characterized by a sequence of lower highs and higher lows, creating a contraction pattern.
This multi‑timeframe view highlights how trends evolve from strong rallies, to corrections, and into consolidation structures.
⚠️ Disclaimer:
This post is for educational purposes only and is not financial advice.
Bank nifty correction start now?Bank Nifty
Current Price: 56,791.95 (Spot)
Bank Nifty has reversed lower from the resistance trendline, confirming selling pressure near higher levels.
A Dark Cloud Cover candlestick pattern combined with an emerging M-top formation indicates potential short-term bearish sentiment.
It can short here or any bounce use as shorting opportunity for target 56,056
Major resistance is 57,400-57,700
The index is forming a rising wedge pattern, a bearish structure suggesting potential for deeper correction if key support levels are breached.
Key Support Levels:
Immediate support is identified at 56,056 (trendline support).
A decisive close below 56,056 may accelerate selling pressure, opening downside targets toward: 55,342 , 53,908

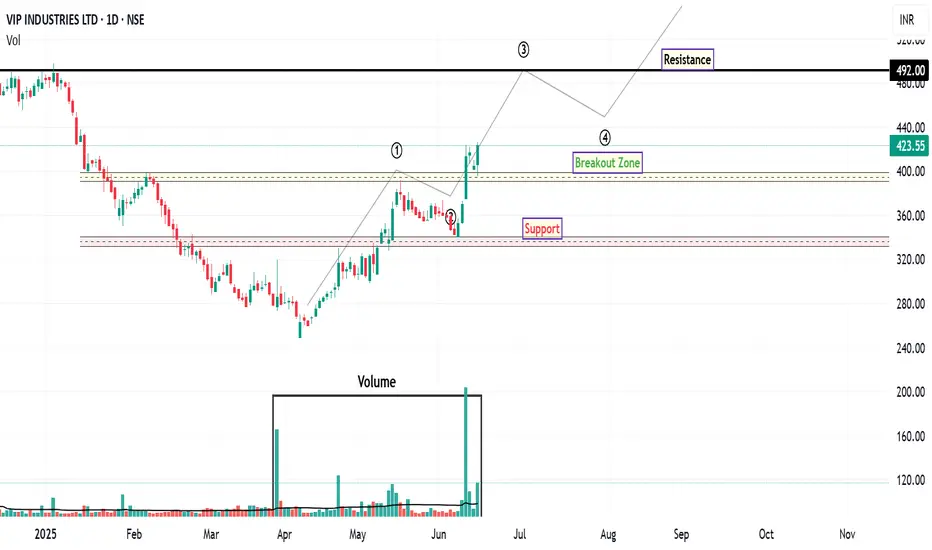
VIPIND: Unlocking Potential After Downtrend
VIP Industries has demonstrated robust bullish momentum over the past few trading sessions, signaling a notable shift in market sentiment. This upward trajectory is particularly significant given the stock's prolonged downtrend since October 2024.
From an Elliott Wave perspective, the recent price action suggests the potential completion of a corrective phase. The retracement from what appears to be Wave 1 to Wave 2 aligns closely with the 61.8% Fibonacci retracement level, which often precedes the initiation of a strong Wave 3 impulse. This potential wave structure, if confirmed, could indicate further upside potential.
A key development supporting this bullish outlook is the stock's recent decisive close above its 200-day EMA, accompanied by a significant surge in trading volume. This confluence of price action and volume confirms strong buying interest and suggests a potential long-term trend reversal. The increased volume further validates the strength of the breakout, indicating broader market participation.
While the immediate outlook appears constructive, traders should be mindful of potential profit-taking around the ₹446 level. This area may present a temporary resistance zone where some short-term corrections or consolidation could occur. However, should the stock successfully navigate this level, the next significant upside resistance target to monitor is ₹492 . This level aligns with prior price highs and could represent a more substantial challenge for further upward movement.
For risk management purposes, a prudent approach would involve considering a stop-loss order positioned below the identified support zone, as depicted on the chart. This strategy aims to mitigate potential downside risk in the event of an unexpected reversal in market sentiment.
Disclaimer: The information provided in this technical analysis is for informational and educational purposes only and should not be construed as financial advice. It is based on observations from the provided chart and commonly used technical indicators. Market conditions can change rapidly, and past performance is not indicative of future results. Always conduct your own comprehensive due diligence and consult with a qualified financial advisor before making any investment decisions.
NAZARA TECHNOLOGIES LTD | Monthly Chart Breakout📊 NAZARA TECHNOLOGIES LTD (NSE: NAZARA) | Monthly Chart Breakout
📅 Date: June 1, 2025
📈 CMP: ₹1,295.10 (+28.04%)
📌 Ticker: NSE:NAZARA
📉 Chart Pattern Insight
🔥 Cup & Handle + Falling Wedge Breakout
Nazara Tech has broken out of a strong Cup & Handle pattern, reinforced by a Falling Wedge breakout — a powerful confluence suggesting a major trend reversal.
🎯 Breakout is confirmed with high volume and a clean monthly candle close above key resistances.
📐 Fibonacci Retracement Levels (From High ₹1678 to Low ₹477)
🔸 38.2% – ₹935.85 (was resistance, now flipped to support)
🔸 50% – ₹1,077.55
🔸 61.8% – ₹1,219.25 (just surpassed – strong bullish confirmation)
🧭 100% – ₹1,678 (All-Time High)
📊 Indicator: RSI + Moving Average Cross (Icon shown)
🔍 RSI is at 71.63 and rising sharply, indicating strong momentum
🔺 RSI crossover above MA confirms bullish strength and trend continuation
🧱 Volume Spike
📈 Volume this month is multi-month high, validating the breakout
🔑 Key Levels
Support: ₹935 (prior resistance, now retest zone)
Immediate Resistance: ₹1,300 (psychological), ₹1,400
Target Zones:
Short-Term: ₹1,450
Medium-Term: ₹1,600+
Long-Term: Retest of All-Time High ₹1,678+
🛡️ SL: ₹935 (monthly close basis)
📌 Trading Plan
Entry: Pullback near ₹1,220–₹1,250 or breakout retest
SL: ₹935 (below 38.2%)
Target: ₹1,450 / ₹1,600+
Time Frame: Positional – Multi-week to multi-month
⚠️ Disclaimer
This analysis is for educational purposes only. Please do your own research or consult a SEBI-registered advisor before investing.

#SAIL#SAIL has corrected about 40% from recent swing high and currently trading near 61.8% retracement zone + weekly 200 ema and parallel channel support confluence zone. On weekly tf, it is probably trying to make a double bottom.
Historidally, when it gave a breakdown below weekly 200 ema and unable to sustain above it, it continued to underperform for almost 8-10 years but now it is probably trying to take support around it.
Also, RSI is making HLs off late, which is probably a good sign.
In terms of R:R, this is currently a good bet on long side.
As usual, DYOR and this isn't a Buy or Sell reco - but just an educational purpose post

ENVIRO INFRA ENGINEERS (NSE: ENVIRO)View: Strongly Bullish.
Bias: Trend reversal confirmed.
Strategy:
BUY: Initiate around ₹240-₹245 or on retest of ₹230-₹235.
Targets (T):
T1: ₹262
T2: ₹287
T3: ₹312
Stop-Loss (SL): ₹220 (on daily closing basis).
Reasoning:
Decisive breakout from a significant long-term descending trendline.
Strong volume confirming the breakout.
RSI indicating robust bullish momentum.
Potential for significant upside as stock recovers from prior fall.
Note: This is an educational analysis and not financial advice. Do your own due diligence before investing.

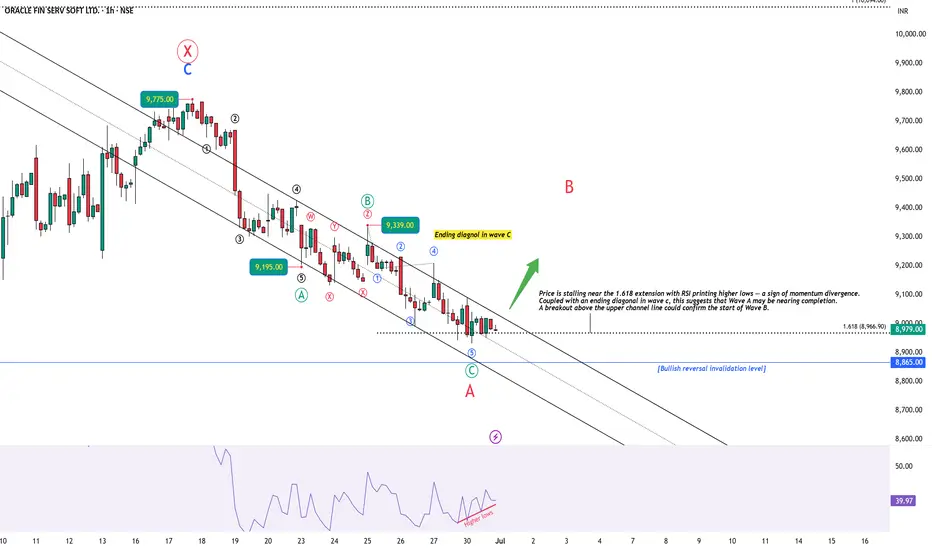
OFSS: Setting Up for a Relief Rally?🔍 Introduction
This analysis starts from the 1-hour timeframe, where price action shows signs of exhaustion at the tail end of a 5-wave decline. A classic ending diagonal in wave c, along with bullish RSI divergence, points toward a potential short-term reversal — possibly the start of Wave B in a larger A-B-C corrective structure. We then zoom out to place this setup within a broader W-X-Y correction that began from the 13,220 high.
🕐 1H Chart: Ending Diagonal + RSI Divergence into Key Zone
Following the peak at 9775, price has been declining in what appears to be a ABC zigzag correction. Subwave 5 (within wave c) exhibits ending diagonal behavior, with overlapping internals and weakening thrust. Importantly, RSI has been printing higher lows, diverging strongly against lower price lows — a signal of potential bottoming.
Price is also testing the 1.618 Fibonacci extension level. A decisive breakout above the upper trendline would confirm a likely transition into Wave B.
🟢 Watching closely for a decisive breakout / close above the channel.
📆 Daily Chart: W-X-Y Structure from 13,220 High
Zooming out, ORACLE FIN SERV is unfolding a W-X-Y correction from its 13,220 high:
Wave W completed as a zigzag down to 7038.
Wave X unfolded as a zigzag rally, peaking at 9775. Notably, Wave C of X did not reach 100% of Wave A — signaling internal weakness.
Wave Y is now developing as a red A-B-C structure, with Wave A possibly ending near the 8930 level.
🧠 Conclusion & Key Levels to Watch
Wave A of Y appears to be nearing completion, supported by:
Ending diagonal structure in wave C (1H)
RSI bullish divergence
Price stalling at 1.618 extension
A breakout above the channel could mark the start of Wave B — potentially retracing 38–61.8% of the drop from 9775
📌 This setup offers both short-term and structural clues. I’ll post follow-ups as this unfolds.
⚠️ Disclaimer
This post is for educational purposes only and does not constitute financial advice. Please do your own research and manage risk appropriately.
Trent Price Action Decoded – Simplicity Wins!No calls, no forecasting — just pure price action. In this post, I’m simply sharing how I see Trent’s chart. Clean structure, organic movement, and a simple approach to reading the price. For those who enjoy observing the market without noise or bias.

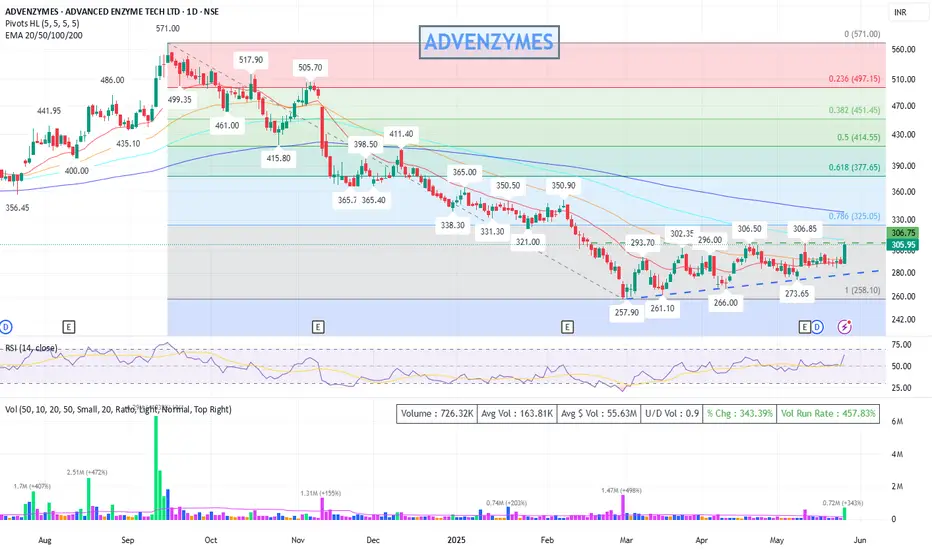
Bullish structure : ADVENZYMES - Ascending Triangle
### 🧾 **Chart Type & Time Frame**
* **Daily Candlestick Chart** (1D)
* **Exchange**: NSE (India)
* **Latest Price**: ₹305.95 (+6.12% on the day)
* **Volume**: 726.33K (well above average — **457.83%** Volume Run Rate)
---
### 📉 **Trend Analysis**
* **Primary Trend**: Downtrend from ₹517.90 (high in Nov 2024) to a bottom around ₹257.90 (March 2025).
* **Current Action**: Price is showing a **potential reversal** from a long downtrend.
* **Higher Lows Pattern**: Since the bottom at ₹257.90, price has made:
* ₹261.10 → ₹266.00 → ₹273.65 → ₹306.85 → (Now breaking above ₹306.75)
This forms an **ascending triangle** pattern (bullish bias).
---
### 📊 **Indicators & Overlays**
#### 1. **Moving Averages (EMA)**
* EMA levels:
* EMA-20: ₹290.07
* EMA-50: ₹292.01
* EMA-100: ₹310.17
* EMA-200: ₹337.89
**Current price (₹305.95)** is:
* Above EMA-20 & EMA-50 → Short-term bullish
* Slightly below EMA-100 and EMA-200 → Mid-to-long term resistance still ahead
If it breaks and sustains above EMA-100 & EMA-200, stronger uptrend confirmation.
---
#### 2. **Fibonacci Retracement (from ₹571 to ₹258)**
* **Key levels:**
* 23.6% → ₹497.15
* 38.2% → ₹451.45
* 50% → ₹414.55
* 61.8% → ₹377.65
* 78.6% → ₹325.05 *(Immediate target zone)*
**Price approaching 78.6% retracement (₹325.05)**, which is a key resistance zone. A breakout here can push prices towards ₹337-₹350 zone.
---
#### 3. **RSI (14, Close)**
* Current RSI: **\~62.90**
* Moving above the 60 level, indicating building bullish momentum.
* Still not overbought (>70), room for upward move exists.
---
#### 4. **Volume**
* Spike in volume on the breakout day → Strong confirmation.
* Today's volume: **726.33K** vs average 163.81K → Over **4x average**.
---
### 📌 **Support & Resistance Levels**
#### Key Resistance:
* ₹306.85 (recent swing high) → **Broken today**
* ₹325.05 (Fibo 78.6%)
* ₹337.89 (EMA-200)
* ₹350–365 (previous price clusters)
#### Key Support:
* ₹293–296 (previous resistance, now support)
* ₹273.65 (swing low)
* ₹258 (Fibo 100% level)
---
### 🔺 **Pattern Observed**
* **Ascending Triangle** breakout confirmed with high volume
* Bullish structure: Higher lows with flat resistance (₹306 zone)
* If price sustains above ₹306, could target ₹325–₹350 short term
---
### 🔮 **Conclusion & View**
✅ **Bullish Bias in Short Term**
* Breakout of important level with strong volume
* RSI supportive
* EMA crossovers may follow if trend continues
📈 **Short-Term Target**: ₹325 → ₹337 → ₹350
📉 **Stop Loss**: ₹293 or ₹280 (based on risk appetite)
📌 Disclaimer: This analysis is for educational and informational purposes only and does not constitute investment advice. Please do your own research or consult with a financial advisor before making any trading decisions. Markets are subject to risks.
SBI card may test 1025 soon.Showing strength in weak market.
Analysis: -As per chart SBI card took proper support at 78.6% level and reversed. Moreover, it given break out of major trendline level 785. It is showing strength after retest of break level 785. as per chart it may test 1025 soon.

IDEA : At End of Bearish trend ; Expect correction or Bullish Idea showing 5 waves falling from Rs19 - 6Rs ; if price undergo for a correction expect minimum Rally 11Rs( i.e 38.2%) ,and maximum 15Rs.

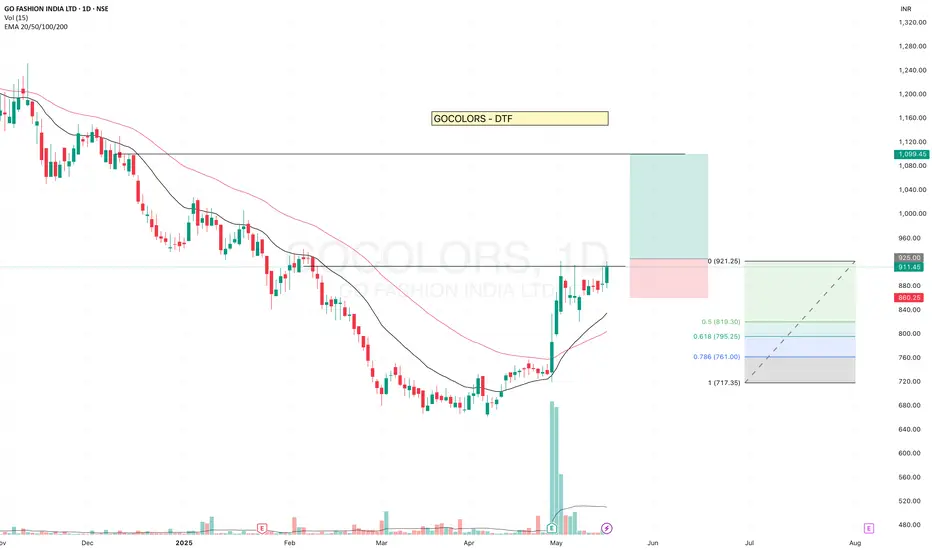
GOCOLORS - Getting ReadyGOCOLORS is getting ready and has been testing the resistance level.
- It is consistently trading above the 20 EMA. Recent high-volume candles suggest clear institutional participation. Although volume is currently drying up, the price is sustaining — a positive sign.
- The stock reversed after touching the 0.5 Fibonacci retracement level, indicating strength.
✅ If you like my analysis, please follow me as a token of appreciation :)
in.tradingview.com/u/SatpalS/
📌 For learning and educational purposes only, not a recommendation. Please consult your financial advisor before investing.