Fibonacci Retracement

GUJARAT AMBUJA EXPORTS: Long term positive outlook NSE:GAEL shows strong buy indicated by PSAR, MACD & Fisher crossover followed by EMA & MA Crossover
Target 2: 470.20
Target 1: 383.50
Stop Loss: 286.85
𝑫𝒊𝒄𝒍𝒂𝒊𝒎𝒆𝒓:
The analysis is only for illustration purposes only. Please consult your financial advisor, agent, broker before acting on any information. We may or may not have positions in the stock and our actions may be contrary to the one mentioned here. This analysis may or may not be updated. We would not be responsible for the profit/loss resulting from this analysis.

Hindustan Unilever long opportunityNSE:HINDUNILVR
Stock -> Hindustan Unilever
TimeFrame -> Weekly
Hello all!
Hindustan Unilever has corrected about 40% from its highs in September 2021. The stock has been in a downtrend since then and has been taking stiff resistance from trendline 1. It approached its strong support band of 1850-2000 and took a strong bounce from there with good volumes and also broke trendline 1. The retest of the trendline has been done and its followed by a bullish candle. This thus makes for a good opportunity to go long.
Apart from the price action, the stock also seems to be taking support from its 200 weekly EMA. Also the bounce has come from the 50% fib level which further strengthens the conviction on going long.

gbpusd shortin my opinion it will continue downside at least to the marked level, but wait for the confirmation from both scenario

NHPC LTD: GROWTH TREND NSE:NHPC shows strong buy indicated by PSAR, MACD & Fisher crossover followed by EMA & MA Crossover
Target 2: 37.60
Target 1: 34.85
Stop Loss: 29.05
𝑫𝒊𝒔𝒄𝒍𝒂𝒊𝒎𝒆𝒓:
The analysis is only for illustration purposes only. Please consult your financial advisor, agent, broker before acting on any information. We may or may not have positions in the stock and our actions may be contrary to the one mentioned here. This analysis may or may not be updated. We would not be responsible for the profit/loss resulting from this analysis.

Breakout From ConsolidationAfter a hugh upmove stock has been in consolidation.
Now stock has give a good breakout with almost highest volume since Sep 2021.
It has been consolidating and strongly taking support at 038 fibo level.
For last three weeks it have been approaching the resistance line and now gave breakout.
There is high probability that it may make a new fresh 52 week high in upcoming weeks.
This post is for information purpose only.
Do not consider it as call.


MISTANN FOODS LIMITED: UPWARD TREND STARTINGBSE:MISHTANN shows strong buy indicated by PSAR, MACD & Fisher crossover.
Target 1: 32.85
Target 2: 39.35
Stop Loss: 26.55
𝑫𝒊𝒔𝒄𝒍𝒂𝒊𝒎𝒆𝒓:
The analysis is only for illustration purposes only. Please consult your financial advisor, agent, broker before acting on any information. We may or may not have positions in the stock and our actions may be contrary to the one mentioned here. This analysis may or may not be updated. We would not be responsible for the profit/loss resulting from this analysis.

Banknifty to crack hard in Z waveBanknifty Elliott wave count as shown in charts from wave 1 to 5.
Currently we are in complex wxyxz correction. The final Z wave should be in progress which should break previous low.
The new low is expected to be between 31400 to 30000
The drop from X wave can be looked as Zig zag correction on downside with current wave B in progress and will start C wave once breaks 35511 low as shown in below image
Charts will be invalid if breaks 38766
DISCLAIMER:
There is no guarantee of profits or no exceptions from losses.
The stock and its levels discussed are solely the personal views of my research.
You are advised to rely on your judgement while investing/Trading decisions.
Seek help of your financial advisor before investing/trading.
Investment Warnings:
We would like to draw your attention to the following important investment warnings.
-Investment is subject to market risks.
-The value of shares and investments and the income derived from them can go down as well as up.
-Investors may not get back the amount they invested - losing one's shirt is a real risk.
-Past performance is not a guide to future performance.
-I may or may not trade this analysis
--------------------------(((((LIKE)))))-------------------------------

GHCL: LONG TERM HOLDNSE:GHCL shows strong buy indicated by PSAR, MACD & Fisher crossover.
Target 1: 748.85
Stop Loss: 625.30
𝑫𝒊𝒔𝒄𝒍𝒂𝒊𝒎𝒆𝒓:
The analysis is only for illustration purposes only. Please consult your financial advisor, agent, broker before acting on any information. We may or may not have positions in the stock and our actions may be contrary to the one mentioned here. This analysis may or may not be updated. We would not be responsible for the profit/loss resulting from this analysis.

Nifty 50,Elliot wave , fibofrom previous top 18100, downword 5 wave correction is going in nifty 50 ,4 wave coreection (abc) is done around 17400 level now we may see 16200-16080 level in few days


nifty head and shoulder pattern formation going onnifty immediate support comes around 16800
right now h&s pattern formation going on of which neckline comes around 16800--775
breaking of the same will bring more weakness...
Temporary bounce or pause possible around 16800
index sell on rise mode
views are educational

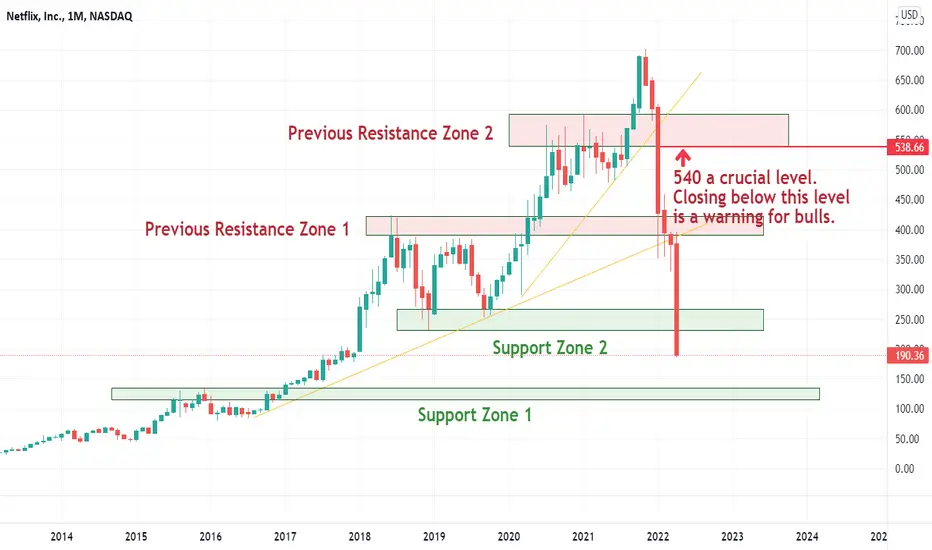
Is Netflix headed towards 120?This analysis is on Netlifx ($NFLX) which made a ATH of around 700 and now is present trading at 190 levels. Everything happened so fast, in a matter of just under a month of trading, that many investors lost big money. So what was the crucial level? And where were the supports? Why didnt the support work? Did Earnings alone spoil everything? Markets discount everything and charts have a way of telling the same because they represent unbaised price action. According to my analysis, 540 was a crucial level. A day closing below this triggered a major sell off. The next support was at 340 levels according to Fibonnaci retracement at 61.8%. But it didnt hold. So the next level is around 120!
Good trade - ZEEL - 27-04-22.Hello Guys,
Sharing my todays trade just for a learning purpose for you all and myself too.
I missed the entry coz of my office work. But I got another entry point at retracement.
ANALYSIS & TRADE :
* Overall Downtrend so this stock is in my SHORTing list.
* And triangle pattern gives breakdown all went Acc. to my plan - BUT I MISSED THE ENTRY.
* Because of position sizing and RR wait for a good retracement and thanks to ZEEL its follow price action.
* I entered and this time set an alarm above the target price.
* I was busy with my office work and a HAPPY ALERT BEEP.
* Just starts trailing STOP LOSS and not much but some extra points benefit I took by trailing.
LEARNING :
- Never take entry in a FOMO.
- Its perfectly fine if we miss a trade, NEVER LOOSE MONEY.
- Stick to your trading plans - Never change them.
Thank you so much,
Same look a like trade i took in ABCAPITAL. there also i missed the entry ( Because of a MARUBOZU Candle) - I Never enter in MARUBOZU or parabolic moves. I wait and track the stock and I GOT A DIVERGENCE at next RESISTANCE.
Comment if you want ABCAPITAL trade setup also.
THANKYOU.

POWERGRID - Breakout after reversal - Swing TradeThe analysis is done on daily TF hence price may take few days to few weeks in order to reach the targets.
Trade setup is explained in image itself.
The above analysis is purely for educational purpose. Traders must do their own study & follow risk management before entering into any trade
Checkout my other ideas to understand how one can earn from stock markets with simple trade setups. Feel Free to comment below this or connect with me for any query or suggestion regarding this stock or Price Action Analysis.

Indus Towers taking support + Big bullish candle NSE:INDUSTOWER Indus towers making a big reverse from the support with a heavy bullish candle. Can buy at current levels. SL, TARGET are mentioned in the chart.

DOLAT ALGOTECH LTD: UPTREND StartingNSE:DOLATALGO shows strong buy indicated by PSAR, MACD & Fisher crossover.
Target 2:127.95
Target 1:106.25
Stop Loss: 71.30
𝑫𝒊𝒔𝒄𝒍𝒂𝒊𝒎𝒆𝒓:
The analysis is only for illustration purposes only. Please consult your financial advisor, agent, broker before acting on any information. We may or may not have positions in the stock and our actions may be contrary to the one mentioned here. This analysis may or may not be updated. We would not be responsible for the profit/loss resulting from this analysis.

ADANI PORTS SPECIAL: LONG TERM HOLDNSE:ADANIPORTS shows strong buy indicated by PSAR, MACD & Fisher crossover.
Target 1: 901.60
Stop Loss: 815. 25
𝑫𝒊𝒔𝒄𝒍𝒂𝒊𝒎𝒆𝒓:
The analysis is only for illustration purposes only. Please consult your financial advisor, agent, broker before acting on any information. We may or may not have positions in the stock and our actions may be contrary to the one mentioned here. This analysis may or may not be updated. We would not be responsible for the profit/loss resulting from this analysis.

#ADANIPORTS - DARVAS BOXAccumulation and Distribution zone #FIBO_levels #Golden_ratio_zone #Darvas_box

Manali Petrochemicals | Swing | Fibonacci Retracement | SMA1. Up Trend
2. 20 day SMA
3. Support & Resistance Levels
4. Fibonacci Levels
Confirming to take Long Swing Position as Shown
Entry @140
Stop Loss @135
Target @150

COLGATE-PALM INDIA: UPWARD TRENDBSE:COLG1! shows strong buy indicated by PSAR, MACD & Fisher crossover.
Target 1: 1663.55
Target 2: 1726.00
Stop Loss: 1546.55
𝑫𝒊𝒔𝒄𝒍𝒂𝒊𝒎𝒆𝒓:
The analysis is only for illustration purposes only. Please consult your financial advisor, agent, broker before acting on any information. We may or may not have positions in the stock and our actions may be contrary to the one mentioned here. This analysis may or may not be updated. We would not be responsible for the profit/loss resulting from this analysis. BSE:COLG1!

DABUR INDIA LTD: UPWARD MOMENTUM STARTINGNSE:DABUR shows strong buy indicated by PSAR, MACD & Fisher crossover.
Target 1: 570.80
Target 2: 587.05
Stop Loss: 548.55
𝑫𝒊𝒔𝒄𝒍𝒂𝒊𝒎𝒆𝒓:
The analysis is only for illustration purposes only. Please consult your financial advisor, agent, broker before acting on any information. We may or may not have positions in the stock and our actions may be contrary to the one mentioned here. This analysis may or may not be updated. We would not be responsible for the profit/loss resulting from this analysis.
