JUBILANTFOOD Trading Setup1. Long term Bullish Trend
2. Bullish Pinbar at 0.382 Fibo level
3. Favorable Risk:Reward
Fibonacci Retracement

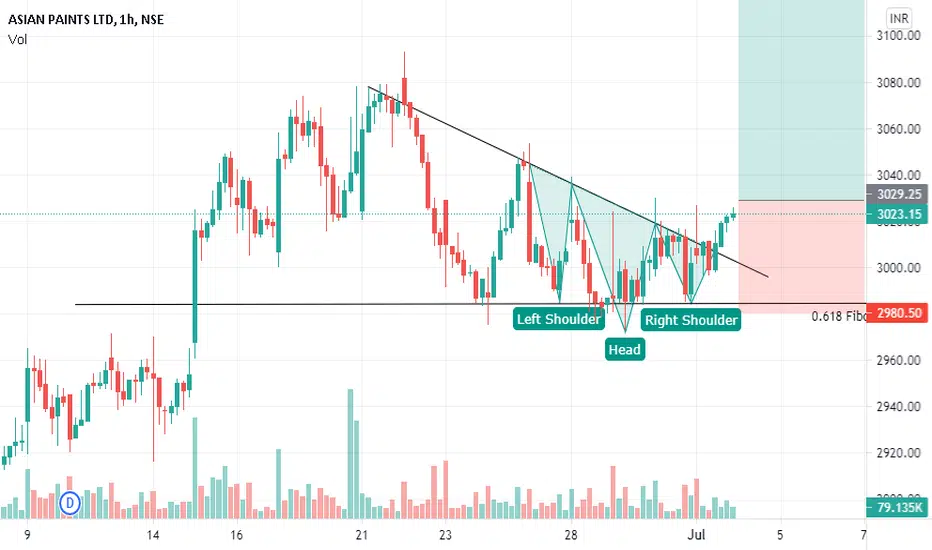
ASIAN PAINTS Trading Setup1. Consolidation after long term Bullish Trend
2. 0.618 Fibonacci support
3. Head & Shoulder pattern
4. Trendline Breakout
Crude oil News effectas soon the News came out its Effect USoil Badly You can see clearly ..
here is the next direction for Crude oil


Fibonacci Masterclass - Fibonacci Retracement and ExtensionHi guys, I have finally completed the thread on Fibonacci (Though it took longer than usual). I have tried with the best of my little knowledge to create this thread. This has everything you need to know about Fibonacci retracement and Fibonacci extension. Also, if the thread is free that doesn't mean I have compromised with the quality. All you have to do is just read this thread again and again until you get a good grasp of it. everything.
Table of Contents:
1. What Are Fibonacci Retracement Levels?
2. Significance of Fibonacci Retracement levels
3. Finding Fibonacci Retracement Levels
4. How to use the Fibonacci retracement levels?
5. What are Fibonacci Extensions?
6. Significance of Fibonacci Extension levels
7. Finding Fibonacci Extension levels
8. Difference Between Fibonacci Retracements and Fibonacci Extensions
What are Fibonacci Retracement levels?
• Fibonacci retracement levels are horizontal lines that indicate areas where the price could stall or reverse.
• These horizontal levels can act as a potential support or resistance levels
• They are based on Fibonacci numbers. Each level is associated with a percentage which means how much of a prior move the price has retraced.
• The Fibonacci retracement levels are 23.6%, 38.2%, 61.8%, and 78.6%.
• While 50% is not a pure Fibonacci ratio, but it is still used as a support and resistance indicator. This is because people worldwide regard it as an important level.
• The price won’t always bounce from these levels. They should be looked at as areas of interest. Hence, please use the Fibonacci retracement as a confirmation tool.
Significance of Fibonacci Retracement levels
Fibonacci retracements can be used to:
• Place entry orders
• Determine stop-loss levels
• Set price targets
For example, A stock may be in an uptrend. After a move up, it retraces to the 61.8% level. Then, it starts to go up again. Since the bounce occurred at a Fibonacci level during an uptrend, you can enter long positions with a stop loss just below the Fibonacci level or at the candlestick low.
Finding Fibonacci Retracement levels
In order to find the Fibonacci retracement levels, you have to find the recent significant Swing High and Swing Low.
• For uptrends, select the Swing Low and then the Swing High.
• For downtrends, select the Swing High and then the Swing Low.
Example: Fibonacci retracement in an uptrend
Example: Fibonacci retracement in a downtrend
How to use the Fibonacci retracement levels?
If the price is approaching a Fibonacci level, you should look out for the following things at the point of interaction or in the vicinity of the level.
• Some reversal candlestick pattern
• Volume is above average.
• Moving average
• RSI divergence
• Previous S/R level or pivot level
The trade will be a high probability trade if some of these factors create a confluence zone.
What are Fibonacci Extensions?
• Fibonacci extension is a tool that can be used to find price targets or estimate how far a price may move after the retracement/pullback is over.
• Extension levels are also possible areas of interest where the price may stall or reverse.
• It can be used to find projected areas of support or resistance when the price is moving into an area where other methods of finding support or resistance are not applicable or evident.
• If in a stock, a new high/low occurs, the trader can use the Fibonacci extension levels to get an idea of where the price can go.
• Fibonacci extension levels can be calculated to give the trader ideas on profit target placement.
Significance of Fibonacci Extension levels:
• Fibonacci extensions can be used for any timeframe and in any market- stocks, commodities, cryptocurrencies, etc.
• Fibonacci extension levels indicate a price area that will be significant for the stock after the pullback/correction is over.
• Extension levels can be drawn on different price waves over time. When levels from these different waves converge at one price, that could be a very important area.
Finding Fibonacci Extension levels
In order to find the Fibonacci extension levels, you have to find the recent significant Swing High and Swing Low.
• For uptrends, click on the Swing Low and then on the Swing High. Then go to the Fibonacci setting and click on reverse. Or if your software directly has the extension tool then it’s even easier.
• For downtrends, click on the Swing High and then on the Swing Low. Then go to the Fibonacci setting and click on reverse.
Example: Fibonacci extension in an uptrend
Example: Fibonacci extension in a downtrend
Difference Between Fibonacci Retracements and Fibonacci Extensions
• Fibonacci retracements provide levels for a pullback whereas Fibonacci extensions provide levels to move in the direction of the existing trend.
• For instance, a stock goes from 50 to 100, and then back to 75. The move from 100 to 75 is a retracement. If the price starts rallying again and goes to 150, that is an extension because the price moved past the previous swing high which is 100 in this case.
This is everything you need to know about Fibonacci retracement and extension levels. This thread is more than enough to make you profitable. Keep reading and revising until you learn everything written in this post. I hope you find this post useful. Also, if anyone is interested in getting a consolidated PDF version of this thread, then you can message me, I'll provide it.
Disclaimer: This is NOT investment advice. This post is meant for learning purposes only. Invest your capital at your own risk.
Happy learning. Cheers!
@johntradingwick

Godrej Properties Positional Trade Setup For Tuesday (13th July)As you see in the Godrej Properties stock Fibonacci Retracement has happened in the previous day.
.
And same thing in last one week, after touching 1540, it retraced the level of .5.
.
Now tomorrow we can take the positional trade, once it cross the level of 1540.
.
Then 1560-1590 is out Targets.
.
What's your view on this comment below in the box.

Want 30% mover then watch this 10min video - Analysis made easy👑 Drop a follow here: @Averoy_Apoorv_Analysis 👑 ----------------------- 🔥🔥 Target: 2000 Followers 🔥🔥
👑 ITs a very good analysis video as I will try to trade this in realtime with you guys of course risk is diff for diff people but trading quality matters, not quantity :)
Good luck keep it in your watch now
⌛ Motivational and psychological area ⌛
✣Trade only if you are in the right mindset, if you have been emotionally weak for some time, take your time and don't trade, trade with a happy and + mindset only.
✣If you want to make money, firstly be prepared to lose it, only that much which you can afford and that much by which you can make a mistake again, learn from them and grow
✣Don't lose hope and keep grinding
✣I have seen my friends on youtube streaming games with watching 10, constantly they streamed for a year or two and now they are buzzing with 1k to 2k watching daily.
✣Focus on the process, you are here to make money not stupid decisions and lose it all
✣No one will help you climb the mountain, few will tell the path, so follow good people, make good mentors and make good decisions and choices in the stock market.
✣Believe in yourself :)
🎓🎓 Some info about me :)
➼My name is Apoorv and I am a 2nd year Engineering student, I want to pursue trading as my career, and thus whatsoever setups or trades I potentially see on my charting platform, I post it here and share them with you all.
➼I hope you will love my simple analysis style.
➼Feel free to suggest your view on this as learning is earning here :)
➼I take my trades on my Zerodha account :)
➼I don't take all the trades I post
➼These charts are my and only my work, my thought process, just from an educational point of view and no calls.
☃☃☃☃ Thank You Have a Nice Trading Day ☃☃☃☃

CEBBCO LONGChart is self explanatory.
Trail Stop loss
FOLLOW IF YOU LIKE THE ANALYSIS
LIKE AND COMMENT WHAT YOU THINK ABOUT IT!!

#KALYANKJIL .. A Broader Perspective on the price actionPlease see the chart for my perspective and interpretation of the price action for Kalyan Jewellers stock.
With this post, I am trying to adopt a more explanatory approach towards my analysis along with an attempt to make charts more visually appealing and clutter-free.
For any feedback about the analysis or the presentation, feel free to drop a comment below.
If you agree with my assessment please like my post.
And it goes without saying but follow me for more stock ideas.

#AFFLE .. This may be an opportunity to buy for 30%There is a sharp recovery from the 78.6% fib retracement level and now stock is hovering around 61.8% retracement levels..
Open position when price closes with a green (preferably long with volumes) bullish candle above 4600, can be easy 30% from here
Intermediate targets are marked too. Fo SL use 4450

Patience will give 10% in SAIL 👑 Drop a follow here: @Averoy_Apoorv_Analysis 👑 ----------------------- 🔥🔥 Target: 1000 Followers 🔥🔥
🔥 Strategy :
✣ Channel pattern breakout on 1M chart
✣ Good monthly consolidation and weekly too
✣ On a weekly basis good retracement of 30% multiple times tested near that level
✣ Good triangle pattern on 1hr and 1d both ( Trade on TF whichever suits your setup and RR ratio )
✣ In 1hr you can take it on a lower trendline for a low-risk high reward setup or on a breakout, SL as per your risk and reward setup and mindset
✣ Targets = 150 ( 10% from breakout point )
✣ My trade activation would be on 135-136 levels at 1hr close candle
⌛ Motivational and psychological area ⌛
✣Trade only if you are in the right mindset, if you have been emotionally weak for some time, take your time and don't trade, trade with a happy and + mindset only.
✣If you want to make money, firstly be prepared to lose it, only that much which you can afford and that much by which you can make a mistake again, learn from them and grow
✣Don't lose hope and keep grinding
✣I have seen my friends on youtube streaming games with watching 10, constantly they streamed for a year or two and now they are buzzing with 1k to 2k watching daily.
✣Focus on the process, you are here to make money not stupid decisions, and lose it all
✣No one will help you climb the mountain, few will tell the path, so follow good people, make good mentors and make good decisions and choices in the stock market.
✣Believe in yourself :)
🎓🎓 Some info about me :)
➼My name is Apoorv and I am a 2nd year Engineering student, I want to pursue trading as my career, and thus whatsoever setups or trades I potentially see on my charting platform, I post it here and share them with you all.
➼I hope you will love my simple analysis style.
➼Feel free to suggest your view on this as learning is earning here :)
➼I take my trades on my Zerodha account :)
➼I don't take all the trades I post
➼These charts are my and only my work, my thought process, just from an educational point of view and no calls.
☃☃☃☃ Thank You Have a Nice Trading Day ☃☃☃☃


All you need to know about RELIANCE in 6 minutes 🔥👑 Drop a follow here: @Averoy_Apoorv_Analysis 👑 ----------------------- 🔥🔥 Target: 1000 Followers 🔥🔥
🔥 Common sense used: If you want to know the details of the trade I have posted a picture too of the same analysis with all its parameters defined well in description of that post, do check out that post its linked at the bottom of this post :) just for perfect level and entry, SL number wise :)
⌛ Motivational and psychological area ⌛
✣Trade only if you are in the right mindset, if you have been emotionally weak for some time, take your time and don't trade, trade with a happy and + mindset only.
✣If you want to make money, firstly be prepared to lose it, only that much which you can afford and that much by which you can make a mistake again, learn from them and grow
✣Don't lose hope and keep grinding
✣I have seen my friends on youtube streaming games with watching 10, constantly they streamed for a year or two and now they are buzzing with 1k to 2k watching daily.
✣Focus on the process, you are here to make money not stupid decisions, and lose it all
✣No one will help you climb the mountain, few will tell the path, so follow good people, make good mentors and make good decisions and choices in the stock market.
✣Believe in yourself :)
🎓🎓 Some info about me :)
➼My name is Apoorv and I am a 2nd year Engineering student, I want to pursue trading as my career, and thus whatsoever setups or trades I potentially see on my charting platform, I post it here and share them with you all.
➼I hope you will love my simple analysis style.
➼Feel free to suggest your view on this as learning is earning here :)
➼I take my trades on my Zerodha account :)
➼I don't take all the trades I post
➼These charts are my and only my work, my thought process, just from an educational point of view and no calls.
☃☃☃☃ Thank You Have a Nice Trading Day ☃☃☃☃

How to get 12% using Swing trading in HONAUT - Common sense👑 Drop a follow here: @Averoy_Apoorv_Analysis 👑 ----------------------- 🔥🔥 Target: 1000 Followers 🔥🔥
🔥 Common sense used :
📌 Weekly time frame: Make 2 fib from 2 different from one will give you 30% retracement of price and one will give 50% - a sign of extreme bullishness
📌 The supply zone is broken and now converted into a demand zone on those bullish levels as described in the video
📌 Beautiful wedge pattern breakout did and kind of retested too made a bullish closing last Friday too
📌 on 30min TF a good breakout of the consolidation can be trade activation for 10 to 12% from those levels
📌 SL of 3% will be good enough as the buying pressure is making wicks from the downward side
📌 Trade as per your setup now and risk should be well defined and cared too, Good luck :)
⌛ Motivational and psychological area ⌛
✣Trade only if you are in the right mindset, if you have been emotionally weak for some time, take your time and don't trade, trade with a happy and + mindset only.
✣If you want to make money, firstly be prepared to lose it, only that much which you can afford and that much by which you can make a mistake again, learn from them and grow
✣Don't lose hope and keep grinding
✣I have seen my friends on youtube streaming games with watching 10, constantly they streamed for a year or two and now they are buzzing with 1k to 2k watching daily.
✣Focus on the process, you are here to make money not stupid decisions, and lose it all
✣No one will help you climb the mountain, few will tell the path, so follow good people, make good mentors and make good decisions and choices in the stock market.
✣Believe in yourself :)
🎓🎓 Some info about me :)
➼My name is Apoorv and I am a 2nd year Engineering student, I want to pursue trading as my career, and thus whatsoever setups or trades I potentially see on my charting platform, I post it here and share them with you all.
➼I hope you will love my simple analysis style.
➼Feel free to suggest your view on this as learning is earning here :)
➼I take my trades on my Zerodha account :)
➼I don't take all the trades I post
➼These charts are my and only my work, my thought process, just from an educational point of view and no calls.
☃☃☃☃ Thank You Have a Nice Trading Day ☃☃☃☃

Nifty Zig Zag Correction possible X wave towards 15800Nifty formed today falling wedge pattern after few hours opening. This is also called ending diagonal appearing in wave 5 or C wave.
Wedge broken channel price was thrown under channel made low 15637.
Entire ABC move from 15916 completed near 15637.
Wedge had confirmed upside with 15688 breakout point.
Today it completed A wave of correction going up to 15710 then B was down to 15665
Currently C wave started expected to go towards 15808 or 0.618 Fibonacci retracement of move 15916-15637.
Move above 15770 to 15808 is expected to make price Throw Over channel.
DISCLAIMER:There is no guarantee of profits nor exceptions from losses.
Technical analysis provided on the chart is solely the personal views of my research.
You are advised to rely on your own judgments while taking any investing/Trading decisions.
Past performance is not an indicator of future returns. Investment/trading is subject to market risks.
Seek help of your financial advisors before investing/trading.
Not recommended to take FnO positions based on this analysis
I may or may not trade this analysis. Details in description.
-------(((((Please LIKE or Comment)))))-------

Nifty: Bullish Harami Candlestick pattern observed near SupportNifty
In morning post, the importance of 20 day EMA at 15677 and 61.8% retracement around 15628 was discussed and so was the level of 15735
Nifty respected all the levels very well ( 20 day EMA on closing basis, 61.8% retracement on intraday low basis and 15738 was the high for the day)😊
- Today's closing also reflects a Bullish Harami candlestick pattern which opens up doors for some upside move
(initial targets on Nifty 15804 / 15840 and further upside if closing is above 15865)
___________________________________________________________________________________________
Our strategy update
Had suggested to consider selling 15 July expiry 15700 Put option when it was trading around 120.
Closing price 100
Profit of 20 points so far per lot (this profit is despite Nifty being 111 points lower from levels when the trade was initiated)
This is where trading strategies come in handy. It may not give exorbitant profits per trade but it surely helps in better risk management and thereby increase your probability of more winning trades.
____________________________________________________________________________________________
Like & Follow for more such ideas
But don't just follow me blindly
Learn to identify such opportunities independently
_____________________________________________________________________________________________
Best wishes
Vaibhav Deshpande


Jubilant Foodworks Fibonacci based TradePositional Trade(2-3 weeks):
Buy: Jubilant Foodworks
CMP: 3118
Target 1: 3200
Target 2: 3230
Stop Loss: 3080


CUP & HANDLE PATTERN ANALYSIS 28.06.2021BUY : 85 TO 82
TARGET : 101 TO 108
Reason For Buying This Script :
In this script it has formed cup & handle formation in weekly time frame , So we can go for buy .
Note :
Above given levels are based on monthly & weekly time frame . So be patience it will take some days to achieve the target.
ALL THE BEST ..

Why you should be careful before trading in PRINCEPIPE As many of my followers were asking about PRINCEPIPES, here is my view, Plz read the whole If still, your setups match go for it :)
Logic points --
1) On Monthly charts, It has not given a good retracement
2) On the day chart if you make a Fibonacci retracement from the lowest part till the near term high then u will see a retracement of only 0.2
3) Such retracement either show heavy bullishness for the short term or can be deadly bearish for the long term faking out for the retracement part just like a breakout
4) A good consolidation on the D chart only doesn't mean bullishness, although the chart seems interesting and is consolidating continuously for some days so what to do now?
Answer: Either enter now if you are so attracted towards PRINCEPIPES and only wanted to trade in it as per your setup says, But then do make a good and strict SL and also use less capital ( really less ) just in case.
OR
Wait for some time, let it consolidate for some weeks or days more, and come to FIBONACCI levels retracement of 0.5 or 0.6 in order to get the real bullish momentum in the stock you are looking for.
Thank you, AAA

Jindalsteel @ Fibonacci 61.8% support with flag pattern Jindal steel taking support near 61.8% fib level after rally
also forming a flag and pole pattern
if breaks upper range with volume then it will be a good buy

SHOPPERS STOP - Monday TradeStock looks good for Swing and Intraday both.
For Intraday wait for 5/15 minute candle close above 270
