Daily Breakout at Maruti Suzuki IndiaGo for long position on NSE:MARUTI Because
1. Positive Divergence in RSI.
2. Breakout after 0.5 level of Fibonacci retracement.
Daily target at least 50-60%. Set your stop loss at a level of 0.5 Fibonacci retracements i.e; 7364.5.
Fibonacci Retracement

DLF: Chart set up and trading strategy for June month expiryDLF
- level of 308-313 holds significance for the stock
- given the set up one may consider to sell 320 Call option CMP around 6.3
- be cautious if DLF trades above 309 and exit if closes above 313
The strategy has a maximum profit potential of Rs 20790 per lot and has inbuilt loss protection for a rise in price up to 326.30 giving ample opportunity to adjust / exit in case view gets invalidated
Disclaimer
- The view expressed here is my personal view
- Past performance is not a guarantee for future predictions
- Use this for educational purpose
- Any decision you take, you need to take responsibility for the same
- It's your hard earned money. Treat it wisely
- Trade / Invest keeping in mind your trading style, goals and objectives, time horizon & risk tolerance
- if trading in F&O, understand that F&O trading involves risk
- Do take proper risk management measures
- Do your own analysis and consult your financial adviser if need be

buy bankniftybuy @niftybank cmp 34320 spot
sl below 34280 spot
tgt 34380----3420 spot
@Banknifty @index

Tata Motors Gearing Up for Impulse Wave 5 Tata Motors after Mar 2020 low 63 moved up by making wave 1 as leading diagonal
Next sub impulse wave (1) and (3) were normal waves without extension.
So (5) was explosive up raising 300% or wave (1)+(3) at 357.
After 357 high it retraced very small portion 0.232 Fibonacci level or 23% which is common in case of wave extended wave.
It appears to be making cup and handle pattern which could reach well towards 0.618 Fibonacci zones.
This rise from 280-360 is also observed to be leading diagonal
Minimum target of Wave 5 will be 0.618 of wave 1+3 combined which is 460
Long near 325-310 zone, with Stop loss 380, target 1 460, target 2 570
DISCLAIMER:There is no guarantee of profits nor exceptions from losses.
Technical analysis provided on the chart is solely the personal views of my research.
You are advised to rely on your own judgments while taking any investing/Trading decisions.
Past performance is not an indicator of future returns. Investment/trading is subject to market risks.
Seek help of your financial advisors before investing/trading.
Not recommended to take FnO positions based on this analysis
I may or may not trade this analysis. Details in description.
-------(((((Please LIKE or Comment)))))-------

Banknifty Triple Zig Zag Correction Complex CorrectionBank nifty going through triple zig zag complex correction and there is another 1000-1500 points correction possible towards 0.618 Fibonacci level.
With sharp recovery from 33909 its unclear if its A or Z wave completed already and new impulse started?
Monday will give Clear picture if its not able to cross channel top 35000 then we can expect C wave of Z to take it down towards 33500 (0.618)
Once correction is over we can expect V wave to begin towards 360000
This is the best possible Elliott wave count i can come up with, please hit like to motivate me to keep posting.
DISCLAIMER:There is no guarantee of profits nor exceptions from losses.
Technical analysis provided on the chart is solely the personal views of my research.
You are advised to rely on your own judgments while taking any investing/Trading decisions.
Past performance is not an indicator of future returns. Investment/trading is subject to market risks.
Seek help of your financial advisors before investing/trading.
Not recommended to take FnO positions based on this analysis
I may or may not trade this analysis. Details in description.
-------(((((Please LIKE or Comment)))))-------

TCNS BRANDS LONGChart is self explanatory
FOLLOW IF YOU LIKE THE ANALYSIS
LIKE AND COMMENT WHAT YOU THINK ABOUT THIS

MINDA INDUSTRIES LONGDaily charts of Minda Industries shows breakout from a crucial range (purple). After that a retrace is being witnessed. Retrace is expected till the purple zone.
Look for buying opportunities after the retrace and wait for confirmation candle. Also, after the retrace and a confirmation candle (with a good body and volume) it will also become a flag formation breakout, confirming bullishness!
Buy after retrace ensuring a confirmation candle.
Targets (buying around 614 after retrace) can be 678, 708, 740
STOP LOSS: 601
RSI correcting itself hence upside expected
Risk- Reward favorable
MACD bullish
FOLLOW IF YOU LIKE THE ANALYSIS
LIKE AND COMMENT WHAT YOU THINK ABOUT THIS!

NIFTY OUTLOOK Nifty is no doubt giving a fantastic rally even with minimum participation from FPI's. Definitely a certain percentage of Retail Investors are afraid to participate in this rally, But all they have collected is few peanuts by turning into bears in the due course of time. Now let's keep Bulls and bears aside. As an opportunist we all shall be always alert with the possible reversal levels and time cycles.
The first level that is see could be a small hindrance is 15860 to 15880. This is a Gann level of the Wave 4th of the Impulse and the Sub 2nd Wave of the 5th Wave. We can wait for any reversal at that level or simply may be we could see a removal of weak hands at that level.
The second level is a fibonacci retracements cluster of Wave 4th of the Impulse and the Sub 2nd Wave of the 5th Wave and that comes to be around 16220. Mark this as a very important level. 22nd June is the timecycle representing the expected high date.
So the basic expectation from the chart is 16220 by 22 JUN 2021 (More or less in term of time or price)
CHART AND ANALYSIS BY - ADARSH DEY
Nifty is still in a wolfe Wave and the chart was updated on 27/4/2021

Idea: At important Fibonacci supportIdea
9.45 / 8.8 are 2 important levels for Idea
The stock is at important 38.2% Fibonacci retracement support levels
Short term target 12 / 14
Exit if weekly closing is below 8.50
Sustaining above 14.5 levels and the doors would open for target of 22 / 28
At current levels it provides good risk::reward ratio to go long
Take care & safe trading...!!!

l&TFH LONG Trend line support The Stock took support at trendline and 0.5% retracement level so wait for any reversal and took the position or else wait for a breakdown
Disclaimer: Please consult your financial advisor,
Investment/Trading in the securities market is subject to market risk, We are not responsible for your profit or loss


BOMBAY DYEING LONGBreakout on daily charts with brilliant volumes.
Seeing some selling pressure currently. Good to buy if sustains above 96.50 today.
Add on retracements (after bounce back form retracements, add more)
ENTRY: Above 96.50 (if sustains)
Targets: 105, 115, 122++ (obeying the path marked)
Stop loss: 91.30 (Considering buying around 96.50)
TRAIL STOP LOSS
FOLLOW IF YOU LIKE THE ANALYSIS
LIKE AND COMMENT WHAT YOU THINK ABOUT THIS
THANKS

DASH - 4H Dash MACD is showing a bullish divergence. it will take near support and from their it will raise to point mentioned in the chart.


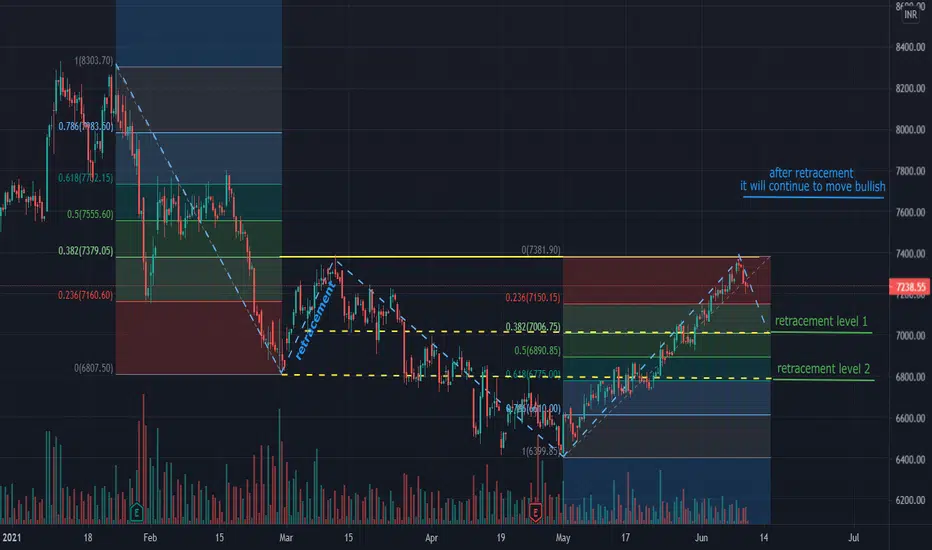
Bank Nifty analysis - bullish or bearishbank nifty
Analysis phase 1- Fibo retracement
38.2% retracement from the May'2020 to higher high of 16th Feb 2021.
Hence, down trend from 16th Feb to 22nd April is considered as a pull back.
Analysis phase 2 - bullish move
After 22nd April it moves very bullish with breakout around 22nd May over the trend line from previous high. this breakout confirmed bullish move further.
Since retracement it changes the slope very steep, like a run comes after a pull back.
it is expected to move higher than previous high.
keep an eye on the move!!!

UPL LTD. rounding bottom pattern !1) As per analysis, chart formed rounding bottom pattern, which indicates bullish momentum.
2) 1 Year trend line break out
Possible targets as per Fibonacci are:
1) 600
2) 630
3) 700
Feel Free To Ask For Any Technical/Fundamental Query
Comment Down Below
Educational Purpose Only.

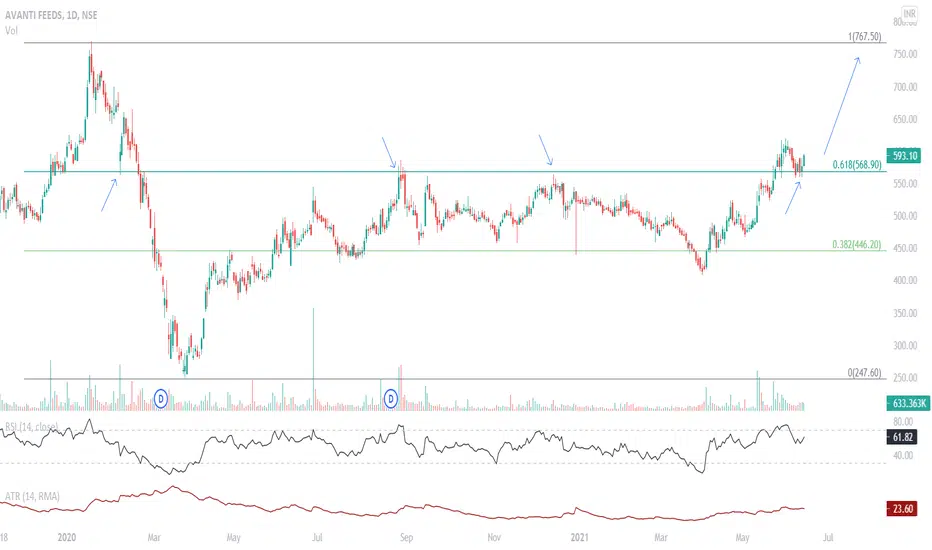
AVANTIFEED Reversing from Long Term 61.8 Retracement AVANTIFEED seems to be reversing from its long term 61.8 retracement zone. The stock has been hovering in the 38.2 and 61.8 zone for almost a year. Looks like a good buy here for eventual target of 750.
Johnsons Hitachi (JCHAC) at Year-Long SupportJohnsons Hitachi (JCHAC) stock is hovering at its year-long support where it has struck multiple times in the past. We are also at the 0.618 retracement from Aug'19 low to Mar'20 peak zone. We are closely monitoring the price action at this level. Any signs of bullishness would be a good time to go Long for a sharp up move. Will post an update on this post as we see something happening in the price of the stock.

MARUTI retracement in bullish moveFibonacci is one of the important tool to predict and understand the retracement of the stock.
MARUTI SUZUKI was in down trend since mid of Feb started retracement on 26th of Feb around 8610 and retraced by 38.2% till 7372, which is also a price at the current date. after this retracement it continued the down trend.
A trend reversal is observed on 30th of April and stock moved bullish since then. Now, it has reached to the high of the symmetric level from past retracement (7372). It expected to retrace atleast by 38.2% or to max to the level of 61.8%.
pls keep an eye on it and pls comment your observations too.
BHEL - A risk reward tradeBHEL is expected to announce it's quarter results today.. The stock opened gap down in the morning by over 10% and is still trading negative but the current close is much above the low of the day made. Should the results be favorable, the stock can fill the gap and give some nice move up. The low of the day tested the 50% Fib retracement level and has bounced off from there..

NCC Long Swing/PortFolio TradeAfter a strong break out rally, NCC has corrected for 3 months and taking strong support at Fibonacci retracement level of 61.8%.
The stock is overall bullish, waiting for a channel breakout. It is good for longterm investment portfolio as well.
Currently, we can take a swing trade in NCC:
Entry at hourly closing above 77
TGT 1 = 91 (17%)
TGT 2 = 100 (29%)
TGT 3 = 115 (49%)
Stoploss = 72

BITCOIN may see further downfall as per tech analysis tools.BITSTAMP:BTCUSD Bitcoins is forming the inverted cup handle pattern in daily timeframe which is bearish and trend continuous pattern which Technical analysts often use as selling opportunities because of their ability to "prove" the lack of buying pressure during the timeframe being assessed. i think it ll go down upto 22400$ level .
its just for eduactional and for analysis purpose. dont trade on basis of this.

Tata Motors ATHTata motors in near to its ATH and it has a great confluence of support n resistance. Pls see the chart to understand it. Above 351.50, I am bullish but blue lines are made as reversal points using Fibonacci and gann technic.
