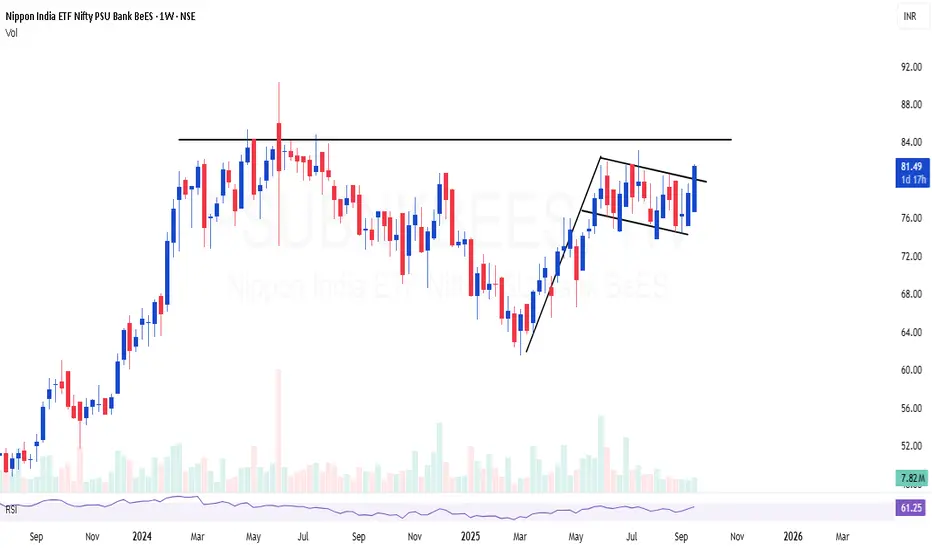
PSUBNKBEES | Excellent consolidation and flag formationPSUBNKBEES | Excellent consolidation and flag formation
Relatively safe bet on PSU Bank index, looks good for 30-40%
Flagbreak
AUTHUM INVEST - Bullish Flag & Pole Breakout (Daily T/F)Trade Setup
📌 Stock: AUTHUM INVEST ( NSE:AIIL )
📌 Trend: Strong Bullish Momentum
📌 Risk-Reward Ratio: 1:3 (Favorable)
🎯 Entry Zone: ₹2540.00 (Breakout Confirmation)
🛑 Stop Loss: ₹2142.00 (Daily Closing Basis) (-15 % Risk)
🎯 Target Levels:
₹2686.80
₹2842.05
₹3006.30
₹3180.00
₹3363.80
₹3558.20
₹3728.00 (Final Target)
Technical Rationale
✅ Bullish Flag & Pole Breakout - Classic bullish pattern confirming uptrend continuation
✅ Strong Momentum - Daily RSI > 60, Weekly RSI >60 Monthly rsi >60
✅ Volume Confirmation - Breakout volume 683.67K vs previous day's 44.95K
✅ Multi-Timeframe Alignment - Daily and weekly charts showing strength
Key Observations
• The breakout comes with significantly higher volume, validating strength
• Well-defined pattern with clear price & volume breakout
• Conservative stop loss at recent swing low
Trade Management Strategy
• Consider partial profit booking at each target level
• Move stop loss to breakeven after Target 1 is achieved
• Trail stop loss to protect profits as price progresses
Disclaimer ⚠️
This analysis is strictly for educational purposes and should not be construed as financial advice. Trading in equities involves substantial risk of capital loss. Past performance is not indicative of future results. Always conduct your own research, consider your risk appetite, and consult a financial advisor before making any investment decisions. The author assumes no responsibility for any trading outcomes based on this information.
What do you think? Are you watching NSE:AIIL for this breakout opportunity? Share your views in the comments!

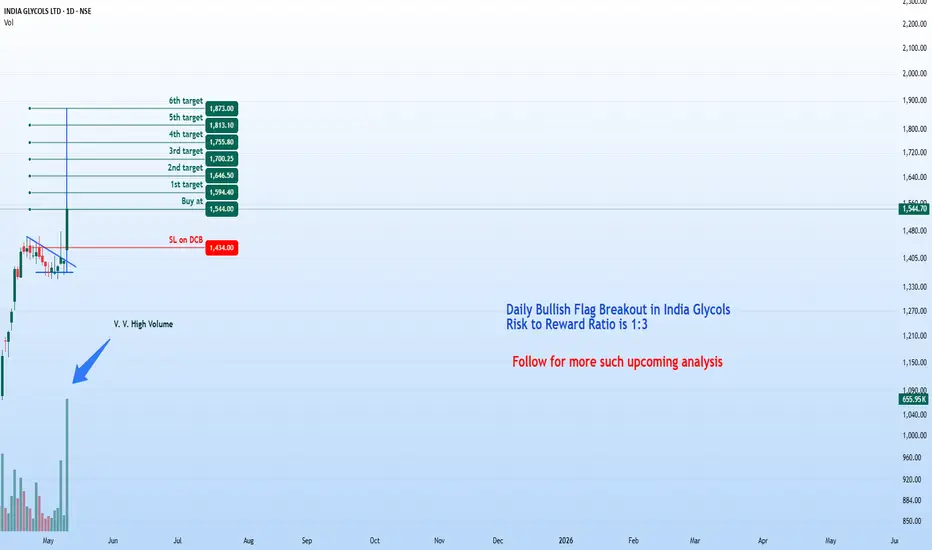
India Glycol Ltd – Bullish Breakout Setup (Daily Timeframe)Stock: India Glycol Ltd ( NSE:INDIAGLYCO )
Trend: Bullish Momentum 🚀 | Risk-Reward: 1:3
Trade Parameters
🎯 Entry: ₹1,544 (Breakout Confirmation)
🛑 Stop Loss: ₹1,434 (Daily Closing Basis | ~7.1% Risk)
🎯 Targets:
₹1,594.40
₹1,646.50
₹1,700.25
₹1,755.80
₹1,813.10
₹1,873.00 (Final Target)
Technical Rationale
✅ Bullish Flag Breakout – Price surged out of consolidation, signaling trend continuation.
✅ RSI Strength – Daily & Weekly RSI >60 (bullish momentum confirmed).
✅ Volume Surge – Breakout volume 656K (vs. previous day’s 75K – 8.7x spike!).
✅ Risk-Reward Advantage – Final target (₹1,873) offers 1:3 reward potential relative to risk.
Key Observations
High-volume breakout suggests institutional/strong hands participation.
Progressive targets allow for partial profit booking.
Stop loss on daily closing basis reduces intraday volatility risks.
Trade Management
Trail SL: Move stop loss to breakeven after Target 1 is hit.
Partial Booking: Secure profits incrementally at each target.
Discipline: Stick to the SL level to avoid emotional trading.
Disclaimer 📢
This analysis is strictly educational and does NOT constitute financial advice. Trading equities carries significant risk, including potential capital loss. Past performance is no guarantee of future results. Always conduct independent research or consult a certified financial advisor before making investment decisions. The author assumes no liability for financial outcomes based on this content.
Thoughts? Are you tracking NSE:INDIAGLYCO for this setup? Comment below!
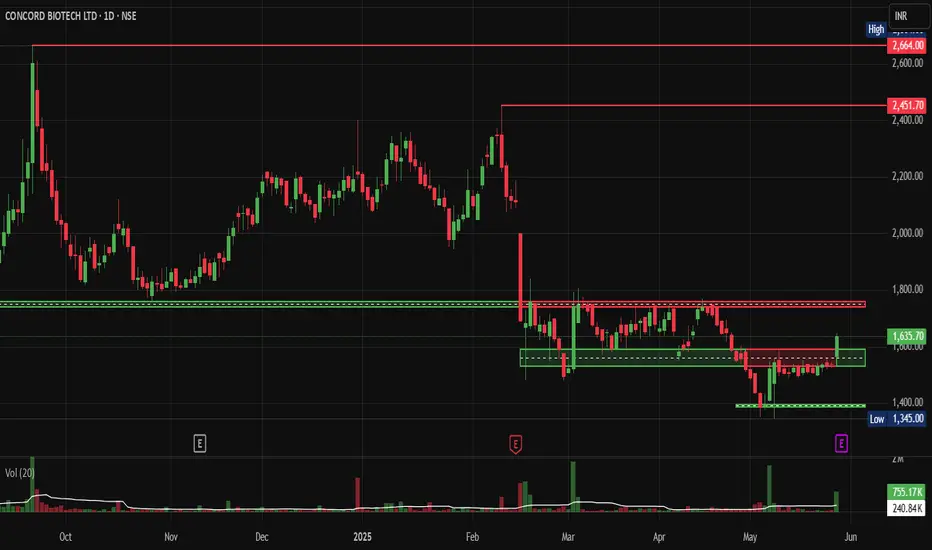
Concordbio: Flag Bo and VCP Setup after 6.5% Surge today.NSE:CONCORDBIO Hidden Pharma Gem Shows Classic VCP Setup After 6.5% Surge - Is Another Breakout Brewing? Well, the Structure looks beautiful, and the Results are tomorrow.
Technical Overview:
NSE:CONCORDBIO presents a compelling technical setup following a dramatic transformation from a prolonged consolidation phase to explosive momentum. The stock has exhibited textbook volatility contraction pattern (VCP) characteristics, culminating in what appears to be a flag breakout formation.
Price Action Analysis:
The stock experienced a significant markup phase from August to October 2024, surging from around ₹1,750 to peak levels near ₹2,664, representing approximately 52% gains. This initial thrust established new 52-week highs and demonstrated strong institutional accumulation based on the volume surge during the breakout phase.
Following this parabolic move, the stock entered a healthy consolidation phase from November 2024 through May 2025, forming a classic flag pattern. During this 6-month consolidation, the stock contracted its volatility significantly, with price action tightening between ₹2,400 resistance and ₹1,900 support levels.
Volume Analysis:
The volume pattern supports the technical setup:
- High volume during initial breakout phase (August-September 2024)
- Declining volume during consolidation (healthy distribution)
- Recent volume pickup suggests smart money accumulation
- Volume at support levels shows buying interest
Volatility Contraction Pattern (VCP) Confirmation
The chart clearly displays VCP characteristics:
- Initial strong uptrend with high volume (August-October 2024)
- Subsequent consolidation with contracting volatility and declining volume
- Multiple pullbacks of decreasing magnitude (typical VCP trait)
- Volume drying up during the consolidation phase, indicating a lack of selling pressure
- Recent volume expansion suggests renewed institutional interest
Key Technical Levels:
Support Levels:
- Primary Support: ₹1,531 (recent swing low)
- Secondary Support: ₹1,450-1,500 (psychological level and previous resistance turned support)
- Critical Support: ₹1,345 (absolute low, breach would invalidate bullish structure)
Resistance Levels:
- Immediate Resistance: ₹1,750-1,800 (flag upper boundary)
- Major Resistance: ₹2,400-2,451 (previous consolidation highs)
- Ultimate Target: ₹2,664 (52-week high)
Base Formation Analysis:
The stock has constructed a robust 6-month flag base following the initial breakout. This base formation shows:
- Tight price action with lower volatility
- Volume contraction during consolidation (healthy sign)
- Multiple retests of support levels without breakdown
- Ascending lows pattern within the flag structure
Trade Setup and Entry Strategy:
Pattern: Flag breakout from VCP base
Entry Zone: ₹1,650-1,680 (on breakout above flag resistance with volume)
Confirmation: Daily close above ₹1,700 with 2x average volume
Stop Loss: ₹1,500 (below key support and flag low)
Risk-Reward Ratio: Approximately 1:2.5
Target Levels:
- Target 1: ₹1,900 (measured move from flag pole)
- Target 2: ₹2,100 (intermediate resistance)
- Target 3: ₹2,400-2,450 (major resistance zone)
Position Sizing: Risk 1-2% of portfolio capital given the stop loss distance
Sectoral and Fundamental Backdrop:
NSE:CONCORDBIO operates in the pharmaceutical fermentation and biotechnology space, specialising in complex fermentation-based APIs and biosimilars. The sector has been experiencing renewed interest due to:
- India's growing prominence in global pharmaceutical supply chains
- Increasing focus on biosimilars and complex generics
- Government initiatives supporting domestic pharmaceutical manufacturing
- Rising healthcare expenditure and demand for specialised medicines
The company's fundamentals appear supportive of the technical breakout, with the fermentation and biotech segments showing strong growth potential in the post-pandemic environment.
Risk Factors:
- Broader market volatility could impact individual stock performance
- Pharmaceutical sector faces regulatory risks and pricing pressures
- Global economic uncertainties affecting export-dependent companies
- Technical failure below ₹1,500 would invalidate the bullish thesis
My Take:
NSE:CONCORDBIO presents a high-probability technical setup combining VCP pattern characteristics with flag breakout potential. The 6-month consolidation has allowed the stock to digest previous gains while building energy for the next leg higher. Current price action near key support levels offers an attractive risk-reward opportunity for momentum traders and swing investors.
The combination of strong sectoral tailwinds, solid base formation, and classic technical patterns makes this an interesting candidate for breakout traders willing to accept moderate risk for potentially substantial rewards.
Keep in the Watchlist.
NO RECO. For Buy/Sell.
📌Thank you for exploring my idea! I hope you found it valuable.
🙏FOLLOW for more
👍BOOST if you found it useful.
✍️COMMENT below with your views.
Meanwhile, check out my other stock ideas on the right side until this trade is activated. I would love your feedback.
Disclaimer: "I am not a SEBI REGISTERED RESEARCH ANALYST AND INVESTMENT ADVISER."
This analysis is intended solely for informational and educational purposes and should not be interpreted as financial advice. It is advisable to consult a qualified financial advisor or conduct thorough research before making investment decisions.
JKLAKSHMI CEMENT - Bullish Inverted H&S Breakout (Daily T/F)Trade Setup
📌 Stock: JK Lakshmi Cement ( NSE:JKLAKSHMI )
📌 Trend: Strong Bullish Momentum
📌 Risk-Reward Ratio: 1:3 (Favorable)
🎯 Entry Zone: ₹862 (Breakout Confirmation)
🛑 Stop Loss: ₹807 (Daily Closing Basis) (~6.4% Risk)
🎯 Target Levels:
₹899.60
₹938.85
₹979.80
₹1,022.50 (Final Target)
Technical Rationale
✅ Bullish Inverted H&S Breakout - Classic reversal pattern confirming uptrend continuation
✅ Strong Momentum - Daily & Weekly RSI >60 (Bullish zone)
✅ Volume Confirmation - Breakout volume 376K vs previous day's 193K (Nearly 2x surge)
✅ Multi-Timeframe Alignment - Daily and weekly charts showing strength
Key Observations
• The breakout comes with significantly higher volume, validating strength
• Well-defined pattern with clear neckline breakout
• Conservative stop loss at recent swing low
Trade Management Strategy
• Consider partial profit booking at each target level
• Move stop loss to breakeven after Target 1 is achieved
• Trail stop loss to protect profits as price progresses
Disclaimer ⚠️
This analysis is strictly for educational purposes and should not be construed as financial advice. Trading in equities involves substantial risk of capital loss. Past performance is not indicative of future results. Always conduct your own research, consider your risk appetite, and consult a financial advisor before making any investment decisions. The author assumes no responsibility for any trading outcomes based on this information.
What do you think? Are you watching NSE:JKLAKSHMI for this breakout opportunity? Share your views in the comments!

RELIANCE INDUSTRIES - Bullish Flag & Pole Breakout (Daily T/F)Trade Setup
📌 Stock: Reliance Industries ( NSE:RELIANCE )
📌 Trend: Strong Bullish Momentum
📌 Risk-Reward Ratio: 1:3 (Favorable)
🎯 Entry Zone: ₹1454 (Breakout Confirmation)
🛑 Stop Loss: ₹1373 (Daily Closing Basis) (~5.6% Risk)
🎯 Target Levels:
₹1499.70
₹1546.85
₹1595.45
₹1648.50
₹1697.00 (Final Target)
Technical Rationale
✅ Bullish Flag & Pole Breakout - Classic bullish pattern confirming uptrend continuation
✅ Strong Momentum - Daily & Weekly RSI >60 (Bullish zone)
✅ Golden Crossover - 50 DEMA crossed above 200 DEMA
✅ Volume Confirmation - Breakout volume 20.18M vs previous day's 5.57M (Nearly 4x surge)
✅ Multi-Timeframe Alignment - Daily and weekly charts showing strength
Key Observations
• The breakout comes with significantly higher volume, validating strength
• Well-defined pattern with clear price & volume breakout
• Conservative stop loss at recent swing low
Trade Management Strategy
• Consider partial profit booking at each target level
• Move stop loss to breakeven after Target 1 is achieved
• Trail stop loss to protect profits as price progresses
Disclaimer ⚠️
This analysis is strictly for educational purposes and should not be construed as financial advice. Trading in equities involves substantial risk of capital loss. Past performance is not indicative of future results. Always conduct your own research, consider your risk appetite, and consult a financial advisor before making any investment decisions. The author assumes no responsibility for any trading outcomes based on this information.
What do you think? Are you watching NSE:RELIANCE for this breakout opportunity? Share your views in the comments!

Tata Motors - Follow Up Flag PatternTata motors has created a good flag pattern, the height of the pole is 500 points,
Today - 25th July it has given a breakout from the pattern.
Tata motors will hit 1500++ levels due to Flag pattern breakout out.

Quickheal- A quick, strong upmove coming soon?I had earlier shared quickheal as a reversal trade which gave big move.
Now, stock has formed a flag post breakout of ATH and is ready to blast.
Please note that stock is overvalued and hence, trade might be risky.
A small correction in broader market can make this stock to fall quickly. Do book profits as targets get hit.

Tata consumer-A strong flag breakout in this FMCG stock!Tata consumer has given good breakout after a decent flag consolidation.
Stock can fly towards ATH and also make a new ATH soon. Keep in watchlist.
Amazing risk reward at CMP and relatively safe stock for long term.

JKPaper-Can it continue the rally?JKPaper has been trying to break 410 levels .
Stock has formed inverted head and shoulders pattern as a flag.
Above 425 DCB, breakout will be confirmed. Levels mentioned on chart
If you like my analysis, please like it and follow me for more such trading ideas.

Is the Volatility over in Nifty and is it ready for 24000 ??Nifty was moving in a parallel channel for almost 6 months, last week it tested the bottom channel as well it tested and broke out on the upper level channel on a daily chart.
In 30 mins chart Nifty has created a 1200 points Flag pattern and has also given a strong break out as well!! Accorinding to the flag pattern Nifty can hit 24K level soon !

KNRConstruction-A breakout for big returns!KNRConstruction is an undervalued infra theme stock which is looking strong on chart.
It has given a flag breakout and above its ATH, it has potential to fly.
Q4 results of stock are amazing and it can fuel the rally.
Keep in watchlist. Not a recommendation

Lupin-Don't miss this picture perfect flag breakout!Lupin has given good flag breakout today. A weekly closing above 1700 will confirm the same.
ATH should be minimum target once breakout is confirmed.
Stock has been in a big bull run since 2023 and looks ready for newer ATH.
Pharma stocks have risk of negative US FDA observations impacting the stock prices.

Jupiter wagons- Charged up for new bull run!Jupiter wagons has been one of the multibagger stock from railway theme.
Stock has given 5x returns in less than a year.
Stock has recently cooled off and now looking ready for another wild move.
Risky traders only should enter such stocks with less quantity since such stocks get locked in lower circuits as well.
Are you ready to catch this explosive stock?
Do follow me if you like my analysis!

AB Capital- Undervalued finstockABCapital which is the finance company of Aditya birla group is available at an amazing valuation.
Stock has given a flag breakout last week with volumes and on road to complete its rounding bottom pattern.
If the stock breaks out from pattern, we can see an amazing rally of around 50% in the stock.
If Nifty Bank crosses 48000 next week, this stock should move quickly till 200.

#Astral is getting the heat of the moment # SuperChartzKey Level:
Support: 1950
Resistance: 2099, 2199, 2250
Key Drivers:
Astral Poly Technik Ltd, founded in 1996, is a major player in India's plumbing and adhesive industries. It pioneered lead-free PVC pipes and expanded into adhesives through acquisitions. The company's diverse product range includes plumbing systems, adhesives, water tanks, faucets, and paints. With manufacturing facilities in multiple countries and a robust distribution network, it has a strong presence both domestically and internationally. Recent expansions into faucets, sanitary ware, and paints highlight its growth strategy. Astral Poly Technik Ltd maintains a focus on brand promotion and plans for continued expansion, supported by healthy financials and strategic acquisitions.

Canara Bank on verge of breaking down inverted flag patternCanara Bank on verge of breaking down inverted flag pattern. On breakdown, one may consider shorting.
This is not an investment advice.

Flag breakout in InfyIT stocks are looking quite bullish.
Infosys was consolidating in a flag pattern whose breakout was given last week.
A very good stock to buy for long term at an amazing price.
From trading perspective, 1300 is a SL with targets of 1700, and then ATH levels.
It is an FNO stock so big intraday moves shouldn't be expected.
Idea sahared for educational purposes

DVL / Dhunseri Ventures Ltd - 2.5 Years Consolidation Breakout.DVL
1) Time Frame - Monthly.
2) The Stock has been consolidating since August, 2021 and has given a breakout with strong bullish momentum & Huge volume.
3) The stock will find resistance / profit booking zone around the price (940) in long term.
4) Recommendation - Strong Buy

Atul flag breakout-DO NOT MISSAtul is one of the major stock of chemical sector which has been correcting since past many months.
We have seen a reversal in chemical stocks and similar reversal pattern is visible in Atul as well.
A clear flag breakout in weekly TF is visible. Confirmation is above 7600
Stock can even touch ATH if the rally continues for an year.
Keep this in watchlist.

APARINDS: Flag and BB Squeeze APARINDS is readying for a huge flag breakout from horizontal channel. Bollinger Band Squeeze is primed for a explosive breakout.

Uco Bank Analysis!Modification in UCO Bank Analysis
FLAG AND POLE PATTERN FORMATION IN UCO BANK
FLAG Breakout in UCO Bank
Uco Bank made Flag and Pole pattern in Weekly Timeframe But price is still trading inside rectangle(Flag). We have to wait till the price to go up and break the upper side of Flag. If it successfully breaks and closes above 28.55. Then there will be a nice Long trade in UCO Bank.
Entry = Above 28.55
Stop Loss= Below 22.30
Target = Short term 37.95 , Long Term 94
Disclaimer = All my analysis are for Educational Purpose only. Before entering into any trade - 1) Educate Yourself 2) Do your own research and analysis 3) Define your Risk to Reward ratio 4)Don't trade with full capital

SONATA SOFTWARE: Flag breakoutSONATASOFTW has broken out of a long flag on the upside and holding the level. Previously it broke out of a long cup pattern and never looked back. High Volume and High RSI.
