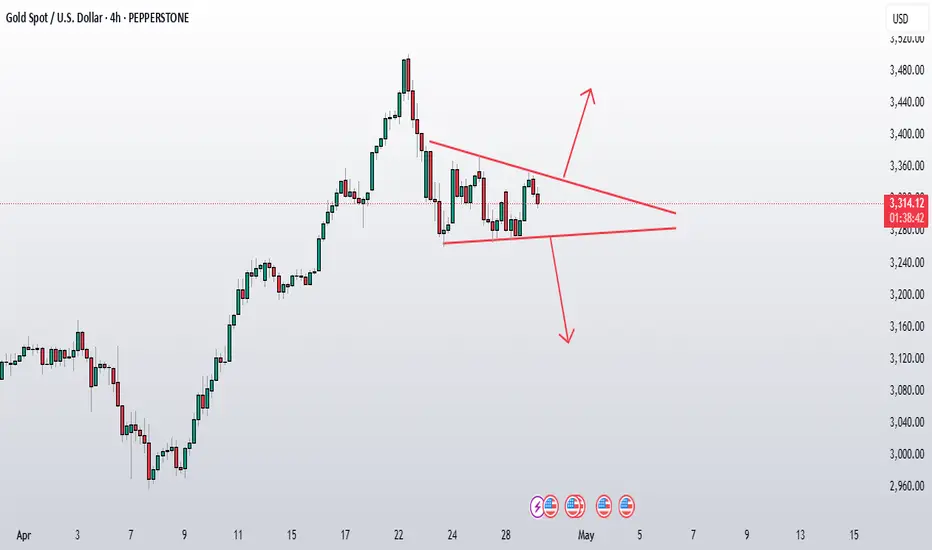
Gold ,Momentum on MuteGold continues to trade within a well-defined range, showing no clear breakout or breakdown. Price remains trapped between the narrow range . Despite brief upward attempts, bearish pressure near the red trendline has kept the market capped this suggesting indecision as neither bulls nor bears have seized control. Unless we see a decisive break above 3330-40 area (previous support now resistance) red descending trendline or below the support region, price is likely to remain sideways and choppy in the short term.
This remains a non-trading zone for directional traders. Better opportunities may emerge after a volatility expansion outside this range.
Forex-trading

Sideways Gold, Stronger Dollar: A Pause Before the BreakGold attempted a bullish breakout recently but failed to sustain momentum and is now back within a consolidation zone between 3,250–3,350. The repeated failure to break above descending trendline resistance suggests weakening buyer strength. It is currently forming lower highs, indicating distribution or sideways movement rather than a clear rally.
On the other hand, DXY has bounced from a key demand zone near 99.00, showing signs of short-term strength. It is now targeting the 102.60–104. resistance zone, which aligns with a Fibonacci retracement. If DXY continues higher, it could put pressure on gold prices in the near term.
Given this context, it is wise to remain on the sidelines for the next 2–3 weeks and wait for one of two scenarios:
1. DXY rejection from the 102.60–104 area – This would support a bullish case for gold.
2. Gold breakout above 3,400 with strong volume or need another bounce from lower support area as marked on chart which can provide confirmation of bullish continuation.
Until then, gold is likely to stay in a range or face minor downside due to DXY strength.
Silver also looking good from HereThis is the only time frame where I am watching silver as on now (On Monthly )
Chart is self explanatory, All we need a break above 35 , closing above this level can start a much awaited bull run on silver from here.
and if we see good momentum from silver , gold also goig to follow the same in short term to mid term basis.

Gold : Looking good so far ...No Change to chart
Support Levels that we have to watch:
Immediate Support : 3345-50(PDL and 50)
Secondary Support : 3330-35
Major Support : 3280-90
Immediate resistance : Current Week High(3390-92)
secondary Resistance : 3440-45
Major Resistance : ATH (3500)

Gold Holding Strong Looks Like It’s Building Power AgainPrice appears to be consolidating just above the breakout trendline, forming a new bullish base between 3350–3365 on the daily timeframe. This is a healthy sign ,it indicates that buyers are absorbing supply and not allowing price to fall back into the old range.
As long as this consolidation holds, the setup remains bullish, with upside potential still targeting 3445 and then ATH at 3500. If we get a decisive breakout above ATH, we might see a continuation rally. However, if a double top starts forming there, it will be time to book partial profits and wait for confirmation.
For Invalidation Level: I am Watching the 3380–3390 zone closely (Monday’s low). A strong move below this level could signal a failed breakout and invalidate the current bullish structure.
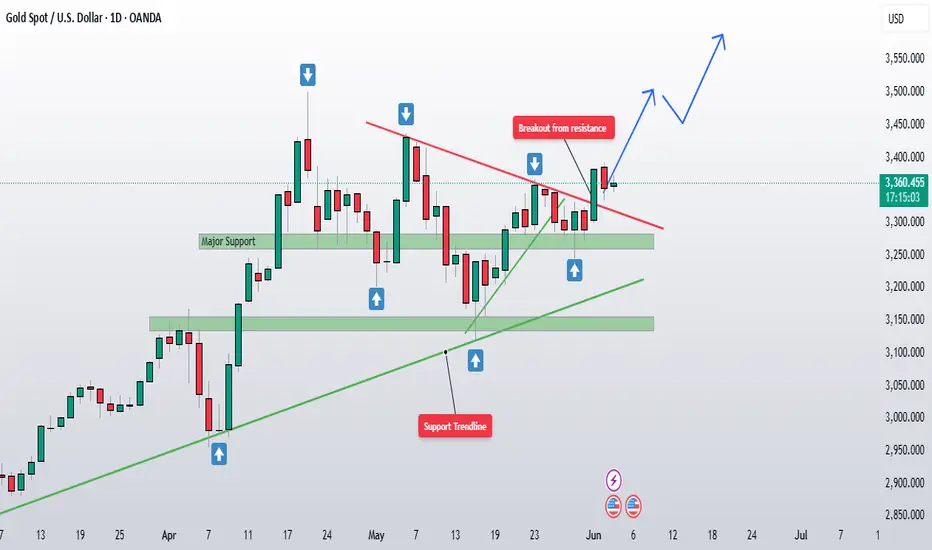
Gold price breakout from Key resistnace Gold price breakout from resistance key area (3360-65) with good volume , as per price action, price can now make another move higher and we can expect continuation of bullish wave towards ATH (3500) , at ATH we have to wait for price action , we can expect breakout or double top like structure there , on breakout we can add to current buy if price move in higher side with current moentum.

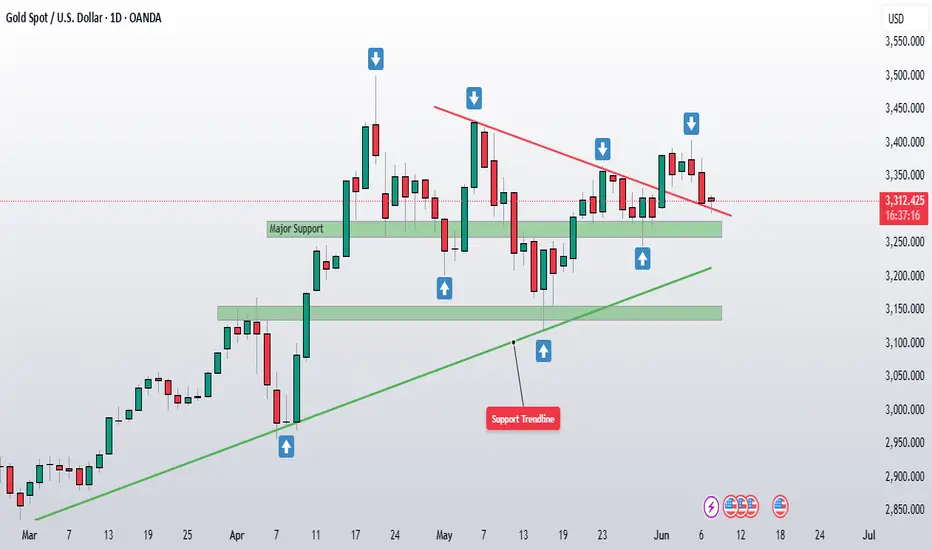
Gold stuck inside range : No clear direction as of now Yesterday, we have seen a strong bounce from the major support zone around 3260–3280 (marked as major support on chart), reclaiming the lost ground after the initial breakdown from the trendline (green line on chart). On daily time frame price seems to be stuck in a tight consolidation range and reflects a choppy environment where neither bulls nor bears have taken decisive control.
It's worth noting that we're right at the dynamic resistance zone ( the red trendline),which continues to cap any upside attempts. On the flip side, the major support area seems to be doing a decent job of holding the floor, at least for now.
With monthly and weekly closing candles coming up today, I’m still in "wait and watch" approach, just like yesterday. The price action around this consolidation zone isn’t giving any clear, high conviction directional clues.

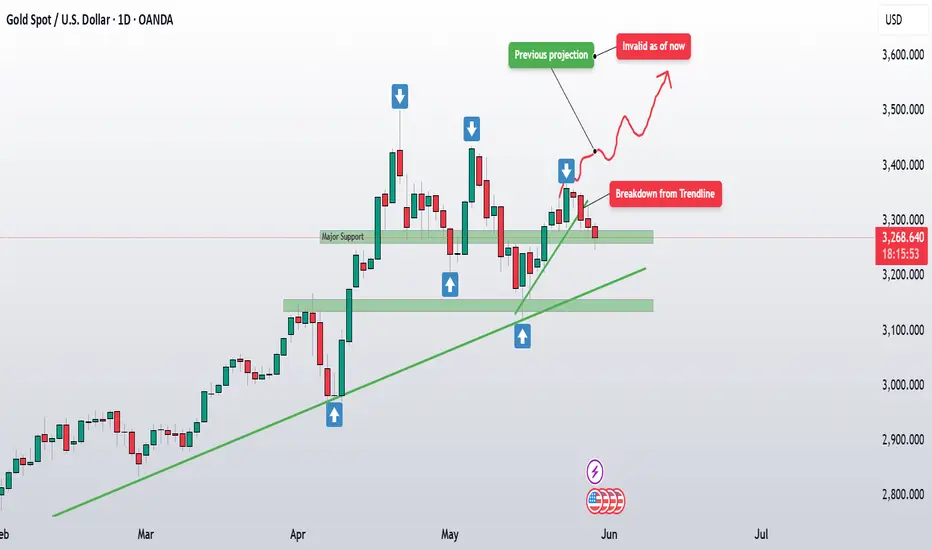
Gold Major Support in Focus: Will It Hold or Slide Further?Gold is testing a major support zone around 3260–3280 after breaking down from trendline support and following up with another red candle.
This breakdown suggests that the recent bullish momentum has faded, and now we have to wait to see if this support can hold. If it doesn’t, the next downside target looks to be around 3130–3155, with even 3000 as a longer-term possibility if the pressure continues. Right now, I’m staying out of any trades, preferring to wait and see if this support zone can provide a bounce or if we’re heading for deeper levels. The price action isn’t giving any clear reversal signs at current area as of now and wee have to assess this on week closing basis.
Gold Analysis Update: Bulls Holding Strong Above 3330Gold has been holding steady above the major pivot level at 3330, with price action continuing to create higher highs and showing strong respect for the ascending trendline support. This tells us that the bulls remain firmly in control. Currently, there’s no major rejection around these levels, and the volume is still supportive of the move higher, with no clear signs of exhaustion yet.
I’m also keeping an eye on the Fibonacci retracement levels visible on the chart: price is above the 0.786 mark at 3369 and could push towards the 1.0 level at 3436 if momentum remains strong.

Gold What’s Happening on Monthly Price Action:What’s Happening on Monthly Price Action:
Parabolic rally: Gold has gone nearly vertical since mid-2023 a textbook parabolic curve.
Zero rejection wicks: Current and previous candles show strong-bodied closes near the highs, suggesting very little distribution.
RSI is overbought: Hovering well above 70, but still rising, meaning the momentum is intact and buyers are still in full control.
This move still has no exhaustion signal on the monthly.
No long upper wicks
No bearish engulfing
No divergence on RSI yet
We are likely in Phase 2 of the bull run where price accelerates with institutional momentum, not retail euphoria.
We are due for a healthy correction, but calling a top here is premature. A market can stay irrational longer than you can stay solvent.
"Overbought and staying overbought” is a sign of strength, not weakness. Until price shows a rejection the bulls are driving this train. We ride the wave, not fight it

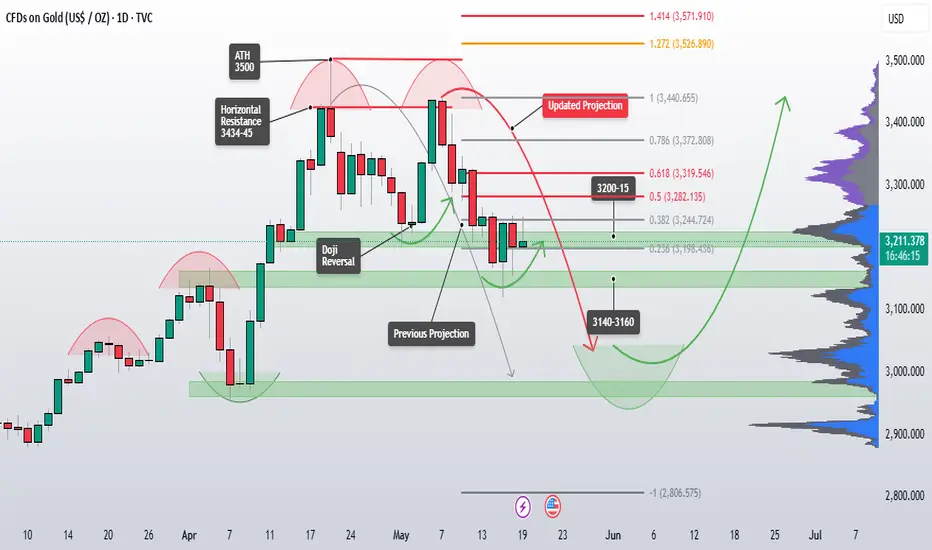
Gold Holding Strong New Highs Loading? After a solid rejection from the 3130–3160 major support zone, gold has shown real strength and bounced back above the 3280–3300 region, which was a key retracement level (0.5–0.618 Fib zone). Initially, I was expecting a deeper correction possibly towards the 3000 area, but price action has flipped the script. Bulls have stepped in strongly.
With the updated projection, we’re now looking at the following bullish path:
Updated Bullish Projection Path
Immediate resistance at 3436-40 (100% Fib extension)
Next targets:
ATH :3500
3520 – 1.272 Fib
3565 – 1.414 Fib
3628 – 1.618 Fib (Major extension target)
Major support to watch 3260-75 area
If price continues to respect the trendline and higher lows, this bullish momentum could stretch further....

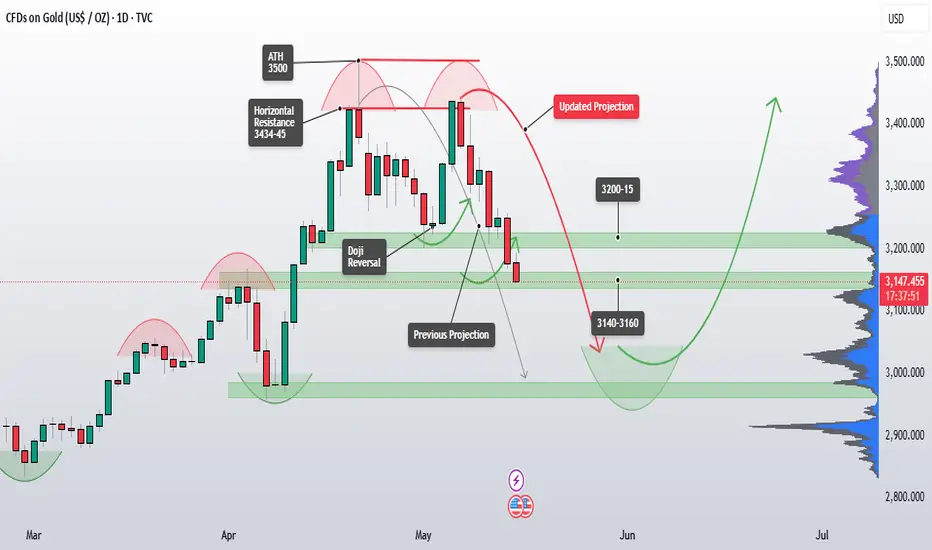
No trades for now… letting gold show its next moveYesterday, gold closed above 3282 level, which we’ve been tracking closely as the 0.50 Fibonacci level from the 3440–3120 decline. This was a key technical level and with that break, I’ve closed all my short positions initiated from the 3385 area(with a good profit overall), as shared earlier.
With that exit, I’m currently flat and not holding any active positions.
From an intraday perspective, price is now inching toward the next resistance at 3319, which corresponds to the 0.618 Fib retracement a typical zone where reactions or pullbacks possible.
The trend has shifted from a clean corrective phase into a potential BIG RANGE CONSOLIDATION structure(for range we have to wait for weekly close confirmations)
I’ll wait for more clarity in price action near 3319–3345, and reassess if fresh selling opportunities or continuation setups emerge.I prefer to stay on the sidelines and observe how price behaves around the next resistance cluster before jumping into the next move.

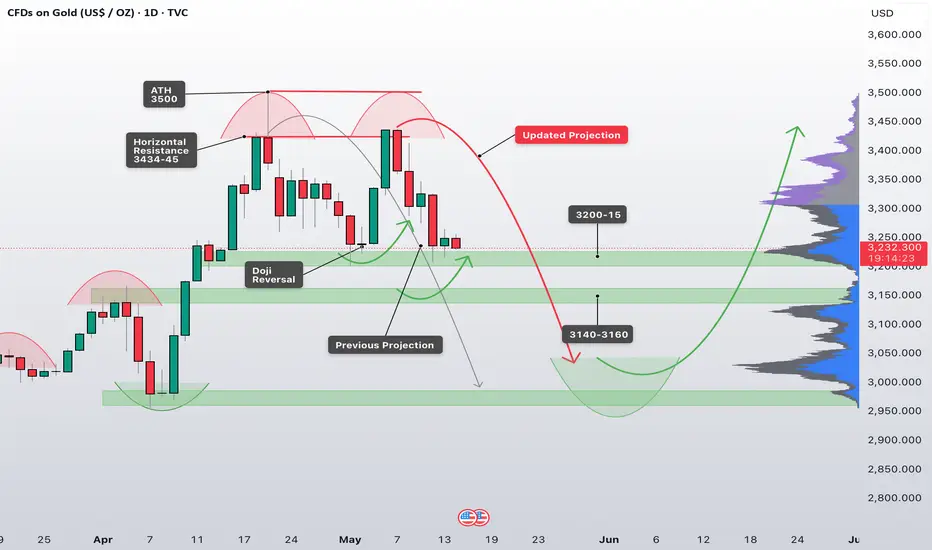
Gold Holding Above 3200… But Is the Rebound Real?Gold followed through on our previous expectation, bouncing from the 3140–3160 support zone after briefly tagging a low near 3120. From there, bulls regained some control and managed to reclaim the 3200 level, which we’ve been watching closely. Although last week’s close was above 3200, I still consider this move a corrective bounce, not a confirmed reversal.
The key level I’m watching now is 3282, which aligns with the 50% Fibonacci retracement of the recent decline from 3440 to 3120. Until price decisively closes above this zone, I’ll continue to treat this as a pullback within a broader correection/downtrend and hold onto a portion of my short positions.
If bulls manage to break and hold above 3282, we could start seeing signs of a short-term trend shift toward higher resistance zones like 3350 or beyond. However, as long as price stays below 3282, the risk remains for another move back below 3200 and if that happens, a revisit of the 3140–3120 support zone is very much on the table. and if that support break, our previous bearish targets come back into focus.
So for now, I’m still leaning toward downside continuation unless the market proves otherwise by reclaiming key resistance with strength.
Gold Reclaims 3200 What’s Next?Yesterday, gold dipped into the 3140–3160 support zone, even tagging a low near 3120 and from there, buyers stepped in with a decent bounce. That was expected.
Now, price has reclaimed the 3200 level and this is the key zone to watch today. ⚠️
Above 3200? Bulls might get some room to test the next resistance around 3265–3275. This is a short-term target if the upside continues.
Back below 3200? Bears may take control again, with potential continuation toward yesterday’s lows. If that breaks, our previous downside projection remains in play.
Also, from the Fibonacci retracement of this recent down leg (from 3440 to 3120) the 3282 level is a major Fib level (0.5) to watch, Unless we close above that, I’ll continue holding part of my short positions, aiming for lower levels as marked on the chart.

Gold : Time to fade the Bullish sentiments As expected, gold followed my projection very precisely....
After losing the 3200 support zone yesterday, price continued its descent and is now hovering around the 3140–3160 support area. This zone is significant and could act as a temporary buffer.
At this stage, I’m expecting some sideways movement a consolidation phase. Why? Because this level could attract some short-term buying or profit booking from sellers.
If gold fails to hold this level and we see increasing selling pressure, a clean breakdown could drive us straight toward the 3000 psychological level my next target. That would be a key area to watch for a larger bounce or even a macro reversal setup.
GOLD (XAUUSD) – 4H Bearish Setup🔍 Chart Structure
Pair: Gold (XAUUSD)
Timeframe: 4H
Bias: Bearish
Current Price: ~$3,192
🔻 Technical Analysis
1. Bearish Flag / Channel Formation
Price has been trending down within a descending parallel channel.
A breakdown from the channel has occurred, confirming bearish continuation.
2. Break and Retest Pattern
Price has broken below the channel, retested the broken structure, and rejected.
A bearish rejection candle confirms that sellers are active at the supply zone.
3. Supply and Demand Zones
Supply Zone (Orange Box): Around $3,240–$3,275
(Price rejected here after retesting the channel break.)
Demand Zone (Target): Around $2,980
(Previous structure support; high liquidity area.)
4. Market Structure
Series of lower highs and lower lows confirms a strong bearish market structure.
Strong momentum candle broke structure at $3,200, validating bearish sentiment.
📉 Trade Plan – Sell Setup
Entry Zone Stop Loss Take Profit Target Risk:Reward
$3,190–$3,200 (retest area) $3,275 (above supply) $2,980 (demand zone) 1:3+
✅ Bearish Confluences
Confluence Details
✅ Bearish Channel Breakdown Confirmed by breakout and retest
✅ Supply Zone Rejection Bearish candle from $3,240–$3,275 zone
✅ Liquidity Below Clean move down to $2,980 expected
✅ Momentum Shift Strong bearish candles breaking minor supports
❌ Invalidation Zone
If price closes above $3,275, this bearish setup becomes invalid.
It would indicate strength from buyers and break the supply zone.
📊 Risk Management Tips
Wait for a bearish engulfing or strong rejection candle at the retest.
Use partial TPs around $3,100 and trail SL to secure profits.
Maintain strict SL above $3,275 supply zone.

Gold is at support but still looking weak As per previous updates, gold tested the first support area at 3200-25 and taking support on this area but overall picture is still looking in more correction side;
Price is currently forming range area on Intraday, to move up bulls need to create another follow up green closing on daily time frame and for sell bears need to closed the day under 3200.
GBPUSD SELLTechnically speaking, GBPUSD is in a downtrend on the 4H timeframe, with price slowly approaching a key sell area. I’ll be closely watching price action as it enters that zone to see if short positions make sense.
There are already a few potential downside targets in place, which makes the setup even more promising.
Let’s see how price reacts in that area.

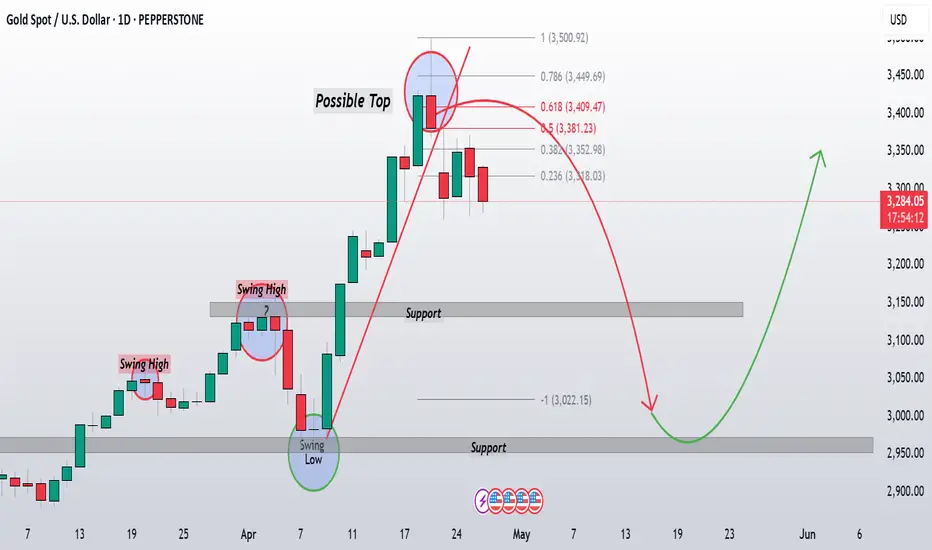
Gold Bounced But Resistance Awaits....Gold has surprised many after last Friday’s session. I was initially expecting the correction to continue, but the reversal Doji that formed near support triggered a strong bounce, invalidating my short-term bearish outlook. Since then, price has shown decent strength on the daily timeframe, pushing higher toward a major resistance zone around 3434–3440.
Now, this horizontal resistance is a key area to watch. It has previously acted as a supply zone, and price action around it will be crucial. Although the structure still looks strong, we’re entering a potential exhaustion zone, and I’m keeping an eye on the possibility of a double top forming near the all-time high at 3500.
Today is a major fundamental day with the Fed’s rate decision and Powell’s speech lined up. I’m expecting volatility, and most likely, a clearer signal for the next big move in gold. My bias remains the same ,I’m waiting for bearish confirmation near this resistance area before entering fresh shorts. If we see rejection, I’ll target the 3200–3215 zone first, and if that breaks, the 3140–3160 zone comes into play next.
In short, I’m staying patient and letting the chart do the talking. Price is approaching a critical area, and the next move could offer a high-probability setup. Waiting for confirmation is key.

Sellers Take Over as Gold Breaks ConsolidationGold is moving exactly as I mapped out in my previous updates,and Breaks Down from Consolidation following the path accurately that we discussed in last updates....
Yesterday’s monthly close gold closed below 3300 level, which gave sellers more confidence. As a result, we’ve seen a solid drop today, with the price now at 3132 on the daily chart, down 1.73% .
The Price Action confirms the bearish momentum I’ve been talking about. We’re now approaching some key levels for intraday . The 3220-3225 HVN area and the 3200-3210 psychological support zone are spots where we might see a short-term bounce. However, the larger trend remains in correction mode, just as I projected earlier.
For stronger support, I’m keeping an eye on the 3135-3150 zone, and if the decline continues, the 2980-3000 area could be a great spot for a potential swing buy, as marked on the chart.As of now I am still expecting the correction to play out toward 3000 in the bigger picture!

Gold Still Dropping What I’m Watching This Week....Following my last update, gold price action continues to align with the bearish short-term outlook I projected. The weekly close on April 27, 2025, as seen in the chart, confirmed the bearish sentiment with a red candlestick, well below the recent highs and the golden Fibonacci zone (3380-3408). This reinforces that sellers remain in control.
Today, gold is still trading , below the golden Fib zone, which continues to act as a resistance. The price has not yet tested the first support level at 3150-3165, but the downward trajectory suggests it may approach this zone soon. If this support holds, we might see a temporary bounce; however, a break below 3150-3165 could accelerate the decline toward my target of 3000, as indicated by the chart projected path.
The weekly close below the recent swing highs and the failure to reclaim the golden Fib zone strengthen the bearish case. For the short term, I expect gold to continue its downward movement unless a significant reversal pattern emerges.
Gold Monthly Close Today : Range Bound and Ready for a Move...Since my last update, not much has changed, Gold is still stuck in that range-bound movement we’ve been watching. ,Price continuing to trade in triangle pattern I mentioned before. It’s definitely tightening up, which means we’re getting closer to a breakout.
Right now, 3300 is holding strong as a good support level, while 3350 is acting as a major resistance, keeping the price in wide range. My view hasn’t shifted , I’m still leaning bearish for the short term, as the price remains below the golden Fibonacci zone (3380-3408), and the weekly close earlier this week already confirmed the sellers are in control.
Today’s monthly close is important, and it could set the tone for what’s next. If gold closes below 3260-75, it’ll strengthen my case for a drop toward 3000. But if we see a surprise breakout above the triangle and 3350, we might need to rethink the short-term direction. For now, I’m sitting tight, waiting for the breakout from this range to get a clearer picture. Let’s see which way gold decides to go on month closing...

Still Bearish on Gold – Watching Triangle Breakout Gold price continues to exhibit a bearish short-term outlook, with price action remaining range-bound. As observed on the 4-hour chart shared today, gold is currently forming a triangle pattern, indicating a consolidation phase. The price is trading at 3146.13, still well below the golden Fibonacci zone (3380-3408), reinforcing that sellers maintain control.
The triangle pattern suggests an impending breakout, and the direction of the breakout will likely dictate the next significant move. Given the bearish context from ,my previous analysis supported by the weekly close below recent swing highs and the failure to reclaim the Fib zonemy bias remains toward a downward breakout.
If the price breaks below the triangle's lower trendline, it could test the key support at 3150-3165. A break below this level would likely accelerate the decline toward my target of 3000, as previously projected.
However, if gold breaks above the triangle's upper trendline, it could signal a potential short-term reversal, possibly retesting resistance around 3380. For now, I lean toward the bearish scenario, expecting lower levels to be tested soon unless a strong bullish sign appear outside of this range formation .