XAUUSD liquidity grab done, awaiting next move.Market Context (Intraday)
Gold has just completed a sharp sell-off, breaking below the previous structure and sweeping sell-side liquidity. The strong bearish displacement suggests a stop-hunt and rebalancing phase, not a clean trend continuation yet. Current price action shows consolidation after liquidity absorption.
Technical Structure
Market is trading below the descending trendline, keeping short-term pressure bearish.
A clear liquidity sweep occurred below 4,321, followed by a weak rebound.
Price is now reacting inside a key rebalancing zone, where both buyers and sellers may reposition.
Key Levels to Watch
Sell Reaction Zone: 4,455 – 4,460
→ Strong supply + trendline resistance. Expect rejection if price rallies here.
Mid Resistance / Decision Zone: 4,390 – 4,395
→ Intraday flip zone. Failure here keeps bearish bias intact.
Buy Zone (Liquidity): 4,245 – 4,255
→ Major demand + sell-side liquidity. Area to watch for potential bullish reaction.
Scenarios
Bearish Scenario:
If price fails below 4,390, expect continuation toward 4,320 → 4,250 to complete liquidity collection.
Bullish Recovery Scenario:
A strong reaction from 4,245–4,255 followed by acceptance above 4,395 could open a recovery move toward 4,455+.
Macro Notes
With year-end positioning and lower liquidity conditions, price is likely to be driven by liquidity hunts rather than clean trends. Avoid chasing moves; focus on reactions at key zones.
Bias
Neutral to bearish intraday, until price shows a clear acceptance above resistance.
Forex

XAUUSD (H1) – Early-week Selling biasSharp drop from ATH, look to sell the pullback into resistance & liquidity
Strategy summary
Gold opened the week with a fast sell-off (roughly a $20 drop intraday), signalling strong profit-taking after the All-Time High sweep. With the current structure, my focus is SELL on pullbacks, using the trendline / resistance zones and nearby liquidity clusters as execution areas.
1) Technical read (H1 – based on your chart)
All-Time High remains a major psychological ceiling. After an ATH sweep, a corrective leg is common.
Price is trading below the Buyside Liquidity band, which often gets retested before the next directional move.
Key levels on your chart:
Sell zone: 4494 – 4497 (main pullback sell area)
Strong Liquidity: around 4474 (reaction / decision point)
Lower liquidity supports: 4441 – 4444 and 4403 – 4406 (areas to watch for reactions)
2) Trade plan (Liam style: trade the level)
Scenario A (priority): SELL the pullback
✅ Sell zone: 4494 – 4497
SL (guide): above the zone (refine on lower TF / spread)
TP1: 4474
TP2: 4441 – 4444
TP3: 4403 – 4406
Logic: This is a clean resistance / pullback area. Selling the reaction is safer than chasing shorts at the lows.
Scenario B: BUY reaction at lower liquidity (scalp only)
If the sell leg extends into support, you can consider a short-term bounce trade:
Buy: 4441 – 4444 (quick reaction zone)
Deeper buy: 4403 – 4406 (better value zone)
Only take buys with clear holding signals on lower timeframes — no catching falling knives.
3) Macro context (news) – why gold is swinging
The sharp move lower suggests markets are re-pricing risk after an extended rally.
US–Israel tensions are elevated, with Trump and Netanyahu reportedly clashing over Gaza, Iran and post-war order — geopolitical risk can trigger fast liquidity-driven swings.
In headline-driven sessions, gold often runs a two-step pattern: liquidity sweep → correction → direction. That’s why I’m sticking to level-based execution and avoiding FOMO.
4) Risk notes
Don’t chase shorts during heavy red candles.
Focus on 4494–4497 for shorts and scale out at the TP levels.
Max risk per trade: 1–2%.
What’s your bias for this week: selling the 4494–4497 pullback, or waiting for 444x/440x to buy a reaction bounce?

XAUUSD (H1) – Monday Trading StrategyLana prioritizes selling setups until a new high is broken.
Quick summary
Technical context: Price has pulled back strongly from the All-Time High, showing short-term weakness.
Daily bias: Sell on rallies, until price breaks and holds above a new high.
Key events: Speech from U.S. President Trump and updates related to U.S.–China trade may increase volatility.
News impact – what to watch
Trump’s speech: Often drives short-term USD sentiment through comments on growth, tariffs, and inflation. Gold may react sharply to headline risk.
U.S.–China trade activity (CCPIT): Any improvement in trade sentiment can support USD in the short term, adding pressure to gold. Rising tensions would favor gold as a safe haven.
Because of this, Lana will focus on price reaction at key zones rather than predicting the news outcome.
Technical analysis (H1)
Gold printed a new All-Time High and then sold off aggressively, signaling profit-taking near the top.
Price is now consolidating within a corrective structure, where selling rallies remains the higher-probability play.
Key zones identified on the chart:
Sell zone: 4529 – 4531
Buy reaction zone: 4498 – 4500 (support)
Trading plan for Monday
Primary scenario – Sell rallies
Sell: 4529 – 4531
This zone is expected to act as resistance during the current correction.
Bias change condition:
Only shift to a bullish continuation if price breaks above the previous high and holds.
Secondary scenario – Short-term buy reaction
Buy: 4498 – 4500
This is considered a scalp-only setup, as the overall intraday bias remains bearish.
Session notes
Asian session may remain slow, while volatility is likely to increase around the scheduled events.
Best trades are expected when price returns to planned zones rather than trading in the middle of the range.
This analysis reflects Lana’s personal market view and is not financial advice.

XAUUSD – Bullish structure intact, Buy pullbackGold remains within a mid-term ascending channel. After a strong bullish impulse, the price is currently in a technical rebalancing phase, not a trend reversal. The recent pullback is viewed as liquidity absorption, preparing for the next expansion.
Structure & Order Flow (MMF / SMC)
Overall market structure stays Higher High – Higher Low.
Price has reacted clearly from the lower Demand / Order Block, confirming buyer presence.
Buy-side liquidity remains above, acting as the next upside magnet.
Key Technical Levels
Primary BUY Zone: 4,485 – 4,490
Secondary BUY Zone: 4,480 – 4,483 (OB + trendline confluence)
Resistance / Target 1: 4,520
Target 2 (Liquidity Zone): 4,560 – 4,590
Trading Scenarios
Primary Scenario:
Wait for the price to pull back into BUY zones, look for reaction / minor BOS, then follow the bullish trend.
Alternative Scenario:
If the price holds above 4,500 and breaks strongly above 4,520, wait for a retest to continue BUY positions.
Invalidation:
A clear H1 close below 4,480 invalidates the bullish setup and requires reassessment.
Summary
The dominant bias remains bullish continuation. Best strategy is to buy on pullbacks, stay patient, and avoid chasing price at premium levels.

XAUUSD H4 – Trading the Uptrend Channel with LiquidityXAUUSD H4 – Trading the Uptrend Channel with Liquidity and Volume Profile
Gold remains bullish on the H4 timeframe and continues to respect a well-defined rising channel. With price approaching extended areas, the higher-probability approach is to buy pullbacks at value zones and treat the upper boundary as a short-term profit-taking area rather than chasing momentum.
TECHNICAL CONTEXT
The uptrend structure is still intact, with price forming higher lows inside the channel.
After a strong impulsive leg, the market is now consolidating and rebalancing, which favours execution around Volume Profile and FVG zones.
The upper channel boundary often acts as a short-term exhaustion area, while value zones below offer better risk-to-reward long entries.
PRIORITY SCENARIO – MAIN PLAN
Buy the pullback at key value and liquidity zones
Buy POC: around 4485
Buy zone FVG support: around 4368
Rationale:
The 4485 POC is a high-volume area where price frequently reacts during pullbacks.
The 4368 FVG aligns with channel support and represents an imbalance area that price often revisits before continuation.
Expected behaviour:
A pullback into POC or the FVG zone, followed by a bullish reaction, can set up the next leg higher within the channel.
ALTERNATIVE SCENARIO – SECONDARY PLAN
Short-term sell scalp near the upper boundary
Sell scalping zone: around 4600
Note:
This is strictly a short-term scalp if price reaches the upper channel boundary and shows clear rejection. It is not a trend reversal thesis.
KEY TAKEAWAYS
The H4 trend remains bullish, but the channel range is wide, making chasing price riskier.
Volume Profile and FVG zones define higher-probability execution areas.
The best edge comes from buying pullbacks at value, while treating 4600 as a potential short-term reaction zone.

XAUUSD (H4) – Weekly StrategyBull trend still in control | Buy the pullback at 4430, sell reaction at 4573, target 4685
Weekly strategy snapshot
On H4, gold is still holding a strong bullish structure inside the rising channel. Price has already expanded higher, so next week I’m not chasing — I’m prioritizing a trend buy on pullback into liquidity. Above, the 1.618 Fibonacci zone is a clean area for a reaction sell / profit-taking.
1) Technical view (based on your chart)
H4 structure remains bullish: higher highs + higher lows.
Price is extended after the breakout, so mid-range entries are risky.
The chart clearly marks Sellside Liquidity – Buy 4430 as the key “reload” area.
Upside zones: Sell 4573 (Fibo 1.618) and the extension target 4685.
2) Key Levels for next week
✅ Buy zone (Sellside Liquidity): 4430
✅ Sell reaction (Fibo 1.618): 4573
✅ Extension target: 4685
3) Weekly trading scenarios (Liam style: trade the level)
Scenario A (priority): BUY the pullback with the trend
✅ Buy: around 4430 (wait for a liquidity sweep + reaction)
SL (guide): below the 4430 zone (refine on lower TF / spread)
TP1: 4530 – 4540
TP2: 4573
TP3: 4685 (if momentum continues)
Logic: After a breakout, price often returns to “collect liquidity” before the next leg higher. 4430 is the cleanest dip-buy location on this structure.
Scenario B: SELL reaction at premium Fibonacci (short-term)
✅ Sell: around 4573
SL (guide): above the zone
TP: back toward value / potentially toward 4430 if a clear correction develops
Logic: 4573 is a premium area where profit-taking often shows up. This is a reaction sell — not a long-term bearish bias.
4) Macro context (from your news) & gold impact
Trump’s comments on tariffs, a sharper reduction in the trade deficit, and strong GDP messaging can keep markets sensitive to USD / yields expectations. That can create sharp intraday swings.
At the same time, policy and geopolitical uncertainty still supports safe-haven demand — which is why the best approach remains: follow the trend, enter at liquidity.
5) Risk notes
Don’t chase at highs.
Only act at the levels: 4430 or 4573.
Max risk per trade: 1–2%.
What’s your bias for next week: buying the 4430 pullback, or waiting for 4573 to sell the reaction?

XAUUSD (H4) – Trading Rising ChannelLana focuses on pullback buys for the week ahead 💛
Weekly overview
Primary trend (H4): Strong bullish structure, price is respecting a clean ascending channel
Current state: Price is trading near ATH and Fibonacci extensions → short-term reactions are possible
Weekly strategy: No FOMO. Lana prefers buying pullbacks at value zones, not chasing highs
Market context
Recent comments from the U.S. highlight strong economic growth and confidence in trade policies. While such statements can influence USD sentiment, gold at year-end is often driven more by liquidity conditions and technical structure than headlines.
With holiday liquidity thinning out, price movements can become sharper and less predictable. That’s why this week Lana stays disciplined and trades strictly based on structure and key levels.
Technical view based on the chart (H4)
On the H4 timeframe, gold is moving smoothly within a rising channel, consistently forming higher lows. The strong impulse leg has already completed its psychological breakout phase, and price is now hovering near the upper area of the channel.
Key points:
Fibonacci extension zones near the top act as psychological resistance, where temporary pullbacks are normal.
The best opportunities remain inside the channel, around value and liquidity zones.
Key levels Lana is watching this week Primary buy zone – Value Area (VL)
Buy: 4482 – 4485
This is a value zone within the rising channel. If price pulls back here and holds structure, continuation to the upside becomes more likely.
Safer buy zone – POC (Volume Profile)
Buy: 4419 – 4422
This POC zone shows heavy prior accumulation. If volatility increases or price corrects deeper, this area offers a more conservative buy opportunity.
Psychological resistance to respect
4603 – 4607: Fibonacci extension & psychological barrier At this zone, a short-term rejection or liquidity grab is possible before the next directional move.
Weekly trading plan (Lana’s approach)
Buy only on pullbacks into planned zones, with confirmation on lower timeframes.
Avoid chasing price near ATH or psychological resistance.
Reduce position size and manage risk carefully during low-liquidity holiday sessions.
Lana’s note 🌿
The trend is strong, but discipline at the entry is everything. If price doesn’t return to my zones, I’m happy to stay patient and wait.
This is Lana’s personal market view, not financial advice. Always manage your own risk. 💛

Gold in Final Bullish Wave – Last Push Higher ExpectedGold (XAU/USD 4H) is in a strong bullish trend and is currently moving in the last part of Wave (5). The clear breakout above the previous resistance shows that buyers are in control, and the bullish structure is still valid. As long as the price stays above the main support area, the outlook remains positive, with the next target around 4,580–4,650 , where this upward move is likely to finish. For short-term trades, a sensible stop-loss can be placed below 4,420 , while the bullish view becomes invalid if the price falls below 4,360 . If everything goes as expected, Gold should make one final move higher and then take a normal corrective pullback (A-B-C) after the strong rally.
Stay tuned!
@Money_Dictators
Thank you :)

XAUUSD (H1) – Trading Buy LiquidityStay bullish with the rising channel, buy the pullback into liquidity
Quick view
Gold is still moving inside a rising channel. After the strong impulsive push, price is now consolidating / compressing. For today, I’m prioritizing BUY setups at liquidity + trendline retests, while keeping a reaction SELL plan at the premium Fibonacci zone above.
Macro context (why volatility can stay elevated)
Trump signing a record number of executive orders and the growing shift of power towards the executive branch increases policy uncertainty (tariffs, federal cuts, geopolitical moves). In uncertain environments, flows often rotate into safe-haven assets like gold. That said, this kind of headline risk can also move the USD sharply, so the best approach is still: trade the levels, not emotions.
Key Levels (from your chart)
✅ Buy zone Liquidity: 4410 – 4413
✅ Buy trendline retest: 4480 – 4483
✅ Sell zone (Fibo 1.618): 4603 – 4606
Today’s trading scenarios (Liam style: trade the level)
1) BUY scenario (priority)
A. Trendline retest = best structural entry
Buy: 4480 – 4483
SL: below the zone (guide: 4472–4475, adjust on lower TF / spread)
TP1: 4515 – 4520
TP2: 4580 – 4600
B. Deeper liquidity buy (if we get a sweep)
Buy: 4410 – 4413
SL: below the zone (guide: 4402–4405)
TP: 4480 → 4520
Logic: These are the cleanest liquidity areas on the chart. No chasing mid-range — I only act when price returns to the zone and reacts.
2) SELL scenario (reaction only — no chasing)
Sell: 4603 – 4606
SL: 4612
TP1: 4550
TP2: 4483
Logic: The 1.618 premium zone often attracts profit-taking. I only sell if price taps the zone and shows clear weakness on the lower timeframe.
Notes
If price keeps holding the trendline and printing higher lows → BUY bias remains stronger.
If we break the trendline and fail to reclaim it → reduce size and wait for a fresh structure.
Which side are you leaning today: buying the pullback, or waiting for 4603–4606 to sell the reaction?

XAUUSD (H1) – Trading BUY Liquidity Stay bullish with the rising channel, buy the pullback into liquidity
Quick view
Gold is still moving inside a rising channel. After the strong impulsive push, price is now consolidating / compressing. For today, I’m prioritising BUY setups at liquidity + trendline retests, while keeping a reaction SELL plan at the premium Fibonacci zone above.
Macro context (why volatility can stay elevated)
Trump signing a record number of executive orders and the growing shift of power towards the executive branch increases policy uncertainty (tariffs, federal cuts, geopolitical moves). In uncertain environments, flows often rotate into safe-haven assets like gold.
That said, this kind of headline risk can also move the USD sharply, so the best approach is still: trade the levels, not emotions.
Key Levels (from your chart)
✅ Buy zone Liquidity: 4410 – 4413
✅ Buy trendline retest: 4480 – 4483
✅ Sell zone (Fibo 1.618): 4603 – 4606
Today’s trading scenarios (Liam style: trade the level)
1) BUY scenario (priority)
A. Trendline retest = best structural entry
Buy: 4480 – 4483
SL: below the zone (guide: 4472–4475, adjust on lower TF / spread)
TP1: 4515 – 4520
TP2: 4580 – 4600
B. Deeper liquidity buy (if we get a sweep)
Buy: 4410 – 4413
SL: below the zone (guide: 4402–4405)
TP: 4480 → 4520
Logic: These are the cleanest liquidity areas on the chart. No chasing mid-range — I only act when price returns to the zone and reacts.
2) SELL scenario (reaction only — no chasing)
Sell: 4603 – 4606
SL: 4612
TP1: 4550
TP2: 4483
Logic: The 1.618 premium zone often attracts profit-taking. I only sell if price taps the zone and shows clear weakness on the lower timeframe.
Notes
If price keeps holding the trendline and printing higher lows → BUY bias remains stronger.
If we break the trendline and fail to reclaim it → reduce size and wait for a fresh structure.
Which side are you leaning today: buying the pullback, or waiting for 4603–4606 to sell the reaction?

XAUUSD – Bullish Channel AnalysisLana stays bullish, waiting for pullbacks to buy 💛
Quick summary
Trend: Clearly bullish, price is moving inside a well-defined rising channel
Timeframe: H1
Current state: Price is near the upper part of the channel, so a psychological reaction near Fibonacci extension is possible
Strategy: No chasing. Lana prefers buying pullbacks into value/liquidity zones
Market context
Gold remains strong into year-end, even as liquidity becomes thinner. The current push higher looks very momentum-driven, and Fibonacci extension areas often act as short-term “reaction zones” before the next directional decision.
On the longer-term side, bold forecasts like Jim Rickards’ view (gold potentially reaching very high levels in 2026) show that bullish sentiment in precious metals is still alive. Still, for Lana, short-term trading must follow structure and zones, not headlines.
Technical view: price inside a rising channel
On the chart, gold is respecting a clean ascending channel, consistently printing higher lows.
Key observations:
The upper Fibonacci extension area around 4603–4607 is a psychological barrier, where a short-term pullback can happen.
The best entries are usually found when price returns to value areas inside the channel, not at the top.
Key levels Lana is watching
Primary buy zone – Value Area (VL)
Buy: 4482 – 4485
This is a value area inside the rising channel. If price pulls back here and structure holds, continuation to the upside becomes more likely.
Deeper buy zone – Liquidity POC
Buy: 4419 – 4422 (POC)
This level shows heavy prior accumulation on the Volume Profile. If year-end liquidity causes a deeper shakeout, this zone becomes a safer area to look for buys.
Trading notes
4603–4607 is a psychological resistance zone — not a place to chase longs.
Only buy when price reaches the planned zone and shows confirmation on the lower timeframe.
With thin liquidity: reduce position size and keep risk tight.
Lana’s note 🌿
The trend is strong, but patience at the right entry matters more than catching every move. Lana follows structure, not emotions.

DXY Breakdown After Major Top – Wave v in ProgressThe DXY chart shows that the U.S. Dollar has completed a larger corrective structure and is now moving inside a new impulsive bearish phase. After forming a major top near the 110 area, the index started a clear five-wave decline, indicating strong downside momentum. The recent sideways movement looks like a corrective pause (wave iv / Y) rather than a trend reversal. As long as the price stays below the key resistance zone around 100–101, the overall structure remains bearish. This suggests the dollar is preparing for the final wave lower (wave v / 3), which could push the index toward deeper support levels. Overall, the Elliott Wave structure favours continued weakness in the U.S. Dollar in the coming months.
Stay tuned!
@Money_Dictators
Thank you :)

XAUUSD (Gold) Technical Outlook - 24/12/2025XAUUSD – Gold Technical Snapshot (Intraday)
Gold remains bullish across higher timeframes (Daily–Monthly). Price is trading near 4,492, close to the day’s high, with all major moving averages aligned upward. Momentum indicators support the uptrend, though overbought conditions suggest possible short-term pullbacks.
Key_Levels
Support: 4,480 / 4,465
Pivot: 4,495
Resistance: 4,520 → 4,550 → 4,575
Outlook & Strategy
Bias stays bullish above 4,480
Buy pullbacks near support or breakouts above 4,520
Below 4,465, expect a corrective move toward 4,440–4,410
Disclaimer: This analysis is for educational purposes only and not financial advice. Trading involves risk—always manage your risk and do your own research.

USDCAD Trade Description – Liquidity Sweep + Discount Rejection USDCAD created a clean sell-side liquidity sweep below the previous low near 1.3700, taking out resting liquidity and tapping into a higher-timeframe discount zone.
After the sweep, price showed a sharp rejection wick, signaling absorption of sell orders and a potential reversal. The market then broke structure to the upside on lower timeframes, confirming a shift in momentum.
Price retraced back into the refinement zone / mitigation block, aligning perfectly with:
✔ Discount pricing
✔ Liquidity grab below the equal lows
✔ Rejection from a demand zone
✔ Bullish displacement following the sweep
This offered a high-probability long setup with entry near the mitigation block, stop below the sweep low, and targets toward the premium zone around 1.3780–1.3800.
The trade idea is based on price reverting back to its equilibrium after removing inefficient lows and collecting sell-side liquidity.

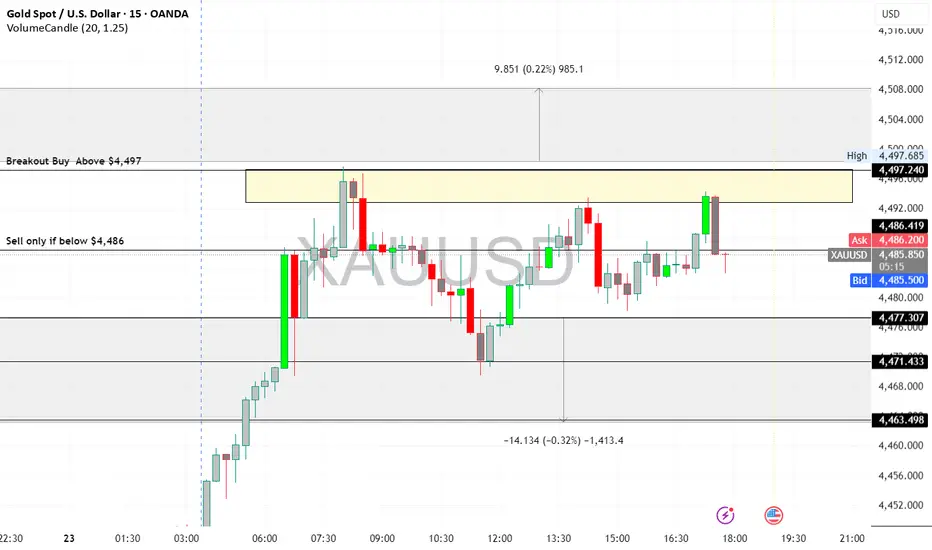
XAUUSD (Gold) Intraday Outlook - 23/12/2025XAU/USD Trend: Strong Bullish
Current Price: $4,491.99
Key Levels:
Support: $4,486 / $4,479
Resistance: $4,497 / $4,501 / $4,508
Pivot: $4,490
Strategy:
Buy on dips: $4,486–$4,479 → Target $4,497–$4,501
Breakout buy: Above $4,497 → Target $4,501–$4,508
Sell only if below $4,486
Gold remains bullish; prefer buying on dips or breakouts, keep stops tight near support.
Disclaimer: Trading involves risk. This analysis is for educational purposes only and is not financial advice. Trade responsibly.
USD/CAD – Liquidity & Structure Based Short IdeaUSD/CAD has been trading inside a well-defined rising channel for a while. Price is now approaching the upper boundary of this channel, a zone where sellers have previously stepped in with strength.
This area is not just resistance, it’s also a liquidity zone, where stop-losses of late buyers are resting above recent highs. Such zones often attract smart money activity before a directional move.
What Price Is Telling Us: Price is currently stalling near resistance instead of expanding higher. We can observe Multiple rejections near the channel top, Overlapping candles showing loss of bullish momentum and Lack of strong follow-through despite previous volume spike.
This behavior often appears before distribution or a corrective move, especially when price is trading at premium levels.
If this analysis helped you, like, follow, and comment for more clean Forex breakdowns.
Disclaimer: This analysis is for educational purposes only and does not constitute financial advice. Trading involves risk, and past performance does not guarantee future results. Please manage risk responsibly.

GBP/USD Signals Trend Shift – Impulsive Upside ExpectedThe chart shows that GBP/USD has completed a full W–X–Y corrective pattern, with the final wave (y) and its C wave forming a clean bottom near the long-term support line. From that low, price has started a strong upward move, which looks like the beginning of a new impulsive Wave 1. The current pullback toward the 0.382–0.618 Fibonacci zone is typical behavior for a Wave 2 retracement before the next strong rally. As long as the price stays above the invalidation level at 1.30094 (the wave (y) bottom), the bullish scenario remains valid. This suggests that GBP/USD is preparing for a larger Wave 3 push to the upside.
Stay tuned!
@Money_Dictators
Thank you :)

XAUUSD (H1) – Liquidity-Based Trading XAUUSD (H1) – Liquidity-Based Trading
Price has broken the channel, but buying momentum is weakening – waiting for a pullback to the trendline for entries
Today’s Strategy Summary
Gold has broken out of its price channel, but the key point is that buying pressure is fading after the strong acceleration. With the market approaching the holiday period and liquidity thinning, the focus is on trading at the right liquidity zones rather than chasing price or FOMO.
Plan:
Look for Buy opportunities on pullbacks into the trendline / old channel
Look for Sell reactions at the Fibonacci liquidity zone 4474–4478
1) Key Levels Today (from the chart)
✅ BUY zones (liquidity pullback)
Buy Zone 1: 4379 – 4382
SL: 4373
Buy Zone 2: 4361 – 4358
SL: 4353
These are clean liquidity areas to wait for price to retrace into – true liquidity-based trading: let price come back to reaction zones, do not chase highs.
✅ SELL zone (Fibonacci liquidity)
Sell zone: 4474 – 4478
SL: 4482
This is a premium + liquidity area. If price reaches this zone and fails to hold, the probability of profit-taking or a short-term reversal is high.
2) Main Scenario: Wait for a Pullback to the Channel/Trendline to Buy
After a breakout, the market often retests the old trendline or channel to confirm genuine buying strength.
As buying momentum is weakening, the likelihood of choppy moves and liquidity sweeps is high. Patience is key – wait for 4379–4382, or a deeper pullback into 4361–4358.
Expected targets (scalp / short swing):
Capture 8–15 USD moves depending on volatility, taking partial profits as price reacts according to plan.
3) Alternative Scenario: Sell Reaction at 4474–4478
If price continues to push higher into the Fibonacci zone, priority is to Sell on reaction rather than chasing Buy entries.
Only sell if there are signs of loss of momentum (long wicks, rejection, failure to close strongly above the zone).
4) News & Market Context: Thin Liquidity = Easy Sweeps
With the market nearing the holiday period, liquidity is weak, increasing the chances of spikes and stop-hunts.
Political and economic developments related to policy and tax matters are influencing corporate positioning, but at this stage, price is more likely to react to short-term capital flows rather than a sustainable trend.
Conclusion:
Today’s focus is “right zone – strict discipline”, avoiding mid-range entries and emotional trades.
5) Risk Management
Risk per trade: maximum 1–2%
Avoid trading when spreads widen or candles spike abnormally
Which scenario do you lean towards today?
A pullback to 4379 / 4361 for Buy, or a push to 4474–4478 for a Sell reaction?

XAUUSD H4 – Medium-Term Outlook for the Coming WeekGold remains within a broad rising channel, but recent price action shows clear rejection at the upper trendline. For the week ahead, the focus is on a potential technical pullback, while keeping an alternative bullish scenario if the market fully accepts higher prices.
PRIORITY SCENARIO – MAIN SCENARIO
Wait for structural confirmation to sell the medium-term corrective move.
Key confirmation level: a break of the trendline around 4317.
Trade idea: look for confirmation below 4317 to sell the corrective leg within the rising channel.
Technical context: price is trading near the upper boundary of the channel and showing rejection, a common setup before a rotation back toward lower value areas.
Position management:
Sell positions should be treated strictly as corrective trades within a broader uptrend. If price fails to stay below 4317 and regains bullish structure, risk should be reduced and short positions avoided.
ALTERNATIVE SCENARIO – SECONDARY SCENARIO
Trend continuation if price breaks to new highs and finds acceptance.
Trigger condition: a clean breakout to new highs with sustained bullish momentum.
Trade idea: prioritize buy setups once the market clearly accepts higher prices.
Technical context: successful breakouts often lead to range expansion, making short positions unfavorable.
KEY MEDIUM-TERM BUY ZONE
Liquidity-based opportunity in the event of a deeper pullback.
Reference buy zone: around 4220.
Rationale: this area represents a major liquidity cluster and a logical zone to monitor for bullish reactions during a deeper year-end pullback.
KEY TECHNICAL REASONS
The dominant H4 trend remains bullish, but rejection at the upper channel increases the probability of a technical correction.
The 4317 level acts as a key decision point to distinguish between a genuine pullback and temporary consolidation.
The 4220 area serves as a value zone aligned with liquidity for potential trend-following buys.
MACRO AND NEWS CONTEXT
Recent comments have reinforced expectations of future rate cuts to address labor market risks, which remains supportive for gold in the broader context. Geopolitical developments, including discussions around the next steps in the Gaza peace process, continue to underpin safe-haven demand. However, year-end holiday conditions often result in thinner liquidity, wider spreads, and less reliable price moves, making discipline and risk control essential.
RISK MANAGEMENT AND WEEKLY PLAN
Avoid chasing long positions near the upper trendline of the rising channel. Only consider short positions after clear confirmation below 4317, avoiding emotional top-picking in a bullish market. If price breaks and holds above recent highs, shift focus back to trend-following buy setups. Reduce position size during the holiday week and prioritize trades around well-defined key levels rather than extended moves.

XAUUSD (D1) – Weekly OutlookLana focuses on buying discounted zones, preparing for a possible ABC correction 💛
Quick summary
Higher timeframe (Daily): The main uptrend remains intact and structurally strong
Elliott Wave: Gold likely completed Wave 5, with a potential ABC corrective phase ahead to complete the cycle
Liquidity: Christmas week and year-end positioning may cause thin liquidity and irregular price movements
Plan: No chasing. Lana waits for price to reach key buy zones at 4250 and 4205
Market context for next week
Next week’s trading activity may slow down due to the Christmas holiday and preparations for the year-end. Thinner liquidity often leads to sharp, irregular moves and liquidity sweeps. At the same time, ongoing geopolitical tensions continue to support gold, while USD weakness adds further tailwinds. Because of this, Lana prefers a zone-based approach rather than trying to predict exact tops or bottoms.
Technical view on D1
On the Daily chart, gold still shows a solid bullish foundation. However, from an Elliott Wave perspective, price appears to be finishing the final impulsive wave (Wave 5). After a Wave 5 completion, a corrective ABC structure is common, allowing the market to rebalance before the next major move.
For Lana, a correction is not bearish—it’s an opportunity to look for higher-probability buys at discounted levels instead of chasing price at elevated zones.
Key levels Lana is watching
1) Primary buy zone: 4250
This level previously acted as a strong resistance and was decisively broken. Liquidity remains concentrated in this area, making it a favorable zone to look for buying opportunities if price pulls back.
2) Long-term buy zone: 4205 (POC from Volume Profile)
This is a major Point of Control where price previously accumulated heavily. If the ABC correction extends deeper, this zone becomes a key area for longer-term positioning.
Trading plan for next week (overview)
Early in the week, Lana will observe lower timeframes to confirm entries.
Priority is given to pullbacks toward 4250; deeper corrections may offer opportunities near 4205.
With thin holiday liquidity, Lana plans to:
reduce position size
keep stop losses clearly defined
scale out profits once price reacts from the zones
Lana’s note 🌿
Holiday weeks often bring fewer clean setups but more unexpected liquidity grabs. Lana will stay patient, trade selectively, and focus only on price levels that truly make sense.
This is Lana’s personal market view, not financial advice

How Emotions Destroy Profitable TradersHow Emotions Destroy Profitable Traders
🧠 How Emotions Destroy Profitable Traders | Trading Psychology Explained
Most traders don’t fail because of strategy.
They fail because they can’t control emotions.
Even a profitable system becomes useless when emotions take control of decision-making. Let’s break it down 👇
😨 Fear: The Profit Killer
Fear appears after losses or during volatility.
What fear causes:
Closing trades too early
Missing high-probability setups
Moving stop losses emotionally
📉 Result: Small wins, big regrets.
Fear stops traders from letting probabilities play out.
😤 Greed: The Account Destroyer
Greed appears after wins.
What greed causes:
Overleveraging
Ignoring risk management
Holding trades too long
📈 Traders want “more” and end up losing everything.
Greed turns discipline into gambling.
😡 Revenge Trading: The Fastest Way to Blow an Account
After a loss, many traders try to win it back quickly.
Revenge trading leads to:
Random entries
No confirmations
Breaking trading rules
🔥 One emotional trade often leads to many bad trades.
🤯 Overconfidence After Wins
Winning streaks create false confidence.
Overconfidence causes:
Larger position sizes
Ignoring market context
Believing losses “won’t happen”
Markets punish ego — always.
😴 Impatience: Silent Consistency Killer
Good trades require waiting.
Impatience leads to:
Forcing setups
Trading low-quality zones
Entering without confirmation
⏳ The market rewards patience, not speed.
🧘♂️ How Profitable Traders Control Emotions
Professional traders don’t eliminate emotions — they manage them.
Key habits:
Fixed risk per trade
Pre-planned entries & exits
Accepting losses as part of business
Waiting for confirmation
Trading less, not more
🧠 Discipline > Emotion
📊 Process > Outcome
📌 Final Thought
If emotions control your trades, the market will control your money.
Master your psychology, and your strategy will finally work.
Trade the plan.
Respect risk.
Stay patient.

XAUUSD H1 Main Trend for the Weekend
Gold failed to confirm a sustainable upward momentum after yesterday's price reaction, prioritizing a short-term adjustment scenario before reassessing the trend
PRIORITY SCENARIO
Strategy to sell based on reactions at large volume areas, suitable for the current short-term structure
Focus sell area: 4332 – 4342
Technical basis: these are areas concentrated with volume according to the Volume Profile, where price is likely to show distribution reactions after a weak recovery
Expected movement: price recovers to the large volume area for distribution, then continues the adjustment phase
Daily target:
Heading towards the 4275 area, coinciding with the Fibonacci retracement area and underlying support
Position management:
Sell should only be held short-term. If the price surpasses and stabilizes above 4342, risk should be reduced and avoid holding sell orders.
ALTERNATIVE SCENARIO
Monitor price reactions at deeper support areas to reassess trading opportunities
Strong support area: around 4275
Technical context: this is the convergence area between structural support and Fibonacci retracement, likely to show defensive buying force
Expected movement: if the price reacts well at this area, the market may enter a re-accumulation state
MAIN REASON
On H1, the previous upward phase failed to maintain a clear upward structure, indicating weakening buying force
Volume Profile helps identify the 4332 – 4342 areas as advantageous entry points for the sell reaction scenario
The 4275 area serves as a reasonable adjustment target in the context of a typically momentum-lacking weekend market
MACRO CONTEXT AND MEDIUM-TERM OUTLOOK
While short-term fluctuations lean towards adjustment, major institutions still maintain a positive outlook for gold in the medium and long term. Goldman Sachs forecasts gold prices could reach $4,900/oz by the end of 2026, supported by strong buying demand from central banks and positive impacts from the Fed's interest rate cut cycle.
This suggests that short-term declines may be more of a technical adjustment rather than a reversal of the long-term trend.

XAUUSD (H1) – Friday Weekend
Lana prioritizes the adjustment phase towards the POC area, looking to Sell in the liquidity zone 💛
Quick Summary
Context: Friday, the market often tends to take profits and sweep liquidity before the week closes
Monitoring Frame: H1
Main Viewpoint: Prioritize a decrease during the day (adjustment phase)
Key Point to Note: 4308 has reacted multiple times, a sensitive point in the structure
Market Context
The weekend is usually a time when the cash flow is “lighter” and price behavior tends to lean towards profit-taking. Therefore, an adjustment phase to gain more liquidity is the scenario Lana prioritizes today.
From a medium-term perspective, some large institutions still maintain a positive view on gold. However, in intraday trading, Lana still prioritizes following the current price behavior and trading according to the liquidity zone.
Technical View H1
On H1, the price is fluctuating around the accumulation zone, and the POC/VAL area indicates this is a market zone that has been “back and forth” for quite a while. When the price returns to these areas, there is usually a clear reaction.
The 4308 area is noteworthy because the price has reacted multiple times, so this is a point that could determine whether the adjustment phase continues.
Today's Trading Scenario
Main Scenario – Sell at POC/VAL area (large liquidity)
Sell: 4335 – 4340
Lana prioritizes waiting for the price to rebound to this area to sell according to the adjustment phase. This is a large liquidity zone, suitable for finding a downward reaction during the day.
Alternative Scenario – Buy scalping at near support
Buy: 4284 – 4289
This Buy order is only for scalping when the price hits the support area and a bounce reaction appears. If the market continues to be weak, Lana will not hold the Buy for too long.
Session Notes
If the price continues to be rejected around resistance areas and cannot surpass the supply zone, the adjustment scenario will have an advantage.
For Friday, Lana prioritizes light trading, quick closing, avoiding holding positions too long over the weekend.
Lana's Notes 🌿
Each scenario is just a probability. Lana always sets a stop loss first, chooses the appropriate volume, and is ready to skip if the price does not reach the waiting area.
