XAUUSD H1 Trading with Volume Profile Ahead of CPI RiskXAUUSD H1 Trading with Volume Profile Ahead of CPI Risk
Gold is slowing down as the market awaits news and liquidity is fragmented, so prioritize trading according to Volume Profile zones to choose advantageous entry points instead of chasing prices.
PRIORITY SCENARIO
Strategy to buy at POC and VAL zones according to Volume Profile, suitable for a medium-term perspective.
Buy zone: 4314 – 4317
SL: 4307
TP: 4328 – 4345 – 4363 – 4370
Technical context:
On H1, the price is accumulating and reacting around the value area. The 4314–4317 area is the POC and VAL zone, often a liquidity attraction point and likely to see buying pressure if the structure maintains support.
Expected movement:
Price holds the 4314–4317 zone, absorbs short-term selling pressure, then rebounds to the above TP levels. When approaching 4345, monitor reactions as this is an area prone to selling pressure.
Position management:
If the price quickly rises but fails to hold above 4328, consider reducing risk. If the price clearly breaks below 4307, prioritize stopping the buy scenario and wait for a deeper zone.
ALTERNATIVE SCENARIO
Sell scalping strategy at short-term resistance zone, higher risk as the larger trend still favors buying.
Sell scalping zone: 4343 – 4346
SL: 4353
TP: 4325 – 4310 – 4290
Technical context:
The 4343–4346 area is a sell scalping zone on the chart, suitable for short-term trading when the price rebounds to resistance and clear rejection signals appear.
Note:
Sell should only be a scalping order. Do not prioritize holding long sell positions if the market is still in an accumulation phase awaiting news.
MAIN REASON
Volume Profile shows that POC and VAL zones are advantageous entry points during a sideways market lacking a clear trend.
The 4314–4317 zone acts as a value support area for finding buy points, while 4343–4346 is suitable for sell scalping when the price rebounds to resistance.
When the market awaits news, the likelihood of liquidity sweeps increases, so trading by zones will be more effective than chasing candles.
MACRO CONTEXT AND CPI DATA
The upcoming US CPI release during the North American session will be the main variable guiding Fed policy expectations, directly impacting USD and gold. Ahead of data risk, dovish expectations from the Fed are causing USD to lack strong upward momentum, but volatility may spike suddenly at the time of the news release, creating spikes and sweeping SL on both ends.
RISK MANAGEMENT AND MONITORING
Do not open orders when the price is between zones and has not reached the exact levels of 4314–4317 or 4343–4346.
Prioritize reducing volume before CPI or only maintain positions that are already profitable and manage tightly.
Focus on observing price reactions at POC VAL and sell scalping zones, as these are decisive points for short-term direction.
Forex

XAUUSD H1 Analysis Before Key NewsXAUUSD H1 Analysis Before Key News
During the Asian-European session, gold is likely to move sideways awaiting news as the market enters a sensitive phase with data and political factors, amidst a clearly formed short-term downtrend structure.
PRIORITY SCENARIO
Trading strategy according to the current structure, prioritizing short-term sell and buy at lower liquidity zones.
Main sell zone: around 4323, coinciding with the POC of the Volume Profile.
Technical context: price is moving below the equilibrium zone, clear H1 downtrend structure; the POC area often acts as a "pullback to sell" price zone.
Expected movement: early European session may see a pullback of about 40–50 points, then price returns to sideways movement and faces downward pressure again.
Position management:
Sell should only be held short-term and tightly managed when price reacts at 4323. If price surpasses POC and holds above this zone, risk should be reduced and avoid holding sell positions.
ALTERNATIVE SCENARIO
Strategy to buy at lower liquidity zones, suitable for medium-term trading.
Buy zone 1: around 4242, important VAH zone.
Buy zone 2: around 4215, Buy Zone according to Volume Profile.
Technical context: these are two price zones with high liquidity density, often attracting buying force when the market needs to rebalance after a decline.
Expected movement: price sweeps liquidity below, creating a new accumulation base and seeking recovery opportunities.
MAIN REASON
On H1, a downtrend structure has formed after a distribution phase, indicating short-term advantage leans towards the sell side.
Volume Profile clearly identifies POC 4323 as a reasonable pullback zone to sell, while 4242 and 4215 are price zones with high probability of buying reaction.
Sideways scenario before news fits the market context awaiting important macroeconomic and political information.
MACRO CONTEXT AND POLITICAL NEWS
Political factors are strongly impacting the currency market, especially the USD. The US is said to have proposed a security guarantee mechanism for Ukraine similar to NATO's Article 5 to promote negotiations to end the conflict with Russia, although territorial issues have not yet reached consensus.
These signals are putting weakening pressure on the USD, thereby continuing to support gold in the medium term. However, in the short term, strong volatility around news release time is something to be particularly noted.
RISK MANAGEMENT AND MONITORING
Do not prioritize trading when price is between the equilibrium zone and has not reached important Volume Profile levels.
Sell orders should only be considered short-term trades before news, avoiding holding through data release or important political speeches.
Medium-term buy strategy will have more advantage if price reacts clearly at 4242 or deeper at 4215.
Closely monitor USD fluctuations as current political news is the main driving factor.

XAUUSD – Continuation Update | Buy Trade Progressing as PlannedAfter the earlier move and corrective phase, Gold once again respected the previous high → support zone, confirming that buyers were still defending structure.
🔹 Buy Trade Recap:
Entry taken after structure held above support
Price dipped close to SL, but never broke structure
Liquidity was grabbed, weak hands shaken out
Market respected demand and expanded upward
🎯 TP1 hit successfully
Partial profits secured as planned.
🔹 Current Status:
Buy position still active
Targeting TP2
SL protected and trade managed
This trade is a reminder:
Markets don’t reward impatience.
They reward those who trust their analysis and manage risk.
Almost stopped out, yes — but structure stayed intact.
And that’s all that matters.
Patience is not passive.
It’s a position.
#XAUUSD #Gold #TradeManagement #SmartMoney #TradingView #ValhallaCore

NAS100 Preparing for Wave 3 Rally After Healthy PullbackThe NAS100 chart shows that a larger corrective move has likely finished at the (Y) / C low, after which price started a new upward impulsive structure. The recent decline looks like a normal Wave 2 pullback, which has already reacted from the 0.5–0.618 Fibonacci support zone, a common area for corrections to end. This suggests buyers are stepping back in and the market is preparing for Wave 3, which is usually the strongest upward move. As long as price stays above the invalidation level near 23,836, the bullish Elliott Wave setup remains valid. Overall, the structure favors further upside toward new highs once Wave 3 gains momentum.
Stay tuned!
@Money_Dictators
Thank you :)

XAUUSD H1 Analysis Based on Volume ProfileXAUUSD H1 Analysis Based on Volume Profile
Gold is moving sideways and consolidating around the 4,300 USD/oz area. The short-term direction remains unconfirmed and requires clear reactions at key liquidity zones.
PRIORITY SCENARIO – MAIN SCENARIO
Medium-term trend-following buy strategy at price areas with Volume Profile advantage
Primary buy zone: around 4284 based on VAL
Technical context: this is the lower value area where buying interest is likely to appear as the market continues to consolidate
Price expectation: price holds above VAL, absorbs short-term selling pressure, and gradually rotates back toward the upper balance area
Position management:
If price reacts positively and H1 candles hold above the 4284 level, a medium-term bullish bias in line with the main trend can be maintained.
If price breaks clearly below VAL, caution is required and deeper reaction zones should be monitored.
ALTERNATIVE SCENARIO – SECONDARY SCENARIO
Deeper buy opportunity in the event of additional liquidity sweep
Alternative buy zone: around 4242, based on the VAH of the previous value area
Technical context: this area represents the upper value zone of the prior consolidation and may act as strong support during a deeper pullback
Price expectation: downside liquidity sweep followed by a recovery, restoring market balance
SELL SCENARIO – HIGH RISK
Sell positions should only be considered as short-term trades, not a primary strategy
Short-term sell zone: around 4378, based on the 2.618 Fibonacci extension
Note: sells should only be considered if clear price rejection signals appear. Avoid holding short positions for extended periods while the broader trend remains bullish.
KEY REASONS
On the H1 timeframe, price is consolidating, indicating the market needs additional liquidity before confirming the next directional move
Volume Profile clearly highlights high-probability trading zones, particularly VAL at 4284 and VAH at 4242
The 4378 level represents an extended resistance zone suitable for profit-taking or short-term countertrend sells
MACRO CONTEXT AND MARKET SENTIMENT
Gold continues to hold strong near the 4,300 USD/oz level, supported by expectations of continued monetary easing from the Federal Reserve and rising safe-haven demand.
Meanwhile, silver has faced short-term profit-taking pressure after reaching record highs, reflecting a more cautious market tone.
This week’s focus is on the US Nonfarm Payrolls report. Weak data may reinforce gold’s bullish trend, while strong data could trigger a short-term correction amid ongoing policy uncertainty within the Fed.
RISK MANAGEMENT AND MONITORING
Avoid trading while price remains in the middle of the consolidation range and away from key Volume Profile levels.
The medium-term buy strategy loses its edge if price breaks clearly below 4242 and fails to reclaim the level.
Closely monitor volatility around the Nonfarm release, as sharp spikes and liquidity sweeps are highly likely.

XAUUSD H4 Medium Term Rising Channel and Key Liquidity ZonesXAUUSD H4 – Medium-Term Rising Channel and Key Liquidity Zones
Gold reacted sharply after touching the trendline, with the primary focus next week on buying pullbacks in line with the dominant trend
PRIORITY SCENARIO – MAIN STRATEGY
Trend-following buy strategy on a corrective move into key support and liquidity areas
Primary buy zone: 4175 – 4203
Technical context: this area represents a previously validated support zone and a clear pool of downside liquidity
Price expectation: a corrective dip into support, absorption of selling pressure, followed by a potential rebound back toward the upper balance area
Position management:
If price shows a strong reaction and H4 candles hold above the support zone, maintaining a swing-long bias remains favoured.
If price breaks decisively below support, risk should be reduced and deeper levels monitored.
ALTERNATIVE SCENARIO – SECONDARY STRATEGY
Deeper pullback buy opportunity near the lower trendline of the rising channel
Alternative buy zone: near the lower boundary of the rising channel, aligned with long-term liquidity
Technical context: this area acts as the last line of defence for the medium-term bullish structure and is suitable for longer-term positioning
Price expectation: a deeper liquidity sweep followed by recovery, reaffirming the rising channel
KEY TECHNICAL POINTS
On the H4 timeframe, price continues to trade within a rising channel. The sharp 100-point drop after touching the upper trendline highlights profit-taking pressure at higher levels
The 4175 area and the lower channel trendline remain the most important liquidity zones for trend-aligned buying
Upper resistance and the FVG-liquidity zone are better suited for trade management rather than aggressive new longs
MACRO AND MARKET CONTEXT
Markets are reacting to growing expectations of a potential shift in future Federal Reserve leadership and policy direction.
The probability of Kevin Warsh becoming the next Fed Chair has increased, alongside comments indicating a preference for significantly lower interest rates.
Such expectations may remain supportive for gold in the medium term, although short-term technical corrections should still be respected after strong upside moves.
RISK MANAGEMENT AND MONITORING
Avoid chasing price near the upper boundary of the rising channel.
Any sell positions should be treated as short-term countertrend trades and only considered with clear rejection signals.
The bullish scenario weakens if price breaks and fails to reclaim the rising channel structure.
Remain alert to volatility around policy-related headlines and key economic data, as liquidity sweeps are likely.

Gold Strengthening as Bullish Structure FormsOANDA:XAUUSD is beginning to present a noticeably stronger bullish tone as the underlying price structure shifts upward.
The most recent market interaction is particularly noteworthy as an early recovery phase has emerged, bearish momentum has weakened, and a series of low-volume candles highlights clear seller exhaustion. These characteristics often signal the early stages of a new bullish movement.
From the current structure, my upside target remains the 4,330 region, a logical and well-aligned level within this developing trend. If price continues to build on this momentum, the next leg could become a clean and convincing extension of the broader bullish narrative we have been following on Gold.
This setup stands out as highly compelling. The story is unfolding, yet it still requires patience and a confirmed signal to validate the upward potential.
Although a deeper pullback cannot be completely ruled out due to the defined support zone below, I continue to favor bullish continuation as the forming structure clearly supports the upside scenario.
Wishing you a strong and profitable trading session.

Gold’s Next Move: 4,350 Within Reach – Are You Ready?Hello everyone, it's Luiss_Miguel here!
Gold is looking pretty interesting right now. As mentioned in the previous analysis, the price has shot up. But guess what? Right now, it's slightly pulling back, moving in the opposite direction to the previous uptrend, which looks like a familiar bullish flag pattern. In this case, there’s only one scenario that could play out, and when the price breaks out from the top of the bullish flag, it’s usually a buy signal, and the price could continue to rise.
My target is 4,350.
Do you agree? Leave a comment below. Joining the TradingView community is always helpful to improve and develop your trading skills.

XAUUSD H1 Volume Profile and Key Price AreasXAUUSD H1 – Volume Profile and Key Price Areas
Gold remains in a strong uptrend, with the primary strategy focused on buying pullbacks
PRIORITY SCENARIO – MAIN STRATEGY
Buy-the-dip approach aligned with the dominant trend using Volume Profile levels
Expected buy zone: around 4253 based on VAH
Short-term range to monitor: 4263 – 4285
Price expectation: rebound from VAH toward the upper range before further expansion
Position management:
If price holds above the 4263 area and shows clear bullish reaction, maintaining long exposure remains favorable.
If price is strongly rejected near 4285, risk should be reduced as this zone represents an important short-term resistance.
ALTERNATIVE SCENARIO – SECONDARY SETUP
Short-term countertrend opportunity at an extended resistance level
Sell zone for the alternative scenario: around 4310 at the Fibonacci extension
This setup is only considered if clear rejection signals appear at the level
KEY REASONS
The bullish structure on the H1 timeframe remains intact
Volume Profile highlights the VAH near 4253 as a high-probability reaction zone
The 4310 area represents an extended resistance suitable for profit-taking or short-term pullback reactions
MACRO CONTEXT
The Federal Reserve continues its rate-cutting cycle and maintains a dovish stance, putting pressure on the US dollar and supporting gold prices.
Geopolitical tensions and concerns about US economic slowdown further reinforce safe-haven demand.
Markets are now focused on the upcoming Nonfarm Payrolls report, where weaker data could drive further upside, while stronger data may trigger a short-term correction.
RISK MANAGEMENT AND MONITORING
Avoid chasing price while gold trades within the 4263 – 4285 range.
The bullish scenario becomes invalid if price breaks clearly below the support area beneath the VAH.
Expect increased volatility around major economic data releases and manage exposure accordingly.

Gold Breaks Key Resistance Bulls Take ControlGold has finally punched through the critical $4,240-4,250 resistance zone, now trading comfortably above this level. The breakout comes after a period of consolidation, which typically signals strong underlying momentum. This is a textbook technical setup where previous resistance should now flip to support.
Key Levels to Watch:
The path forward looks clear toward the psychological $4,300 level, followed by the all-time high at $4,380. As long as price holds above the $4,240 area, the bias remains bullish. A breakdown and close below this zone would be needed to invalidate the bullish structure and signal a potential reversal.
Outlook: The technical picture favors continuation to the upside. Bulls are in control here, and any pullbacks toward the $4,240-4,250 zone could offer buying opportunities for those looking to join the trend.

Bullish Structure Locked In — Gold Eyes 4,405Hello everyone, this is Luiss_Miguel!
At the moment, XAUUSD is a textbook example of a market moving within a well-defined ascending channel, with price consistently respecting both the upper and lower boundaries of the structure.
Recently, we observed a clear breakout above a key resistance zone, followed by a high-quality retest. This area aligns perfectly with the Golden Pocket of the previous bullish leg, making it a highly significant level to watch.
If this zone continues to hold as support, it would provide a strong structural confirmation of the bullish trend, increasing the likelihood of price extending toward 4,405, which represents the upper boundary of the channel.
As long as price remains above this supportive region, the bullish scenario remains intact. However, if price dips below it, short-term bullish momentum could weaken, potentially opening the door to a deeper corrective move.
Always remember to apply strict risk management to protect your capital.
Wishing you all the best — and trade wisely.

XAUUSD – Brian | After the rate cutXAUUSD – Brian | After the rate cut, Volume Profile still favours further downside
1. Market snapshot
After the rate cut, gold saw a bounce but failed to sustain the upside and is still hovering below last week’s highs.
In the Asian session, price only ticked up slightly before being sold off again – a sign that buying pressure is not particularly strong at these levels.
Risk-on sentiment has returned and the USD is seeing a modest recovery, which is weighing on XAU/USD.
That said, expectations for the Fed to maintain a dovish tone could still cap USD strength in the medium term.
Overall, in the short term Brian still leans towards a downside move, preferring to sell into liquidity above rather than chase buys.
2. Volume Profile view – Key levels to watch
On the H1 chart, Volume Profile highlights three main areas:
VAL – Buy scalping zone: around 4,207
→ Current lower value area, where a short technical bounce may appear.
Liquidity / Sell zone: around 4,222
→ Liquidity pocket above, lining up with VAH and a volume cluster – an attractive area to look for sells if price is pushed back up for a retest.
Deeper buy zone: around 4,166
→ Broader demand area below; if price flushes lower after sweeping liquidity, this is where dip-buying interest may show up.
3. Trade scenarios (for reference)
Scenario 1 – Sell at the 4,222 liquidity zone (primary idea)
Idea: Wait for price to retrace into the 4,222 liquidity zone and then look for rejection signals on H1/M15.
Sell zone: 4,220–4,223
Suggested SL: Above 4,230
Targets:
TP1: 4,207 (VAL)
TP2: 4,190–4,185
TP3: 4,170–4,166 (deeper buy zone)
This setup follows the current bearish bias, using the logic of “sell the rally into high-volume + liquidity zones”.
Scenario 2 – Light buys at VAL 4,207 & buy zone 4,166
Scalp buy at VAL:
Entry zone: 4,204–4,207
Target: bounce back towards 4,217–4,220 and then exit, not a long hold.
Buy at the deeper 4,166 zone (cleaner level):
Entry zone: 4,164–4,168
SL: Below 4,158
TP: 4,190 → 4,210 if a clear bullish candle reaction forms and the Fed does not turn overly hawkish.
Both buy scenarios are purely short-term corrective plays, so position size should be kept modest as the main bias remains to the downside.
Be patient and only start thinking about sells once price tags the 4,222 area – avoid forcing entries when price is stuck in the middle of the range.
In summary: Selling around 4,222 is the primary plan, while buys at 4,207 and 4,166 are secondary strategies that only come into play if there is a clear reaction from Volume Profile and price action.

Will GOLD Hold the Key Suppor? Watching for a Push Toward 4195Gold continues to trade within a tight intraday range. The 4180–4175 area is acting as a solid support zone, with buyers consistently stepping in on dips. On the upper side, supply remains active around 4200–4196, keeping price capped for now.
As long as Gold holds above the 4175–4180 support region, there is a reasonable probability of another attempt toward the 4195 level. A clean push above 4196 could open the door for buyers to retest 4200 and potentially higher. However, a breakdown below 4175 would invalidate this short-term bullish bias.
📌 Key Levels
Support: 4180–4175
Resistance / Supply: 4196–4200
Upside Target: 4195+
📈 Bias: Mildly bullish above 4175; neutral-to-bearish if broken.
⛔ Disclaimer: This is not financial advice. Always manage risk and trade based on your own analysis.
Your feedback drives our content and keeps everyone trading smarter. Let’s make those pips together! 🚀
Happy Trading,
– The InvestPro Team

Gold Stuck in Consolidation Ahead of FOMCGold just trading in sideways right now, stuck between 4,175 and 4,200 while everyone waits on tomorrow's FOMC. Current price around 4,194 is basically dead center of this range classic indecision. Nobody wants to make a move until Powell speaks.
Technically, it's pretty straightforward. If we push higher, there's resistance sitting at 4,240 4,255 that's been holding back rallies all week. On the flip side, a break below here targets the 4,100-4,120 support area .
The 25bp cut is basically a done deal. What traders actually care about is what Powell says about next year. Is the Fed done after this, or are more cuts coming? That's the real question, and nobody knows the answer yet.
So we're stuck in this boring chop. Volume's light, moves get faded quickly, and it's just back and forth noise. Honestly, it's the kind of price action that kills your soul if you're trying to trade it. Better to sit tight and wait for the Fed to give us some actual direction. Could rip through 4,240 if Powell's dovish, or dump to 4,100 if he sounds hawkish. Until then, it's just a waiting game.

XAUUSD: The Bullish Pennant That Could Trigger the Next RallyHello everyone, what is your take on XAUUSD right now?
The 2 hour chart is becoming quite interesting. Price action is shaping a clean bullish pennant, a pattern that often suggests the market is building pressure for its next major move. After completing its corrective pullback, XAUUSD is beginning to show signs that buyers may be preparing to re-enter and push the trend higher again.
If momentum returns, my outlook targets a break above 4265, followed by an extension toward 4430. This zone aligns perfectly with the Fibonacci 1.618 projection, which adds strong confluence to the bullish scenario.
Share your thoughts and your targets in the comments. I would love to hear how you are interpreting this setup.

EURUSD – Clean HTF Discount Zone Re-test With Bullish ContinuatiPrice has returned into a deep HTF discount zone, and the reaction from this area aligns well with my overarching bullish narrative. The marked zones represent the regions where I want to see LTF confirmational behavior before considering any long entries.
The structure remains intact as long as price holds above the lower boundary of the zone. A decisive close below that level will invalidate the bullish bias completely and shift the entire directional expectation.
Bullish Path:
• Price taps into the discount zone
• LTF confirms accumulation / BOS
• Price pushes toward the mid-structure continuation level
• Final objective lies near the upper liquidity pool (DOL), assuming underlying conditions remain unchanged
Key Levels Noted on the Chart:
• Entry Interest: All highlighted zones (LTF confirmation required)
• Mid-structure Expectation: Level where I want price to show EDD for continuation
• Final DOL Target: Only if macro conditions remain aligned
• Bias Invalidation: A clean close below the lower major zone
⚠️ ENTRY CONDITION (IMPORTANT):
I will execute the trade only if the LTF mirrors the structural behavior I’m expecting from the HTF.
No LTF confirmation = No trade.

XAUUSD – Brian | Volume Profile & Fed WeekXAUUSD – Brian | Volume Profile & Fed Week: prioritize Sell at VAH, Buy only when reaching discount price area
1. Market snapshot
On H1, gold retested last week's peak and then dropped immediately, indicating that buying pressure at high price levels remains cautious – investors are not ready to "chase the price."
The current structure does not clearly show a long-term trend, but in the short term, there are signs of distribution around high price levels, favorable for selling scenarios according to Volume Profile.
Today, Brian prioritizes watching for a Sell after the price fills the FVG and touches the VAH, while also preparing a Buy scenario at a lower area if the market sweeps liquidity strongly.
2. Volume Profile & price structure
The VAH area around 4,233–4,235 coincides with the FVG area above:
This is where large volumes were previously traded, making it easy for profit-taking/sell-off forces to appear.
Below, the sell-side liquidity levels are spread around 4,200 – 4,175 – 4,140, coinciding with the lows of previous sessions.
The area 4,172–4,175 is a good balance zone for the Buy scenario: below it is a cluster of liquidity and just above a broader Buy zone around 4,140 on the chart.
3. Trading plan for this week
Scenario 1 – Sell according to Volume Profile (priority)
Entry Sell: 4,233–4,235 (VAH + FVG)
SL: 4,241
TP1: 4,215
TP2: 4,200
TP3: 4,175
TP4: 4,140
Idea: wait for the price to fill the FVG and touch the VAH, observe the H1/M15 candle reaction. If there is a clear rejection signal (long upper tail, pin bar, engulfing…), activate the Sell order. This is a short-term play, based on volume & liquidity, not a chase sell when the price is in the middle of the zone.
Scenario 2 – Buy when the price reaches the discount area
Entry Buy: 4,172–4,175
SL: 4,165
TP1: 4,195
TP2: 4,220
TP3: 4,245
TP4: 4,290
Idea: if the price is strongly sold off sweeping through the sell-side liquidity areas, the area 4,172–4,175 can become a good demand zone to catch the rebound, especially when a nice candle reaction appears on H1. This is a "catch the rebound" buy position in the context of this Fed week, requiring disciplined SL.
4. Macro context – Why is the market hesitant?
Last Friday, gold jumped to 4,260 USD and then quickly fell to 4,200 USD, mainly due to the sharp rise in US bond yields as the market awaited the Fed meeting.
Although the market still prices in a high probability of the Fed cutting 25 bps, sentiment is divided by the "hawkish rate cut" scenario:
The Fed cuts but maintains a tough tone on inflation → yields are unlikely to fall deeply, gold is easily sold at high levels.
USD maintains its range, US economic data is relatively stable, causing money flows to "not dare to all-in" on gold before the dot-plot and Powell's speech.
Therefore, this week is the Fed's week: the short-term direction of gold will depend heavily on the policy message, especially the expected reduction path for next year.
Follow to receive the earliest articles from Brian

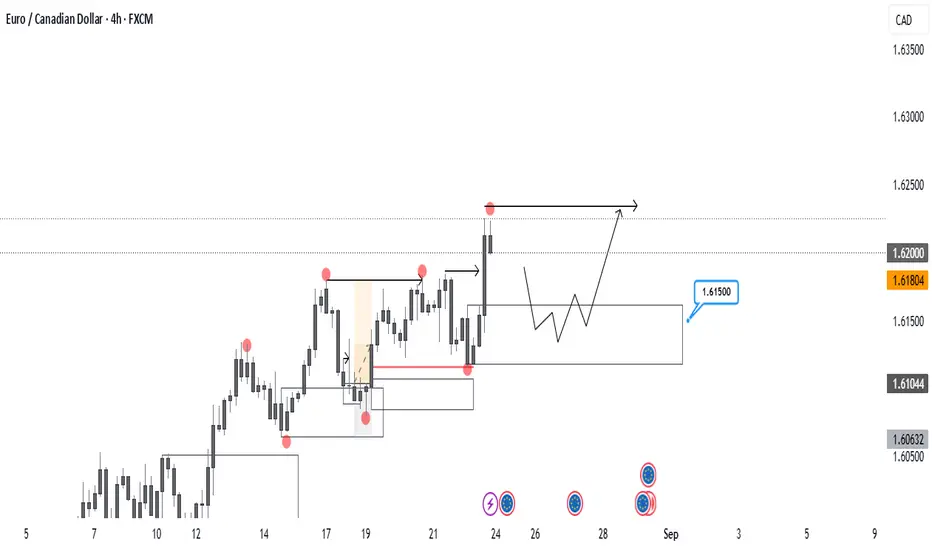
EURCAD - CONTINUATION TRADEThe pair is in a clear uptrend, consistently forming higher highs and higher lows. I’m waiting for a healthy pullback into the demand zone, where I’ll look for confirmation to enter long position. Setup remains solid as long as structure is maintained. If in any case price drop below the demand zone, that will indicate shift in a structure.
EURNZDPrice action has been strongly bullish, with an impulsive push to the upside that took out a weekly high. That may have completed the price objective, which is why I’m now expecting a potential drop. A structure shift has already occurred and an entry was available, though I didn’t take it.
For now, I’ll stay on the sidelines and watch price action. If price reaches the demand zone, I’ll look for confirmation to get into longs. There’s also a large inefficiency/price void that could be filled on the way down. Let’s see how this pair develops — just sharing a possible scenario.

USDJPYIt looks like price completed its objective just before Friday’s news release, after which USD dropped sharply. From a technical perspective, structure has flipped from bullish to bearish. A clean correction to the upside into the 148.0 supply zone followed by a drop would make perfect sense. I’ll be watching to see if this develops into a swing move.

NZDJPY SELLSNZDJPY tapped the top of daily supply, aligning with the 88.0 region. While 4H structure is bullish, higher timeframes take priority. Price already flipped 15M structure, giving early bearish confirmation. Short makes sense here with a conservative stop above the daily high. And also if you look at the daily timeframe you can see how bears are in control, 3 times stronger.
Couple of downside targets so let's see.

GBPJPYAs you can see price is clearly in an downtrend. Nice push to the downside, and nice recovery back up. And with 4 points being made ( H,L,HL,LL) downtrend is confirmed. I marked 4H supply that aligns with 202.000 handle.
While on the 4H is a downtrend, on daily timeframe, price is in a bullish leg and now coming up from filling the imbalance. Now if I was paying attention I could get into buys at the bottom and trap the market. However that was not the case.
That can cause price to go higher and break through our supply. But that is why we wait for confirmation on smaller timeframes before entering the trade.
Remember, no confiration - no entry.

XAUUSD – Brian | Volume Profile & TrendlineXAUUSD – Brian | Volume Profile & Trendline: prioritize Sell, wait for a “good deal” in the liquidity zone
1. Market snapshot
On H1, gold is touching the trendline just as yesterday's scenario – this is an area where strong price reactions may occur.
The current structure shows that the price is gradually distributing below the trendline, with no clear signal that buyers have regained control.
In the short term, Brian prioritizes the Sell scenario, utilizing the POC – VAH – FVG areas of the Volume Profile to find entry points.
2. Volume Profile – Key price areas to note
Short-term POC/VAH area around 3,488–3,492 (according to his chart):
This is an area where dense trading occurred, the profile “bulges” out, indicating strong market interest.
When the price returns to this area, a reaction is expected – suitable for entering orders in the current priority direction.
Sell-side liquidity below: If gold cannot hold the POC/VAH area and is pushed down, the liquidity area below will become a reasonable target for the next downward move.
Gold is likely to fluctuate sideways on Friday to close the weekly candle below the trendline, then consider a clearer break at the start of next week.
3. Trading scenario for next week
Scenario 1 – Prioritize Sell at the Volume Profile area
Main mindset: When the price returns to the POC/VAH areas above, prioritize finding short signals instead of chasing buys.
Watch for clear candle reactions (long upper tail, pin bar, engulfing…) at the thick profile area.
Target: Gradually close towards lower liquidity areas (sell-side liquidity) below.
Depending on price behavior, the target can be expanded if selling pressure intensifies at the start of the week.
Scenario 2 – Break trendline & buy the retracement
If gold decisively breaks the downtrend line, closes above, and maintains the new structure:
Then, the strategy will shift to buying the retracement at the trendline itself (now acting as support).
The POC/VAL area below will then become a reasonable “buy zone” to follow the new upward trend.
In summary: before a clear break occurs, Brian still prioritizes selling at high liquidity areas, rather than rushing to catch the bottom.
4. Fundamental context – Large capital still supports gold
Central banks are increasing gold purchases:
In October, global central banks net purchased +53 tons of gold, the highest level since 11/2022.
This figure increased by +194% compared to July, marking the third consecutive month of increased purchasing speed.
This indicates: Short-term selling pressure may appear around the trendline/resistance, but long-term capital flow still favors gold.
Any deep declines later may still attract buying power from large institutions.
5. Risk management suggestions
Maintain the mindset: Sell is the current priority scenario, not the only option – if the structure changes, be ready to switch to buy.
Do not overlook the nearest liquidity/swing low area to place SL – avoid dragging SL too far due to emotions.
