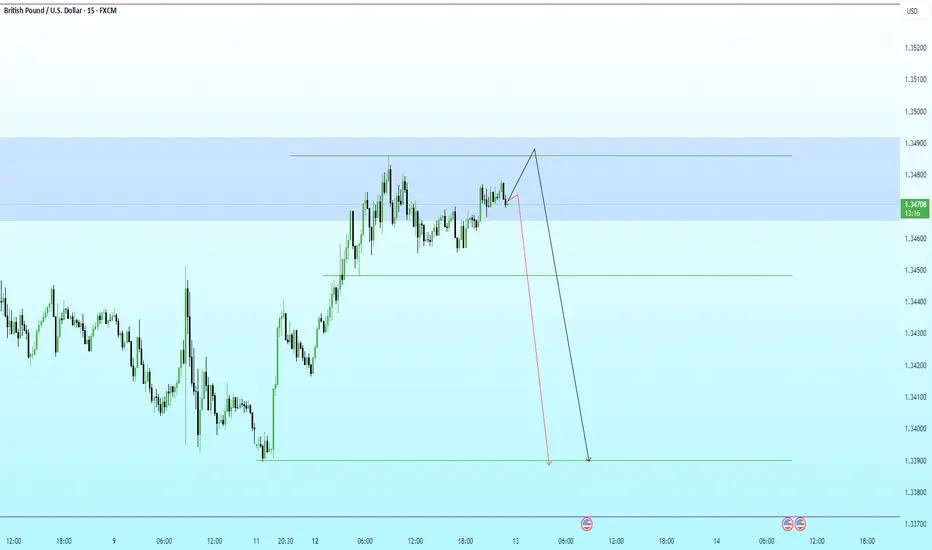
GBP/AUD: Corrective Rally, Downtrend IntactGBP/AUD is trading in a clear bearish Elliott Wave structure on the 4H timeframe. The market has already completed a strong impulsive decline and is currently moving in a Wave 4 corrective pullback, which is happening inside a downward channel and near key Fibonacci retracement levels. This correction looks weak and corrective, suggesting sellers are still in control. As long as price remains below the invalidation level around 2.0050 , the bearish bias stays valid. The expectation is for the correction to finish soon, followed by Wave 5 to the downside, targeting the lower channel area and the 1.96–1.95 zone. Overall, the trend remains bearish, and any short-term bounce is likely a selling opportunity before the next leg lower.
Stay tuned!
@Money_Dictators
Thank you :)
Forexsignals

USD/CHF Approaching Breakdown from RangeUSD/CHF is moving in a sideways corrective pattern, not a strong trend. The price is forming an A-B-C-D-E structure, which usually happens before the market makes a bigger move. Right now, price is in the last part of this pattern (wave E) and is sitting near a resistance area, where it has failed to move higher and has started to turn down. This behavior often means sellers are becoming stronger. As long as the price stays below 0.795–0.798 , the outlook remains bearish, and the market is expected to move lower toward the 0.782–0.775 support area. If this move happens, it would complete the corrective pattern after a short pause, and then the market can decide its next big direction.
Stay tuned!
@Money_Dictators
Thank you :)

USD/CAD: Elliott Wave Bearish BiasUSD/CAD is showing a bearish Elliott Wave structure on the 4H chart. Price appears to have completed a corrective Wave 2 near the 0.5–0.618 Fibonacci retracement zone, which is a common area for corrections to end. From there, the market has started to turn lower, suggesting the beginning of a new impulsive Wave 3 to the downside, which is usually the strongest bearish wave. As long as price stays below the recent swing high near the retracement zone, the bias remains bearish, with downside targets toward the 1.365–1.360 area. A move above the Wave 2 high would invalidate this count and delay the bearish scenario.
Stay tuned!
@Money_Dictators
Thank you :)

NATURALGAS BOOM Naturalgas gas make a high of 444on 21 Jan 26. It's good move. Entry was given near 297 . Keep Trial SL don't make new entry . It's news based Rally.
Tgt 350+

GBPUSD · 15M · SMC OutlookPrice is trading deep into premium, pressing against a well-defined HTF supply zone.
HTF Framework
Clear bullish leg already completed.
Buy-side liquidity resting above recent highs.
Premium zone aligns with prior distribution and weak highs.
LTF Structure
Momentum is slowing near the highs.
Price is consolidating under resistance, hinting at distribution.
Minor pullbacks are being absorbed, classic liquidity buildup behavior.
Expectation
A final push higher to sweep buy-side liquidity.
Reaction from supply after the sweep.
Strong bearish displacement targeting:
Internal range low
Prior demand imbalance
HTF discount zone below
Execution Plan
Avoid longs in premium.
Wait for:
Liquidity sweep above highs
Bearish displacement
LTF MSS for confirmation
Shorts favored post-confirmation.
Partial profits at range low, runners into discount.
USDCHF – M15 | Sell-Side Purge → Mitigation Rally → ContinuationPrice completed a textbook sell-side liquidity sweep, flushing weak longs below the range. The impulsive push down was real displacement. What followed is a forced bounce, driven by short covering and mitigation, not fresh demand.
Current price is retracing into a discounted supply / imbalance zone, where previous bearish orderflow originated. Structure remains bearish unless proven otherwise.
Market Narrative
Range highs → distribution
Sharp sell-side run = intent revealed
Bounce = mitigation into prior inefficiency
Execution Bias
Shorts favored into the marked retracement zone
Ideal entries on signs of rejection / bearish shift
Invalidation only on clean M15 acceptance above the green level
Targets
Recent sell-side lows
External liquidity below the range
Deeper discount expansion if momentum accelerates

USDCHF – M15 | Sell-Side Sweep → Reactive Bounce Price engineered a clean sell-side liquidity run, flushing range lows with displacement. The reaction that followed is corrective, not impulsive. What we’re seeing now is relief buying into discount, not a trend reversal.
Current bounce is unfolding inside prior inefficiency / mitigation, with structure still bearish on the execution timeframe.
Market Read
Range distribution → sharp sell-side sweep
Bounce = mitigation of bearish orderflow
No bullish displacement, only overlap
Execution Bias
Shorts favored on retracement into the marked supply / imbalance
Invalidation only on strong M15 acceptance above the green high
Targets
Recent sell-side lows
Extension into external liquidity below
Deeper discount if momentum expands

Gold (XAUUSD) — Bullish Trend Test Near Support Before BreakoutWhat are your thoughts on GOLD?
Gold recently break resistance of range-bound consolidation phase successfully.
After breakout of resistance it is now forming pullback after the resistance.
Here our momentum is bullish
Recent events (e.g., U.S.–Venezuela crisis and broader political instability) have pushed investors into gold as a safe asset — lifting prices toward record highs. Gold traditionally rises when global risks increase because traders and institutions want to protect capital.
📌 Plan A — Bullish (Main Idea)
• Wait for pullback to trendline/support area — a good entry spot for a long (buy).
• Entry: near trendline/support check (price shows bounce pattern).
• Stop Loss: just below the trendline/support (risk control).
• Target: near the top resistance zone — move higher if breakout happens.
📌 Plan B — Breakout Buy
• If price breaks above the resistance zone with strength, enter on the breakout candle close.
• Stop Loss: just below breakout level.
• Targets: next resistance levels higher.

EURUSD – 15M | Liquidity Sweep → Demand Reaction →Mean ReversionPrice delivered a clean sell-side liquidity sweep into a higher-timeframe demand zone.
Displacement down exhausted, followed by acceptance and stabilization inside value.
Current structure suggests:
Sell-side taken ✔️
Price reacting from HTF demand ✔️
Expectation: mean reversion toward premium / EQ highs
Plan:
Longs favored only after confirmation on LTF
Ideal entry: sweep + reclaim of intraday lows
Targets aligned toward prior supply / liquidity resting above
Invalidation: clean breakdown and acceptance below demand
Bias stays bullish as long as demand holds.

“Gold Base Holds — Ready for Breakout?”📊 Technical Chart Analysis (XAU/USD)
📌 Key Levels
Strong Support Zone (Red Box) – Price has been respecting this area and has bounced multiple times — signaling accumulation/support.
Mitigated FVG & CHoCH Area (Green Zone) – This area shows prior imbalance and a possible change of character, now acting as resistance.
Higher Resistance Region (Dark Grey) – A key supply zone the price may target if bullish momentum continues.
Important Horizontal Levels:
• Around ~4300—support (green line)
• Around ~4258—deeper support (red horizontal)
📈 Bullish Scenario (Preferred)
✔ Price is holding above support.
✔ A potential CHoCH (Change of Character) indicates buyers may be stepping in.
✔ The mitigated FVG zone above ~4375/4400 is a logical target if bullish momentum resumes.
✔ The black dashed path on your chart suggests a retest of the support before continuation.
Bullish Path:
Retest support
Bounce and clear local resistance
Rally up toward the grey supply zone above ~4400–4500
📉 Bearish Alternative
If support breaks decisively:
Price could revisit the deeper support ~4258 (red horizontal)
Then possibly resume higher momentum from that level (red dashed path)
🧠 Fundamental Reasons Supporting Bullish Gold (2026)
Here are core macro drivers that could push gold prices higher:
✔ 1. Central Bank Buying & Safe-Haven Demand
Major central banks have been accumulating gold reserves aggressively, reinforcing structural demand and reducing available supply.
The Times of India
✔ 2. Anticipated Monetary Easing
Markets increasingly expect interest rate cuts or easier policy from major central banks in 2026. Lower rates reduce the opportunity cost of holding gold (which doesn’t yield interest).
State Street Global Advisors
✔ 3. Weakening U.S. Dollar
Gold is priced in USD — a weaker dollar typically boosts gold due to increased purchasing power for foreign buyers.
State Street Global Advisors
✔ 4. Geopolitical & Economic Uncertainty
Inflation risk, geopolitical tensions, and global macro instability have historically driven capital into gold as a hedge and safe-haven asset.
Financial Times
✔ 5. Portfolio Diversification & ETF Inflows
Record flows into gold ETFs and strategic institutional allocations have supported price strength.
Morgan Stanley
🟢 Bullish Fundamental Summary
Gold’s fundamentals point to a continued structural bull cycle — even if price consolidates in the short term. Central bank demand, possible rate cuts, USD weakness, and geopolitical uncertainty all provide strong backing for a continued uptrend into 2026.
State Street Global Advisors
+1
📌 Technical + Fundamental Confluence
Bullish Scenario is stronger if:
• Support holds above ~4300–4258
• Price breaks above mitigation zone around ~4400
• Volume increases on upward moves


DXY Breakdown After Major Top – Wave v in ProgressThe DXY chart shows that the U.S. Dollar has completed a larger corrective structure and is now moving inside a new impulsive bearish phase. After forming a major top near the 110 area, the index started a clear five-wave decline, indicating strong downside momentum. The recent sideways movement looks like a corrective pause (wave iv / Y) rather than a trend reversal. As long as the price stays below the key resistance zone around 100–101, the overall structure remains bearish. This suggests the dollar is preparing for the final wave lower (wave v / 3), which could push the index toward deeper support levels. Overall, the Elliott Wave structure favours continued weakness in the U.S. Dollar in the coming months.
Stay tuned!
@Money_Dictators
Thank you :)

GBP/USD Signals Trend Shift – Impulsive Upside ExpectedThe chart shows that GBP/USD has completed a full W–X–Y corrective pattern, with the final wave (y) and its C wave forming a clean bottom near the long-term support line. From that low, price has started a strong upward move, which looks like the beginning of a new impulsive Wave 1. The current pullback toward the 0.382–0.618 Fibonacci zone is typical behavior for a Wave 2 retracement before the next strong rally. As long as the price stays above the invalidation level at 1.30094 (the wave (y) bottom), the bullish scenario remains valid. This suggests that GBP/USD is preparing for a larger Wave 3 push to the upside.
Stay tuned!
@Money_Dictators
Thank you :)

Bank of Japan Policy Decision: Global Market Impact AnalysisBank of Japan Interest Rate Decision (December 19)
Introduction : Why Japan’s Interest Rate Policy Matters
Japan’s monetary policy plays a critical role in the global financial system. For decades, the Bank of Japan (BoJ) maintained ultra-loose conditions, turning the Japanese yen into the world’s primary funding currency. Global investors borrow cheaply in JPY and deploy capital into higher-yielding assets such as equities, bonds, and cryptocurrencies.
Because of this structure, even a small shift in BoJ policy can trigger large cross-market reactions. The BoJ’s interest rate decision on December 19 is therefore a high-impact macro event with potential consequences for forex, global equities, bonds, gold, and crypto markets.
Scenario 1: If the Bank of Japan Raises Interest Rates
A rate hike would represent a historic policy shift and signal the early stages of monetary normalization.
Impact on Forex (USD/JPY & JPY Pairs)
* The Japanese yen (JPY) is likely to strengthen due to improved yield appeal
* USD/JPY may face strong bearish pressure
* Carry trades funded in JPY could unwind rapidly, increasing volatility
JPY crosses such as EUR/JPY, GBP/JPY, and AUD/JPY may also decline as risk exposure is reduced.
Impact on Global Equity Markets
* Japanese equities: Mixed to bearish bias due to a stronger yen hurting exporters
* Asian markets: Short-term weakness as financial conditions tighten
* US & European equities: Increased volatility and pressure on growth stocks
Overall, a rate hike may trigger a short-term global risk-off reaction driven by liquidity repricing rather than economic deterioration.
Impact on Crypto Markets (Bitcoin & Altcoins)
* Bitcoin: Short-term bearish pressure and higher volatility
* Altcoins: Likely underperformance due to higher risk sensitivity
* Macro-driven selling could create longer-term accumulation zones once volatility settles
Impact on Bonds, Gold & Risk Sentiment
* Bonds: Japanese and global yields may rise
* Gold: Short-term pressure from higher yields, medium-term support if risk aversion increases
* Risk sentiment: Shift toward defensive positioning and reduced leverage
Scenario 2: If the Bank of Japan Does NOT Raise Interest Rates
If rates remain unchanged, markets may view the decision as continued policy caution.
Expected Market Reactions
* JPY: Continued weakness
* USD/JPY: Bullish continuation
* Global equities & crypto: Supported by ongoing liquidity
* Risk sentiment: Risk-on behaviour likely to persist
Short-Term vs Medium-Term Outlook
Short-Term
* Rate hike: Sharp volatility, risk-off moves
* No hike: Relief rally in risk assets
Medium-Term
* Gradual tightening allows controlled market adjustment
* Continued loose policy supports assets but increases structural risks over time
Markets typically shift from news reaction to trend confirmation within weeks.
Educational Entry–Exit Examples (Not Financial Advice)
USD/JPY (Rate Hike):
* Bias: Bearish
* Concept: Breakdown → pullback → continuation
* Invalidation: Above recent swing high
Bitcoin (No Hike):
* Bias: Bullish
* Concept: Pullback after impulse
* Risk Note: Reduced size during news volatility
US Indices:
* Rate hike: Sell rallies near resistance
* No hike: Buy dips in confirmed trend
Conclusion: Key Takeaways for Traders
The Bank of Japan’s December 19 interest rate decision is a major global liquidity event. A rate hike would favour the yen while pressuring risk assets, whereas a no-change policy would support equities, cryptocurrencies, and carry trades. Traders should prioritise volatility management, confirmation from price action, and cross-market correlations over predictions and forecasts.
Stay tuned!
@Money_Dictators
Thank you :)

XAUUSD H1 Trading with Volume Profile Ahead of CPI RiskXAUUSD H1 Trading with Volume Profile Ahead of CPI Risk
Gold is slowing down as the market awaits news and liquidity is fragmented, so prioritize trading according to Volume Profile zones to choose advantageous entry points instead of chasing prices.
PRIORITY SCENARIO
Strategy to buy at POC and VAL zones according to Volume Profile, suitable for a medium-term perspective.
Buy zone: 4314 – 4317
SL: 4307
TP: 4328 – 4345 – 4363 – 4370
Technical context:
On H1, the price is accumulating and reacting around the value area. The 4314–4317 area is the POC and VAL zone, often a liquidity attraction point and likely to see buying pressure if the structure maintains support.
Expected movement:
Price holds the 4314–4317 zone, absorbs short-term selling pressure, then rebounds to the above TP levels. When approaching 4345, monitor reactions as this is an area prone to selling pressure.
Position management:
If the price quickly rises but fails to hold above 4328, consider reducing risk. If the price clearly breaks below 4307, prioritize stopping the buy scenario and wait for a deeper zone.
ALTERNATIVE SCENARIO
Sell scalping strategy at short-term resistance zone, higher risk as the larger trend still favors buying.
Sell scalping zone: 4343 – 4346
SL: 4353
TP: 4325 – 4310 – 4290
Technical context:
The 4343–4346 area is a sell scalping zone on the chart, suitable for short-term trading when the price rebounds to resistance and clear rejection signals appear.
Note:
Sell should only be a scalping order. Do not prioritize holding long sell positions if the market is still in an accumulation phase awaiting news.
MAIN REASON
Volume Profile shows that POC and VAL zones are advantageous entry points during a sideways market lacking a clear trend.
The 4314–4317 zone acts as a value support area for finding buy points, while 4343–4346 is suitable for sell scalping when the price rebounds to resistance.
When the market awaits news, the likelihood of liquidity sweeps increases, so trading by zones will be more effective than chasing candles.
MACRO CONTEXT AND CPI DATA
The upcoming US CPI release during the North American session will be the main variable guiding Fed policy expectations, directly impacting USD and gold. Ahead of data risk, dovish expectations from the Fed are causing USD to lack strong upward momentum, but volatility may spike suddenly at the time of the news release, creating spikes and sweeping SL on both ends.
RISK MANAGEMENT AND MONITORING
Do not open orders when the price is between zones and has not reached the exact levels of 4314–4317 or 4343–4346.
Prioritize reducing volume before CPI or only maintain positions that are already profitable and manage tightly.
Focus on observing price reactions at POC VAL and sell scalping zones, as these are decisive points for short-term direction.

EUR/USD Decision PhaseEUR/USD Decision Phase
Recent candles indicate a slowdown in upside follow-through, implying that short-term positioning may be crowded. This pause does not immediately invalidate the broader constructive tone but introduces the risk of a corrective rotation as liquidity is rebalanced. The projected move on the chart highlights a scenario where price may seek efficiency before determining the next directional leg.
Overall conditions suggest the market is transitioning from expansion into evaluation. Continuation higher would require renewed participation, while failure to attract follow-through could lead to a deeper reset driven by profit-taking and short-term repricing. Patience is advised as the market reveals whether this phase resolves through continuation or corrective realignment.
Price action reflects a market that has recently expanded after a prolonged phase of balanced participation. The sequence of higher intraday pushes shows growing initiative from buyers, supported by repeated structure continuation and shallow pullbacks, suggesting confidence rather than urgency. Momentum has remained constructive, with price spending more time advancing than correcting, a sign of controlled accumulation rather than emotional buying.
Recent candles indicate a slowdown in upside follow-through, implying that short-term positioning may be crowded. This pause does not immediately invalidate the broader constructive tone but introduces the risk of a corrective rotation as liquidity is rebalanced. The projected move on the chart highlights a scenario where price may seek efficiency before determining the next directional leg.
Overall conditions suggest the market is transitioning from expansion into evaluation. Continuation higher would require renewed participation, while failure to attract follow-through could lead to a deeper reset driven by profit-taking and short-term repricing. Patience is advised as the market reveals whether this phase resolves through continuation or corrective realignment.

XAUUSD H1 Analysis Based on Volume ProfileXAUUSD H1 Analysis Based on Volume Profile
Gold is moving sideways and consolidating around the 4,300 USD/oz area. The short-term direction remains unconfirmed and requires clear reactions at key liquidity zones.
PRIORITY SCENARIO – MAIN SCENARIO
Medium-term trend-following buy strategy at price areas with Volume Profile advantage
Primary buy zone: around 4284 based on VAL
Technical context: this is the lower value area where buying interest is likely to appear as the market continues to consolidate
Price expectation: price holds above VAL, absorbs short-term selling pressure, and gradually rotates back toward the upper balance area
Position management:
If price reacts positively and H1 candles hold above the 4284 level, a medium-term bullish bias in line with the main trend can be maintained.
If price breaks clearly below VAL, caution is required and deeper reaction zones should be monitored.
ALTERNATIVE SCENARIO – SECONDARY SCENARIO
Deeper buy opportunity in the event of additional liquidity sweep
Alternative buy zone: around 4242, based on the VAH of the previous value area
Technical context: this area represents the upper value zone of the prior consolidation and may act as strong support during a deeper pullback
Price expectation: downside liquidity sweep followed by a recovery, restoring market balance
SELL SCENARIO – HIGH RISK
Sell positions should only be considered as short-term trades, not a primary strategy
Short-term sell zone: around 4378, based on the 2.618 Fibonacci extension
Note: sells should only be considered if clear price rejection signals appear. Avoid holding short positions for extended periods while the broader trend remains bullish.
KEY REASONS
On the H1 timeframe, price is consolidating, indicating the market needs additional liquidity before confirming the next directional move
Volume Profile clearly highlights high-probability trading zones, particularly VAL at 4284 and VAH at 4242
The 4378 level represents an extended resistance zone suitable for profit-taking or short-term countertrend sells
MACRO CONTEXT AND MARKET SENTIMENT
Gold continues to hold strong near the 4,300 USD/oz level, supported by expectations of continued monetary easing from the Federal Reserve and rising safe-haven demand.
Meanwhile, silver has faced short-term profit-taking pressure after reaching record highs, reflecting a more cautious market tone.
This week’s focus is on the US Nonfarm Payrolls report. Weak data may reinforce gold’s bullish trend, while strong data could trigger a short-term correction amid ongoing policy uncertainty within the Fed.
RISK MANAGEMENT AND MONITORING
Avoid trading while price remains in the middle of the consolidation range and away from key Volume Profile levels.
The medium-term buy strategy loses its edge if price breaks clearly below 4242 and fails to reclaim the level.
Closely monitor volatility around the Nonfarm release, as sharp spikes and liquidity sweeps are highly likely.

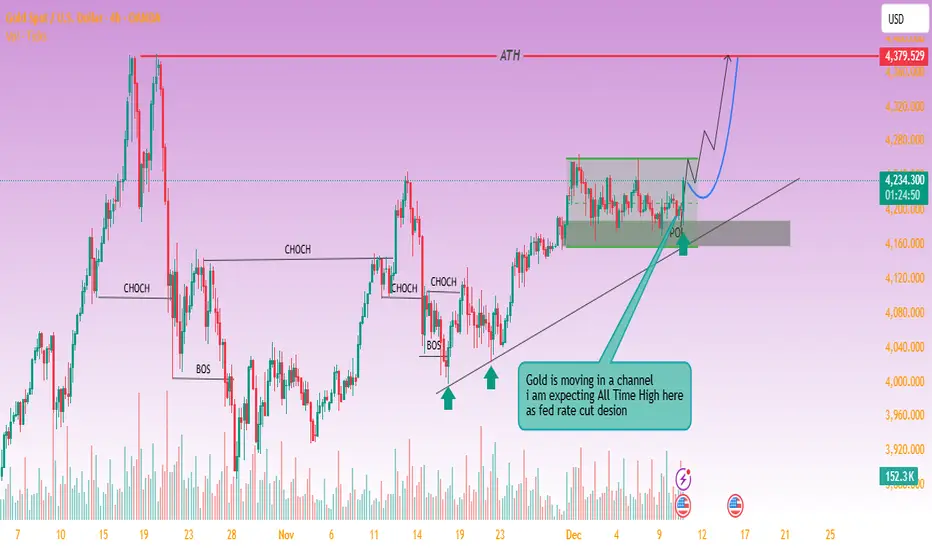
Gold Looks Prime for All-Time High Breakout📈 Technical Analysis of the Chart
The chart shows XAU/USD (Gold vs. USD) moving in what appears to be an upward-sloping channel — higher lows are marked by trend-line support.
Price recently revisited the lower boundary (support zone + trendline) and appears to have held firm — a bullish signal (i.e. a “retest & bounce”).
The annotation “POI” (Point of Interest) near that bounce suggests a probable pivot from support → initiating the next leg up.
On the upside, the chart projects a move toward a new all-time high (ATH) — the red horizontal line — implying a breakout of the current consolidation zone.
If gold breaks above current resistance and stays above the channel’s upper boundary, that increase could accelerate with bullish momentum. This aligns with typical breakout + retest strategies often used in gold trading.
Conversely, if price fails to hold this support zone and drops below the trendline, the bullish setup would be invalidated — a risk to watch, especially if sentiment shifts.
Technical conclusion: The chart shows a classic channel-retest setup — if upward momentum continues, a move toward the all-time high is well justified. The current bounce from support provides a favorable entry setup for bulls, with manageable risk if a stop-loss is set just below the channel support.
🌍 Fundamental & Macro Context
Gold’s recent strength is driven by expectations of lower interest rates: as a non-yielding asset, gold tends to benefit when rates fall because the opportunity cost of holding gold decreases.
A weaker U.S. dollar — often accompanying potential rate cuts — makes gold cheaper for foreign buyers, adding further demand support.
Broad economic context: unsteady global growth, geopolitical uncertainty, and rising demand for safe-haven assets help maintain strong gold demand.
Market forecasts remain bullish: some analysts see gold reaching as high as $4,950/oz by 2026, with a more likely base-case target around $4,500/oz — assuming rate cuts and continued macroeconomic uncertainty.
That said, the key risk remains in a potential rebound of the U.S. Dollar or abrupt shift in monetary policy (e.g. fewer rate cuts than expected) — either could undercut gold’s rally.
Fundamental conclusion: The macro backdrop — rate-cut expectations, weak USD, and global uncertainty — strongly supports a continuation of gold’s upward trajectory. If these tailwinds persist, gold’s push toward new highs is fundamentally justified.
✅ What This Setup Means & What to Watch
If bullish scenario plays out
Expect price to challenge the all-time high. A breakout may target or even exceed prior ATHs.
A bounce-and-run scenario may attract momentum traders, fueling further upside.
Key triggers to monitor
Keep an eye on announcements from Federal Reserve: rate-cut decisions or dovish signals accelerate gold demand.
Watch USD strength: a strong dollar could cap gains or reverse the uptrend.
Monitor global risk sentiment — geopolitical events or economic slowdown fears tend to push money into gold.
Risk control considerations
Use the channel support / trendline as a stop-loss anchor. A breakdown below could invalidate the bullish bias.
Consider that strong moves in the dollar or surprising inflation data might compress gold’s upside or spark a pullback.
Gold (XAU/USD) 30-Minute: Liquidity Grab Setup with Order Block1. Current Price Structure
Price is trending upward on the 30-min timeframe.
Recent candles show higher highs and higher lows, indicating short-term bullish pressure.
2. Liquidity Zone & Order Block
The grey shaded area marked as “liquidity + orderblock” is a confluence zone where stops and institutional orders are likely clustered.
Expect price to revisit this area for a shake-out of weak hands before moving higher.
The up arrow suggests that this zone could act as a launchpad for the next bullish leg.
3. Potential Pullback and Continuation
The scrawled black path shows a probable scenario:
Minor pullback to liquidity/order block area
Support test on the trendline or zone
Followed by a rejection and bullish continuation
4. Key Indicators
EMA 9 (blue) is below current price — supports short-term bullish momentum.
Ichimoku cloud is mostly supportive, with price above key lines (suggests trend stamina).
5. Resistance Ahead
The horizontal red zone near ~4,353 to 4,382 is a major supply area.
A breakout above this would confirm bullish continuation.
However, failure there could lead to deeper pullbacks.
🔥 Summary Bias
Bullish (higher probability setup)
Price is likely to:
Pull back to the support or order block area
Grab liquidity
Rally toward or above the resistance zone
🎯 Key Levels to Watch
Level Significance
~4,353 – 4,382 Major resistance / breakout target
Order Block Zone Liquidity grab & support
Trendline (rising) Dynamic support
EMA 9 Short-term support

Waiting for FVG / Liquidity Pullback, Trend-Following BUY Bias1. Market Context & Structure (H1)
• Gold has completed a liquidity sweep followed by a bullish BOS, confirming that the short-term uptrend remains intact.
• After the strong impulse, price is now entering a rebalancing / technical pullback phase rather than a reversal.
• The overall structure remains Higher High – Higher Low, favoring BUY strategies aligned with the dominant trend.
2. Key Technical Zones on the Chart
• Resistance / Supply Zone 1: 4,359 – 4,360
→ A previously strong reaction zone, where short-term corrections may occur.
• Resistance / Supply Zone 2: 4,394
→ Fibonacci 0.786 extension area, prone to profit-taking or upper liquidity sweeps.
• iFVG – Pullback Zone: 4,297 – 4,300
→ Inefficiency left during the bullish impulse, prioritized for the first BUY reaction.
• Liquidity Buy Zone: 4,267
→ Resting liquidity below, where a deeper sweep may occur before trend continuation.
3. Trading Scenarios – Captain Vincent Style
🔹 Primary Scenario – BUY at iFVG / Liquidity Buy (Preferred)
• Expect price to pull back from the 4,35x area toward 4,297 – 4,300 (iFVG) or deeper into 4,267 (Liquidity Buy).
• At the BUY zone, wait for confirmation signals:
– Strong rejection wicks
– Bullish engulfing
– Bullish ChoCH on M15–H1
• Preferred BUY Zones:
– BUY 1: 4,297 – 4,300
– BUY 2 (deeper): 4,267
• Targets:
– TP1: 4,359
– TP2: 4,394
– TP3 extension: continuation if 4,394 is broken.
• Invalidation:
– H1 close below 4,255 → short-term bullish structure weakens.
🔹 Secondary Scenario – Short-Term SELL Reaction at Supply
• If price rallies directly into 4,359 – 4,394 without a clear pullback, a short-term SELL reaction may appear.
• SELLs are scalp / counter-trend only, not the primary scenario.
• SELL target: pullback toward iFVG 4,297.
4. Risk & Management Notes
• Avoid FOMO BUY at high resistance zones.
• Prioritize BUY entries at discounted areas (FVG – Liquidity).
• Main bias remains BUY on pullbacks; SELLs are only technical reactions.
• Adjust position sizing carefully as the market is in an expansion phase.

Gold Weekly Trend: XAU/USD Ready to SurgeGold Weekly Trend: XAU/USD Ready to Surge
Gold closes the week with a steady bullish profile, maintaining a structure that reflects strong positioning from larger market participants. The weekly flow shows a market that continues to rotate upward through liquidity pockets while holding firm during corrective phases.
This week’s behavior indicates that buyers remain active on every controlled retracement, keeping the overall structure balanced and directional. The price continues to move in a sequence of expansion → stabilisation → renewed expansion, which is a common pattern when the market is preparing for sustained upside development.
Underlying order flow suggests that Gold is still within a broad accumulation cycle at higher levels, where the market repeatedly absorbs sell-side attempts and transitions back into bullish pressure. The consistency of this pattern signals confidence from long-term participants and reduces the probability of a structural shift at this stage.
As the week closes, the overall environment remains favorable for continued appreciation. Price is advancing in a measured, orderly fashion rather than showing signs of exhaustion. This steady progression typically precedes multi-week continuation phases, especially when liquidity objectives remain active above current trading levels.

Bullish BOS Breakout, Watching Reaction at OB & Sell-Side Liquid◆ Market Context (H2)
Price has just broken a bullish BOS and closed above the previous equilibrium zone, confirming buyers are in control. After the strong impulse, the market has entered a rebalancing phase, where a short-term pullback often appears before continuation or a liquidity sweep to the upside.
◆ SMC & Price Action
• Bullish structure confirmed by consecutive BOS following the prior CHoCH.
• The 4,274 OB is the nearest demand zone where buyers previously reacted.
• Above lies sell-side liquidity at 4,355, with a further extension toward 4,408 — a potential distribution or short-term reversal zone.
• Price is currently in premium, so patience is preferred over FOMO entries.
◆ Key Levels
• Resistance / Liquidity: 4,355 → 4,408
• Support OB: 4,274
• Deeper OB: 4,217
◆ Trading Scenarios
➤ Scenario A – Pullback BUY (Primary)
• Wait for a pullback into OB 4,274
• Conditions: structure holds (no break of recent lows), bullish reaction appears
• Targets:
▪ 4,319
▪ 4,355 (Liquidity Sell)
▪ Extension: 4,408
➤ Scenario B – Break & Continue
• If price holds above 4,319 with bullish closes
• Monitor reactions at 4,355 for partial profit-taking
• Avoid chasing price in premium zones
➤ Scenario C – Deeper Pullback
• If OB 4,274 is clearly broken
• Price may retrace to OB 4,217 for re-accumulation
• Only consider BUY after a fresh bullish CHoCH
◆ Summary
• Primary trend: Bullish (BOS confirmed)
• Priority: Buy pullbacks, avoid FOMO
• Key decision zone: OB 4,274
• Upside liquidity targets: 4,355 → 4,408

XAU/USD : Buy at OB 4,19x – 4,18x, Targets 4,24x → 4,26x 1. Market Structure (H1)
Gold is retracing back into bullish structure after breaking a series of bullish ChoCH and BoS, forming a new high around 4,24x. The current decline is only a technical pullback because:
• Price is returning to the Buy Order Block at 4,188 – 4,196.
• This zone aligns with trendline support and the demand base that fueled the previous impulse.
• The macro structure remains bullish as long as H1 does not close below 4,188.
→ This is a clear pullback–continuation setup: wait for price to retrace into discount, then target higher zones.
2. Key Levels
🔹 Demand Zone (Buy Zone): 4,188 – 4,196
• Bullish OB
• Trendline support
• Priority BUY area
🔹 Resistance 1: 4,217 – 4,218
• Multiple rejections
• Breakout → next bullish leg
🔹 Resistance 2: 4,238 – 4,239
• 0.5–0.618 Fibo confluence
• Possible mild sell reaction
🔹 Liquidity & Targets:
• 4,259 → Fibo 1.272
• 4,278 → Fibo 1.618 + resting liquidity
3. Trading Plan
🔸 Main Scenario – BUY at OB 4,19x – 4,18x
Conditions:
• Price taps 4,188 – 4,196
• Reversal signals: pin bar, engulfing, or bullish ChoCH
Targets:
TP1: 4,217
TP2: 4,238
TP3: 4,259
TP4: 4,278
Invalidation:
• H1 close below 4,185 → stay out.
🔸 Alternate Scenario – Price goes up without retesting OB
If price holds above 4,210 and breaks 4,217:
• Wait for retest of 4,217
• BUY continuation toward 4,238 → 4,259 → 4,278
Market Outlook
Gold is accumulating and building a base for a stronger breakout. The OB Buy zone 4,19x – 4,18x remains the highest-probability reversal area.
