XAU/USD – Gold Forms New Liquidity Low, Buyers Return🔍 Market Context
Gold has completed a significant liquidity sweep around the 3,929 – 3,921 USD zone, clearing out the stop-losses of weak buyers before bouncing back strongly.
The bullish candle reaction at this zone indicates strong absorption from large capital flows, opening the possibility of forming a technical recovery wave towards the supply zone (OB – FVG) above.
In the short term, the market structure temporarily shifts to a bullish bias , as long as the price holds above this Liquidity Zone.
💎 Key Technical Zones
• Liquidity Sweep Zone: 3,929 – 3,921 USD → newly swept liquidity low, acting as main support.
• FVG 1: 3,951 – 3,959 USD → first target of the recovery wave.
• FVG 2: 3,977 – 3,985 USD → unfilled price balance zone.
• Order Block: 3,995 – 4,022 USD → strong supply resistance, expected reaction upon retest.
• Resistance Zone: 4,025 – 4,045 USD → watch for candle reactions to confirm upward momentum or reversal.
🎯 Trading Scenarios
1️⃣ BUY Setup – Liquidity Sweep Retest
• Entry: 3,932 – 3,922 USD (pullback to sweep zone)
• Stop Loss: below 3,912 USD
• Take Profit:
TP1: 3,965
TP2: 3,975
TP3: 3,987
TP4: 3,995
TP5: 4,022
➡️ “Buy the discount” strategy by Smart Money: buy after liquidity sweep to catch the technical rebound.
2️⃣ SELL Reaction – OB 4,022 USD
If the price approaches the OB 3,995 – 4,022 USD zone and shows reversal signals (strong rejection, bearish engulfing candle),
→ consider opening a short-term sell (counter-trend scalp)
• Entry: 4,015 – 4,020
• SL: 4,030
• TP: 3,990 → 3,970 → 3,940
⚙️ Market Structure
• Temporary uptrend line remains intact.
• Liquidity has been swept at the old low → confirming bullish ChoCH .
• Confluence structure of FVG + OB + trendline creates favorable conditions for recovery momentum.
📈 Summary
Gold has completed the old low liquidity sweep and is in a technical recovery phase.
As long as the price stays above 3,921 USD, the short-term trend leans towards bullish retracement .
Observe price reactions at the FVG 3,975 – 3,995 USD zone to determine buyer strength.
🔥 “Liquidity fuels direction — once the weak hands are out, the real move begins.”
⏰ Timeframe: 1H
📅 Updated: 05/11/2025
✍️ Analysis by: Captain Vincent
Forexsignals

Accumulated Gold on Support, 3,952 USD is the Gateway for a New 🔍 Market Context
Gold is oscillating within a symmetrical triangle pattern , reflecting price compression and waiting for a breakout signal.
Buyers still maintain a short-term bullish structure, but the series of lower highs indicates increasing selling pressure.
The zone 3,959–3,964 USD is currently the “balance point” — if this area is breached, the downtrend may extend to the lower liquidity zone around 3,929–3,921 USD .
💎 Key Technical Zones
• Resistance Zone: 4,020 – 4,040 USD → the main resistance of the triangle, where strong reactions are likely.
• Support Zone: 3,959 – 3,964 USD → the support zone maintaining the bullish structure.
• Liquidity Zone: 3,929 – 3,921 USD → a low liquidity zone, potentially attracting price sweeps before reversing.
🎯 Trading Scenarios
1️⃣ BUY Setup – Preferred when price holds above support
• Entry: 3,959 – 3,964 USD
• Stop Loss: 3,940 USD
• Take Profit:
– TP1: 3,985
– TP2: 4,020
– TP3: 4,040
– TP4: 4,096
✳️ “Buy the discount” – Buy at the trendline support zone when a confirmation signal appears (rejection or bullish ChoCH).
2️⃣ SELL Setup – Scenario if support breaks
• Entry: 3,950 – 3,955 USD (after closing a candle below the support zone)
• Stop Loss: 3,970 USD
• Take Profit:
– TP1: 3,935
– TP2: 3,925
– TP3: 3,912
✳️ “Sell the breakdown” – Sell when support is clearly breached, targeting the lowest liquidity zone (3,912 USD).
💬 Summary
Gold is in a phase of accumulation before a major move .
If it holds above 3,952 USD → prioritize BUY according to the bullish structure .
If it breaks below 3,952 USD → SELL according to the breakout towards the Liquidity Zone.
The scenario will be clearly confirmed when the current symmetrical triangle is broken.
💡 Today's Tagline:
“Liquidity defines direction — follow where the money hides.”
⏰ Timeframe: 1H
📅 Update: 04/11/2025
✍️ Analysis by: Captain Vincent

XAU/USD – Gold Accumulating Before Breakout, Target 4,096 USD🔍 Market Context
Gold is trading within a symmetrical triangle pattern , indicating short-term accumulation before forming a new breakout wave.
Following a sharp decline from the peak region of 4,096 USD, the market has shown two instances of Change of Character (ChoCH) – early signs of buying pressure returning.
As long as the price holds above the 3,959 – 3,917 USD zone, the short-term bullish structure remains intact. This support zone acts as a crucial “discount zone” in the current accumulation cycle.
💎 Key Technical Zones
• Support Zone 1: 3,959 USD → main structure holding zone, coinciding with the lower trendline.
• Support Zone 2: 3,917 USD → final liquidity reaction zone.
• Resistance Zone: 4,040 USD → potential break & retest zone.
• Liquidity Zone: 4,096 USD → expansion target if the peak is breached.
🎯 Trading Scenarios
1️⃣ BUY Setup – Prioritise bullish structure
• Entry: 3,959 – 3,917 USD
• Stop Loss: 3,905 USD
• Take Profit:
– TP1: 3,985
– TP2: 4,040
– TP3: 4,072
– TP4: 4,096
✳️ “Buy the discount” – prioritise buy orders at the confluence support zone of trendline + FVG to follow the SMC flow.
2️⃣ SELL Scalp – Secondary strategy when price reacts at the peak
• Entry: 4,096 USD
• Stop Loss: 4,108 USD
• Take Profit:
– TP1: 4,072
– TP2: 4,040
– TP3: 3,985
✳️ “Sell the premium” – only activate if there is a strong price rejection signal at the liquidity peak.
💬 Summary
The short-term trend of gold remains bullish as the price stays above the trendline and continuously forms higher lows.
The main strategy is buy the dip – sell reaction around the 3,959 → 4,096 USD zone.
The confirmation of a strong uptrend will be when the price closes steadily above 4,040 USD .
“Smart money accumulates in silence before the market makes noise.”
⏰ Time Frame: 1H
📅 Update: 03/11/2025
✍️ Analysis by: Captain Vincent

XAU/USD – Gold Maintains Short-Term Uptrend, Target $4,108🔍 Market Context
Gold continues to uphold a short-term uptrend structure after forming a clear Change of Character (ChoCH) around the 3,926 USD zone.
Buyers are in control as prices consistently create higher lows and react positively at the Order Block + Supporting Trendline zone.
As long as prices remain above the 3,940–3,926 USD area, the uptrend structure is preserved.
💎 Key Technical Zones
• Order Block Bullish: 3,926 USD → main support zone, confluence with rising trendline.
• Fair Value Gap (FVG): 3,942 – 3,972 USD → potential liquidity absorption zone.
• Resistance Zone: 4,032 USD → short-term resistance, needs to be broken to confirm continued uptrend.
• Liquidity Zone: 4,108 USD → expansion target if the above resistance is breached.
🎯 Trading Scenarios
1️⃣ BUY Setup – Prioritise catching the retracement from support zone
• Entry: 3,942 – 3,926 USD
• Stop Loss: 3,910 USD
• Take Profit:
– TP1: 3,972
– TP2: 4,032
– TP3: 4,064
– TP4: 4,108
✳️ “Buy the discount” – Prioritise orders in the confluence zone of OB + FVG to follow Smart Money flow.
2️⃣ SELL Scalp – Short-term at resistance zone
• Entry: 4,032 – 4,048 USD
• Stop Loss: 4,060 USD
• Take Profit:
– TP1: 4,010
– TP2: 3,972
– TP3: 3,942
✳️ “Sell the premium” – Activate only if clear price rejection signals appear at resistance.
💬 Summary
The current structure still leans towards bullish short-term with the 3,926 USD zone as the key invalidation zone .
As long as prices stay above the trendline, the immediate target is the 4,108 USD liquidity zone.
Optimal strategy: Buy on dip – Sell on reaction.
“Smart Money buys fear, sells greed — follow the footprints, not the noise.”
⏰ Timeframe: 1H
📅 Update: 31/10/2025
✍️ Analysis by: Captain Vincent

XAU/USD – Gold in Equilibrium Zone: Sell Opportunities Around...🔍 Market Context
Gold is currently consolidating within a triangle structure , showing short-term accumulation before a potential breakout.
Buyers are trying to maintain a minor bullish structure, but the series of lower highs indicates that sellers still hold the upper hand.
At the moment, price is reacting within the FVG 3,942–3,979 USD area, staying below the descending trendline.
If this zone fails to break, selling pressure may return.
💎 Key Technical Levels
• Bearish Order Block: 4,022 USD → main supply zone, aligning with the descending trendline.
• FVG Zone 1: 3,979 USD → short-term liquidity test area.
• FVG Zone 2: 3,942 USD → potential retracement zone before further downside.
• Bullish Order Block: 3,882 USD → key support aligning with long-term bullish trendline.
• Liquidity Zone: 3,789 USD → extended target if main support breaks.
🎯 Trading Scenarios
1️⃣ Sell Setup – Reaction from Resistance Zone
• Entry: 4,012 – 4,022 USD
• Stop Loss: 4,035 USD
• Take Profit:
– TP1: 3,979
– TP2: 3,942
– TP3: 3,900
– TP4: 3,882
– TP5: 3,789
✳️ “Sell the premium” – utilise supply and FVG reactions following Smart Money flow.
2️⃣ Buy Setup – Reaction from Demand Zone
• Entry: 3,882 USD
• Stop Loss: 3,865 USD
• Take Profit:
– TP1: 3,910
– TP2: 3,942
– TP3: 3,979
– TP4: 4,012
– TP5: 4,022
✳️ “Buy the discount” – valid when strong absorption or reversal signal forms near the lower OB.
💬 Summary
Current structure remains short-term bearish , yet the market is balanced.
The most efficient approach is to sell near premium zones (4,022) and buy back near discount (3,882) .
Expected range in the next 24–48 hours: 3,880–4,020 USD .
💡 Tagline:
“Trade where institutions act — not where retail reacts.”
⏰ Timeframe: 1H
📅 Updated: 30/10/2025
✍️ Analysis by: Captain Vincent

Gold Rebounds Toward OB, but Deeper Correction May Follow🔍 Market Context
After forming a Change of Character (ChoCH) and a clear Break of Structure (BoS) to the downside, gold dropped sharply from 4,080–4,100 USD, confirming a shift from bullish to bearish structure.
Price is now making a technical rebound, forming Lower Highs toward the Order Block 4,012 USD — aligning with a small Fair Value Gap (FVG) , suggesting new selling pressure may emerge.
This rebound is seen as a “pullback retest supply” within a completed bearish setup.
If the 4,012 USD supply zone reacts strongly, price may extend its drop toward lower liquidity pools.
💎 Key Technical Structure
BoS (bearish): confirms a break below prior bullish structure.
Order Block (OB): 4,010–4,020 USD → main supply area confluencing with FVG.
FVG zone: 3,985–4,010 USD → technical retracement zone.
Supply Zone: 3,891–3,895 USD → temporary support, may be swept.
Liquidity Zone: 3,850–3,860 USD → key liquidity target.
📈 Trading Scenarios
1️⃣ SELL Setup – Retest OB 4,010–4,020 USD
Entry: 4,010 – 4,020
SL: 4,035
Take Profit: 3,985 - 3,965 - 3,945 - 3,915 - 3,890/Open
✅ Condition:
Wait for price to retest FVG–OB with clear bearish confirmation (strong rejection, bearish engulfing, or minor ChoCH on M15).
➡️ Trend-follow setup – sell after price retests supply zone.
2️⃣ BUY Setup – Reversal at Liquidity Zone 3,850 USD
Entry: 3,850 – 3,860
SL: 3,830
TP1: 3,870 - 3,885 - 3,900 - 3,920 - 3,940/Open
✅ Condition:
Wait for strong absorption or bullish reversal signal (long-tail rejection or bullish ChoCH on M15–H1).
➡️ Counter-trend scalp setup for reversal traders.
⚠️ Risk Management
Prioritise SELLs below 4,035 USD.
BUYs only valid with confirmation at Liquidity Zone.
Avoid mid-range trading (3,920–3,970) to reduce noise.
💬 Conclusion
Gold remains in a bearish trend after breaking prior bullish structure.
As long as price stays below 4,035 USD , downside momentum prevails.
Next major target: 3,891 – 3,851 USD .
👉 Strategic Plan:
Sell 4,010–4,020 | SL 4,035 | TP 3,985 → 3,890 🎯
Buy 3,850–3,860 | SL 3,830 | TP 3,870 → 3,940 🎯
💎 Price never lies — liquidity always reveals the truth.
⏰ Timeframe: 1H
📅 Updated: 29/10/2025
✍️ Analysis by: Captain Vincent

GBP/USD Correction Almost Done: Bulls LoadingGBP/USD has already completed a big corrective structure from the previous high and is now moving inside a complex W-X-Y pattern. The current drop is forming the final C-wave of Wave Y, which suggests the bearish move is close to finishing. Price is likely to dip slightly lower near the support zone before finding buyers again. Once this final leg completes, the chart expects a strong bullish reversal to the upside. In simple terms, one more small drop to finish the correction, then GBP/USD should bounce and start a new uptrend.
Stay tuned!
@Money_Dictators
Thank you :)

Gold (XAU/USD) 4H Chart Analysis – Short-Term Reversal from ?Technical Overview:
Gold has recently rebounded from a High Demand Zone around the $3,900–$3,910 region, showing clear signs of buyer re-entry after a prolonged bearish correction. The candle structure suggests strong bullish intent, with higher lows forming and a potential continuation toward the next liquidity area.
Key Observations:
🔹 High Demand Zone: Price reacted strongly here, indicating institutional buying pressure.
🔹 High Prop POI (Point of Interest): Served as a key accumulation level before the breakout.
🔹 SMC Trap: Indicates a prior liquidity grab, trapping late sellers before the move up.
🔹 Bullish Momentum Building: Consecutive bullish candles after rejection from the demand zone strengthen the reversal bias.
Target Projection:
🎯 Immediate Target: $4,080 – $4,100 (aligned with local resistance and liquidity grab zone).
🛑 Support: $3,905 (must hold to maintain bullish structure).
💎 Extended Target (if momentum continues): $4,160 – $4,180 (previous major swing high zone).
Summary:
Gold is showing a short-term recovery phase within a broader bullish structure. A confirmed 4H close above $4,030 would likely propel price toward the $4,100 region, while a drop below $3,900 would invalidate the bullish setup.
📊 Suggested Title:
"Gold Rebounds from Key Demand Zone, Eyes $4,100 Resistance 🔥"

XAUUSD | Gold to drop 2000PIPS, where is the best sell zone?🔍 Market Context
After breaking the medium-term upward structure at the main Trendline , gold has formed a distinct series of Lower High – Equal Low (EqL) , indicating a phase shift from bullish to bearish.
Currently, the price is fluctuating around the 3,960–3,970 USD zone – this is a temporary liquidity accumulation area before moving up to retest the resistance at 4,015–4,050 USD , which was previously a Demand Zone now turned into Supply Zone .
If a strong bearish reaction occurs here, the price is likely to extend its decline towards the Order Block 3,945–3,960 USD zone, or even deeper to the Premium Zone 3,884 USD .
💎 Key Technical Structure
Main Trendline: broken, confirming a structural change (ChoCH).
Resistance Zone: 4,010–4,015 → quick reaction resistance.
Supply Zone: 4,043–4,060 → strong technical retracement zone.
Premium Zone: 3,884–3,900 → discount zone, potential temporary bottom.
📈 Trading Scenarios
1️⃣ SELL Zone 1 – Scalp Reaction at Resistance Zone
Entry: 4,010 – 4,015
SL: 4,025
Take Profit : 4,005 - 3,995 - 3,975 - 3,965 - Open
➡️ Quick scalp reaction at nearby resistance – suitable for trading during London/NY sessions.
2️⃣ SELL Zone 2 – Major Retest at Supply Zone
Entry: 4,043 – 4,060
SL: 4,065
Take Profit : 4,050 - 4,040 - 4,030 - 4,020 - 4,010/Open
➡️ Main setup – retest of confluence supply zone with broken trendline, high probability if strong rejection on H1/H4.
3️⃣ SELL Continuation – Break & Retest below 3,945 USD
Entry: 3,945 – 3,950
SL: 3,965
TP: 3,884
➡️ Setup breaks EqL bottom confirming continuation of downtrend, targeting Premium Zone.
4️⃣ BUY Setup – Reversal at Premium Zone 3,900 USD
Entry: 3,900
SL: 3,880
TP1: 3,910 - 3,920 - 3,930 - 3,940 - 3,950/Open
✅ Condition:
Only buy when a strong reaction candle appears (long-tail rejection / ChoCH bullish on M15–H1).
➡️ This is the final discount zone before major capital can return to the market – technical reversal setup, low risk / high reward.
⚠️ Risk Management
Prioritise SELL at supply zones, BUY at Premium – avoid trading in the middle of the range.
Reduce volume on scalp setups (Sell 1).
If price closes above 4,070 → short-term downtrend is invalidated.
💬 Conclusion
Gold is still under short-term bearish pressure, however, the 3,884–3,900 USD zone may serve as strong support.
The appropriate strategy is to utilise the two resistance zones for Selling and observe technical Buying at the Premium bottom.
👉 Comprehensive Strategy:
Sell 4,010–4,015 | SL 4,025 | TP 4,005 → 3,965 🎯
Sell 4,043–4,060 | SL 4,065 | TP 4,050 → 4,010 🎯
Buy 3,900 | SL 3,880 | TP 3,910 → 3,950 🎯
🔥 “Trade with patience, react at precision zones — that’s how consistency is built.”
⏰ Timeframe: 1H
📅 Update: 28/10/2025
✍️ Analysis by: Captain Vincent

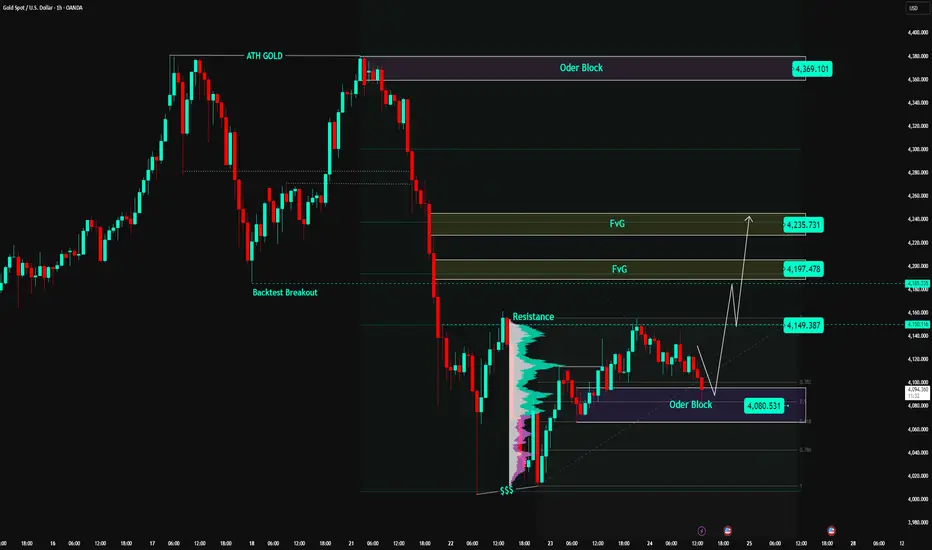
Plan |Gold Gradually Accumulating, Ready for a Rebound Wave?🔍 Market Context
After reaching the historical peak ATH GOLD 4,371 USD , gold underwent a deep correction, breaking the short-term bullish structure (BoS) and retesting the OB Bearish zone above .
However, since the price returned to the 4,040 – 4,060 USD area, the market has clearly shown signs of liquidity absorption ($$$) and maintained an internal uptrend line, indicating that buying momentum is returning.
The current structure suggests gold is in a re-accumulation phase before forming a medium-term rebound wave towards the 4,185 → 4,243 USD zone.
The buyers hold the advantage as long as the price does not break the main support trendline.
💎 Key Technical Structure
Support Zone: 4,040 – 4,060 USD → a strong support zone confluencing with the trendline, where institutional buying forces have appeared.
Support Trendline: connecting the series of higher lows from 15/10 → the short-term trend remains bullish.
Liquidity Zone $$$: 4,060 – 4,080 → supply absorption zone, confirming its role as a “price base”.
Resistance Zone: 4,149 – 4,185 → the first resistance zone to break to confirm the recovery momentum.
Target FVG / Supply Zone: 4,243 – 4,250 → potential profit-taking zone or point to consider reversal.
Current structure:
→ Short-term: bullish corrective move.
→ Medium-term: potential for forming an extended recovery wave if it holds above 4,040 USD.
📈 Trading Scenarios
1️⃣ BUY Setup – Retest Trendline / Liquidity Zone 4,060 USD
Entry: 4,060 – 4,070
SL: 4,035
TP1: 4,149
TP2: 4,185
TP3: 4,243
✅ Condition:
Price touches the trendline or liquidity zone 4,060 and shows a bullish reversal signal (rejection / bullish engulfing).
➡️ This is a high-probability setup, confluencing the trendline structure + liquidity support zone, often where large buyers re-enter the market.
2️⃣ BUY Setup – Break & Retest resistance zone 4,149 USD
Entry: 4,149 – 4,155
SL: 4,130
TP1: 4,185
TP2: 4,243
✅ Condition:
Wait for the price to break the resistance zone 4,149 with strong volume, then lightly retest without closing the candle below 4,130.
➡️ Trend-following setup – confirms the return of buying momentum and extends the target to the FVG zone 4,243 USD.
3️⃣ SELL Setup (Scalp Reaction) – FVG 4,243 USD
Entry: 4,240 – 4,245
SL: 4,255
TP: 4,185 → 4,150
✅ Condition:
Only execute if there is a strong reaction at FVG 4,243 without a continuation break signal.
➡️ Short-term technical sell – exploiting the supply zone reaction, do not hold the position long.
⚠️ Risk Management
Prioritise trading in the buy direction, avoid selling against the main trend.
If H2 closes the candle below 4,035 → bullish scenario invalid, wait for a new structure.
Do not FOMO buy in the middle range (4,090–4,130).
Keep moderate volume, move SL to breakeven when the price exceeds 4,149.
💬 Conclusion
Gold is in an ascending re-accumulation phase after a strong decline.
As long as the price holds the trendline and support zone 4,040 – 4,060 USD, there is a high chance gold will rebound following the liquidity + breakout retest model, with the main target being 4,185 → 4,243 USD .
If it breaks through 4,243 USD, the market may trigger a stronger recovery momentum towards 4,300 – 4,340 USD .
👉 Reasonable Strategy:
Buy 4,060–4,070 → TP 4,185 / 4,243 USD
Add Buy when breaking 4,149 USD with volume confirmation.
Technical Sell 4,243 USD if there is no signal to break higher.
🔥 “As long as 4,040 holds, gold remains in accumulation — patience will pay.”
⏰ Timeframe: 2H
📅 Update: 27/10/2025
✍️ Analysis by: Captain Vincent

Gold Maintains Re-Accumulation Above OB, Wave Recovery Target🔍 Market Context
After a sharp decline from the ATH GOLD 4,371 USD peak, gold has completed a liquidity sweep around the 4,010 USD bottom and formed a stable accumulation zone above the Order Block 4,080 USD .
The buyers are gradually regaining control as the price holds firm at the OB and shows signs of short-term supply absorption.
The Resistance 4,149 USD zone is currently a temporary barrier; if successfully breached – gold could trigger a recovery wave towards the Fair Value Gap (FVG) zones at 4,197 and 4,235 USD.
The current price structure leans towards a bullish retracement structure – prioritising buy orders when the price reacts from the active demand zone.
💎 Key Technical Structure
Order Block (OB): 4,080 – 4,085 USD → crucial support zone, confluence with Fibo 0.786, serving as an accumulation base.
Resistance (Breakout Level): 4,149 USD → confirmation zone for upward direction, requires decisive breakout.
FVG1: 4,197 – 4,210 USD → first target, short-term supply test zone.
FVG2: 4,225 – 4,235 USD → confluence resistance zone, potential profit-taking for recovery wave.
ATH GOLD: 4,371 USD → long-term resistance, expanded target if the market maintains strong buying flow.
Overall Structure:
→ Short-term: bullish recovery.
→ Medium-term: re-accumulation after a deep correction phase.
📈 Trading Scenarios
1️⃣ BUY Setup #1 – Retest Order Block 4,080 USD
Entry: 4,080 – 4,085
SL: 4,060
TP1: 4,149
TP2: 4,197
TP3: 4,235
✅ Condition:
Wait for the price to retrace to the OB zone and show clear bullish reversal signals (rejection or bullish engulfing).
➡️ This is a classic “Buy the Dip” setup – aligning with the recovery structure, with high probability due to OB + strong Fibonacci confluence.
2️⃣ BUY Setup #2 – Break & Retest zone 4,149 USD
Entry: 4,149 – 4,155
SL: 4,130
TP1: 4,197
TP2: 4,235
✅ Condition:
Price breaks through the 4,149 resistance zone with good volume and lightly retests, without closing candles below 4,130.
➡️ Trend-following setup, aligning with the flow when the market confirms a short-term resistance break.
3️⃣ SELL Scalp – Reaction at FVG 4,235 USD (short-term)
Entry: 4,230 – 4,235
SL: 4,245
TP: 4,197 → 4,150
✅ Condition:
If gold reacts weakly and there is no follow-up buy at the FVG2 zone → a short-term technical sell can be considered on pullback.
➡️ Short-term sell – only execute if there is no confirmation of continued upward movement.
⚠️ Risk Management
Prioritise BUY according to the main structure (retracement bullish).
Do not FOMO buy within the zone (4,110 – 4,130).
If H1 closes candles below 4,060 → invalidates the bullish scenario, wait for structure reconstruction.
Maintain moderate order size when trading around the FVG zone to avoid noise.
💬 Conclusion
Gold is in the process of re-accumulation and preparing for a technical recovery phase.
As long as the price holds the Order Block 4,080 USD zone, the recovery structure remains valid, and the feasible target is 4,197 → 4,235 USD .
If it breaks through 4,235 USD, the market could extend the rally towards the 4,300 – 4,370 USD (ATH GOLD) zone.
👉 Reasonable Strategy:
Buy 4,080 → TP 4,197 / 4,235.
Buy more when 4,149 break confirms upward direction.
Sell short reaction at 4,235 if there is no signal of continued break.
🔥 “Patience at the base — profits come to those who wait for the OB reaction.”
⏰ Timeframe: 1H
📅 Update: 24/10/2025
✍️ Analysis by: Captain Vincent
XAU/USD – Gold Completes Liquidity Sweep Phase🔍 Market Context
After a prolonged decline from the peak ATH GOLD 4,371 USD , gold has formed a Liquidity Sweep around the 4,010 USD zone, where the selling side was completely absorbed by strong buying pressure from the demand zone below.
The price structure shows signs of a Change of Character (ChoCH) for the first time since the peak, along with the appearance of an Order Block (OB) 4,081 USD – the starting point for a new upward momentum.
This indicates a high possibility that the market is entering a technical retracement phase , aiming to retest the FVG resistance zone above, or even expand back to the ATH zone if buying pressure continues.
💎 Key Technical Structure
Liquidity Sweep: 4,010 – 4,020 USD → liquidity sweep bottom zone, increased volume appears, confirming absorption of sell orders.
Order Block (OB): 4,081 – 4,090 USD → starting zone for recovery momentum; if the price retests this zone and holds → confirmation signal for an upward phase.
Fair Value Gaps (FVG):
• FVG1: 4,196 – 4,210 USD → first target for the recovery wave.
• FVG2: 4,234 – 4,250 USD → next target, confluence of medium-term resistance.
OB | ATH GOLD: 4,370 – 4,380 USD → major resistance zone, previous peak; if the price surpasses → confirmation of a new upward trend.
Current market structure:
→ Short-term: bullish recovery (recovering from the bottom zone).
→ Medium-term: waiting for confirmation to break 4,234 to transition to a complete bullish structure.
📈 Trading Scenarios
1️⃣ BUY Setup #1 – Retest the Order Block 4,081 USD
Entry: 4,081 – 4,085
SL: 4,060
TP1: 4,196
TP2: 4,234
TP3: 4,370
✅ Conditions:
Wait for the price to retest the OB 4,081 zone, a confirmation signal for an increase appears (rejection / engulfing bullish) or a small BoS on M15.
➡️ This is a classic buy-the-dip setup after a Liquidity Sweep – high probability due to the confluence of OB + ChoCH + strong demand zone.
2️⃣ BUY Setup #2 – Break & Retest FVG 4,196 USD
Entry: 4,196 – 4,200
SL: 4,180
TP: 4,234 → 4,370
✅ Conditions:
The price breaks up the first FVG with good volume, then lightly retests without closing candles below 4,180.
➡️ Trend-following setup, following the money flow when the price confirms breaking the short-term resistance zone.
📉 Alternative Scenario – SELL reaction at 4,234 USD (Short-term Scalp)
Entry: 4,234 – 4,240
SL: 4,255
TP: 4,196 → 4,100
✅ Conditions:
If the price reacts strongly and fails at the second FVG without follow-up volume increase → a short adjustment phase may appear.
➡️ Short-term sell, only execute if there is no continuation confirmation at FVG2.
⚠️ Risk Management
Prioritise BUY according to the main recovery trend, only SELL when there is a clear reaction.
Do not FOMO buy in the middle range (4,130–4,180).
If the price closes H1 candles below 4,060 → invalidate the recovery trend, pause all buy orders.
💬 Conclusion
Gold has completed the Liquidity Sweep phase and is signaling a sustainable technical reversal .
Two important zones to monitor:
4,081 USD (OB Zone): first rebound support zone.
4,234 USD (FVG Zone): zone confirming a new upward structure.
If the price holds OB and breaks through FVG, there is a high chance gold will resume its upward momentum towards the 4,370 USD (ATH GOLD) zone.
👉 Reasonable Strategy:
Buy 4,081 USD → TP 4,234 / 4,370 USD.
Sell reaction 4,234 USD only when a clear reversal signal appears.
🔥 “Liquidity has been swept — now it’s time to ride the recovery wave.”
⏰ Timeframe: 1H
📅 Updated: 23/10/2025
✍️ Analysis by: Captain Vincent

XAU/USD – Gold Tests Final Structure Before Deciding New Wave“If the 3,950 USD zone is breached, the long-term uptrend may end.”
🔍 Market Context
After reaching the historic peak ATH GOLD 4,381 USD , gold has sharply corrected and formed a clear Change of Character (ChoCH) on the H1 timeframe.
Currently, the price is technically recovering to the Resistance – FVG – Fibonacci 4,216 USD zone, which was previously a distribution peak.
The sellers are regaining short-term dominance, while the Order Block zone (3,953–3,960 USD) — which was the starting point of the strongest growth on H4/Daily — is becoming the most critical defense line of the uptrend.
If this zone is decisively broken, it is highly likely that the medium-term bullish structure will break and trigger a bearish expansion towards deeper liquidity zones like 3,689 USD.
💎 Technical Analysis
Resistance – FVG – Fib Zone: 4,216 – 4,228 → confluence resistance zone FVG + Fibo 0.618, suitable for sell reaction.
Liquidity Sweep Zone: 4,043 – 4,006 → intermediate liquidity sweep zone, may see a temporary pause.
Order Block | Structural Base: 3,953 – 3,960 → H4 momentum creation zone → ATH; if breached, long-term bullish structure is invalidated.
Liquidity Zone $$$: 3,689 – 3,685 → deep liquidity zone, potential target if OB is broken.
Overall Structure:
→ Short-term: bearish corrective phase.
→ Medium-term: bullish remains if 3,950 is not broken.
📉 Trading Scenarios
1️⃣ SELL Setup – Reaction at 4,216 – 4,228 USD zone
Entry: 4,216 – 4,228
SL: 4,240
TP1: 4,043
TP2: 3,956
TP3: 3,689
✅ Condition:
Wait for a clear reversal signal (strong rejection or bearish engulfing) on H1/M15 at the FVG resistance zone.
➡️ Classic “Sell the Rally” setup – follow the flow post-ChoCH, targeting the key OB zone 3,953 USD.
2️⃣ BUY Setup – Reaction at Order Block 3,953 – 3,960 USD
Entry: 3,956 – 3,953
SL: 3,940
TP: 4,043 → 4,216
✅ Condition:
Price holds OB and a strong reversal signal appears (bullish engulfing / increased volume / small BoS structure turns bullish again).
➡️ This is the decisive zone for the medium-term trend: if it bounces strongly, buyers will regain control; if it breaks, gold enters a new deep decline cycle.
⚠️ Risk Management
Prioritise SELL when price retraces to 4,216 – 4,228 with reversal signals.
BUY at 3,953 only with a clear reaction; if broken, cease all buy orders.
When price closes H4 candle below 3,950 → confirm bearish break, extend target to 3,689 USD.
💬 Conclusion
Gold is testing the Order Block foundation of the long-term uptrend (3,953–3,960 USD) .
If this zone holds, the market may rebound to 4,216 – 4,280;
but if breached, gold is likely to open a deep decline phase towards 3,689 USD – where a large liquidity pool is concentrated at the bottom.
👉 Reasonable Strategy:
Sell 4,216 – 4,228 USD if clear reversal signals appear.
Buy 3,953 – 3,960 USD if strong reaction;
If 3,950 is breached → confirm extended downtrend, prioritise SELL continuation.
🔥 “This Order Block built the last gold rally — if it breaks, the next leg down will be brutal.”
⏰ Timeframe: 1H – reference H4/Daily
📅 Update: 22/10/2025
✍️ Analysis by: Captain Vincent

XAU USD SELL OFF Good sell off in Xau USD from top level .it's falling from 4331. Now at support near 4200. If crossed below 4200 then again good sell off . Or may take support here and then fall again after taking retracement. Let us see what may happen further. Support 4200 Round level . If fall then 4167 possible.
For more visit my Tradingview Profile

#xuausd Make or Break - Gold Analysis🥇 GOLD (XAU/USD) - Technical Analysis & Outlook
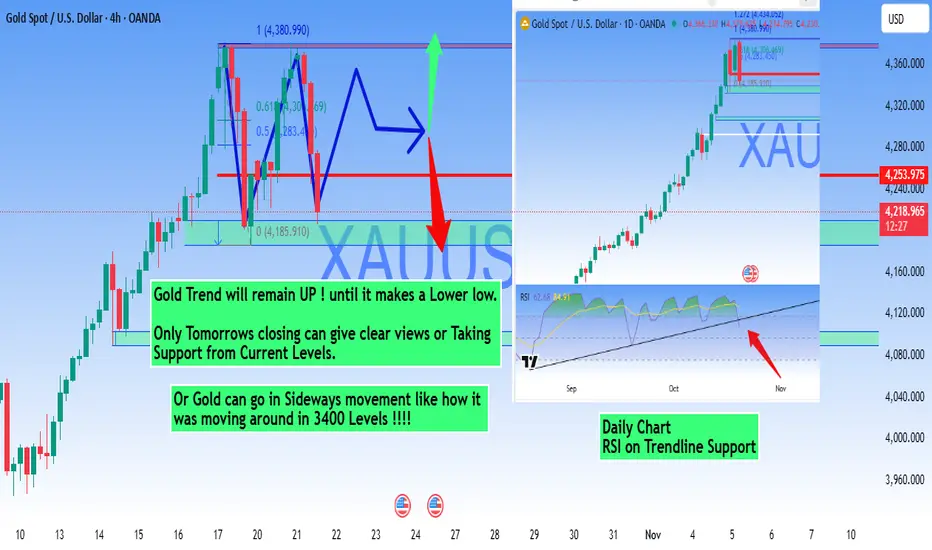
Timeframe: 4H & Daily Charts
Current Price: 2,718.99
Market Structure Analysis
Gold is currently in a **strong uptrend** and will maintain its bullish bias until it forms a clear lower low. The recent consolidation near all-time highs suggests a potential for either continuation or a sideways movement phase.
Key Price Levels
Support Zones
- Immediate Support: 4,218.99 - 4,240.00
- Major Support: 4,185.91 (0 Fibonacci - Recent Low)
- Critical Support: 4,160.00 - 4,180.00 zone
Resistance Zones
- Immediate Resistance: 4,253.97 (Current High)
- Next Resistance: 4,280.00 - 4,300.00
- Target Extension: 4,320.00 - 4,360.00
- Major Target: 4,380.99 (Fibonacci Extension)
Technical Scenarios
- Continuation of the current uptrend expected
- Any pullback to support zones presents buying opportunities
- Target: 4,280 - 4,360 zone
- Extended Target: 4,380+ levels
Consolidation Scenario (Secondary)
Condition: Sideways movement similar to the 3,400 consolidation phase
- Gold may enter a ranging phase at current elevated levels
- Watch for sideways movement between 4,200 - 4,280
- Accumulation pattern before next leg up
- Patience required during this phase
🔴 Bearish Scenario (Alternative)
Condition: Only if price breaks and closes below 4,185
- Bearish only on confirmed break of structure
- Potential retracement to $4,160 or lower
- Wait for clear reversal signals before shorting
RSI Analysis (Daily Chart)
- RSI Position: Near trendline support (around 62)
- Signal: RSI holding above trendline support indicates continued bullish momentum
- Watch For: RSI breakdown below trendline would signal weakening momentum
- Strength: RSI still in bullish territory, no divergence observed
Key Observations
1. **Strong Uptrend Intact:** No lower lows formed yet, trend remains bullish
2. **Fibonacci Levels:** Price respecting key Fibonacci retracement zones
3. **Consolidation Pattern:** Similar behavior to previous $3,400 consolidation
4. **Volume Profile:** Accumulation visible near support zones
5. **Daily RSI:** Holding trendline support, maintaining bullish structure
Critical Points to Monitor
🔸 22/10/2025 Close: Will provide clearer direction
🔸 Support Level: 4,218 - Must hold for bullish continuation
🔸 RSI Trendline: Break would signal momentum shift
🔸 Volume: Watch for increasing volume on moves
🔸 Global Events: Fed policy, geopolitical tensions, USD strength
🎓 #Trading Wisdom
"The #trend is your friend until it bends. #Gold will remain #bullish until it makes a #lowerlow. Stay patient, follow the structure, and let the market show its hand."*
Risk Disclaimer
This analysis is for educational purposes only and should not be considered financial advice. Always manage your risk appropriately, use stop losses, and never risk more than you can afford to lose. Past performance does not guarantee future results.
Like and Follow for Daily Gold Analysis!
#Gold #XAUUSD #GoldTrading #TechnicalAnalysis #ForexTrading #PreciousMetals #TradingView #MarketAnalysis
XAU/USD – Gold Technical Rebound Prepares for Next Waveb]🔍 Market Context
After reaching a peak at the ATH GOLD 4,391 USD region, gold has undergone a technical correction — reflecting temporary profit-taking following a strong upward trend.
The market structure still maintains a bullish bias as the support zones below (FVG + OB) remain intact and untested.
Currently, the price is hovering around 4,325 USD, indicating that selling pressure has weakened.
Buyers are likely to return at two strategic zones below — where institutional money (Smart Money) typically accumulates positions before the next upward wave.
💎 Technical Analysis
ATH GOLD: 4,391 USD
Liquidity Zone $$$: 4,465 – 4,424 USD → the upper liquidity zone, the main target for the next upward wave.
FVG Zone: 4,284 – 4,267 USD → an unfilled gap, likely to be retested.
Order Block Zone: 4,244 – 4,230 USD → deep discount zone confluence with Fibo 0.786, high probability of strong reaction.
Liquidity Clear $$$: 4,186 – 4,190 USD → the last defense zone of the main upward trend.
Overall structure remains bullish ; the current decline is merely a phase of adjustment to “accumulate liquidity” before continuing the upward momentum.
📈 Trading Scenarios
1️⃣ BUY Setup #1 – FVG Zone 4,267 USD
Entry: 4,267 – 4,270
SL: 4,255
TP: 4,330 → 4,366 → 4,391
✅ Condition: Confirming bullish candle (rejection / engulfing bullish) at the FVG zone or a small BoS appears on M15.
➡️ Short-term “buy-the-dip” setup, leveraging the unfilled FVG zone — where technical buyers often initiate positions first.
2️⃣ BUY Setup #2 – Order Block Zone 4,244 USD
Entry: 4,244 – 4,230
SL: 4,210
TP: 4,284 → 4,366 → 4,391 → 4,424
✅ Condition: Strong confirming candle (engulfing bullish) or a retracement pattern breaking a small BoS back up.
➡️ Swing-buy setup at deep discount zone — confluence of OB + Fibo 0.786, high probability and optimal R:R.
⚠️ Risk Management
Avoid FOMO buying in the middle of the range (4,320–4,340).
Prioritize waiting for clear reactions at 4,267 and 4,244 before entering trades.
If the price closes an H1 candle below 4,210 → pause all buy orders, re-evaluate price action at 4,186.
Maintain moderate trading volume during the current rebound phase.
💬 Conclusion
Gold is in a phase of healthy technical correction within a major upward trend.
The two zones 4,267 USD (FVG Zone) and 4,244 USD (Order Block Zone) are key “accumulation” areas for large capital.
When bullish confirmation signals appear, these will be safe buy positions before gold heads back to the peak 4,391 – 4,465 USD .
👉 Reasonable Strategy:
Buy at 4,267 – 4,270 USD if reversal confirmation occurs.
Buy at 4,244 – 4,230 USD if a strong OB reaction signal appears.
🔥 “Smart money waits at precise levels — not at the top. The next gold wave will emerge between 4.267 and 4.244.”

XAUUSD PLAN | When balanced breaks, strength leaves its mark.🔍 Market Context
After setting a short-term peak at the 4,385 – 4,372 USD zone, gold has entered a strong technical correction phase, with a series of consecutive red candles breaking the short-term upward structure.
The sellers temporarily dominate, pushing the price through the H1 upward trendline. However, the support zone below (Liquidity Zone + Order Block Bullish) is beginning to show absorption, indicating that buyers might return at discounted price zones.
💎 Technical Analysis
Previous Bullish BoS: confirms the main trend is still long-term bullish .
FVG Down Zone: 4,285 – 4,260 USD → a price imbalance zone left in the downtrend, possibly where the price may retrace to “fill the gap” before choosing a direction.
Liquidity Zone $$$: 4,222 – 4,218 USD → a short-term support zone where new buying liquidity appears.
Order Block Bullish: 4,203 – 4,185 USD → a confluence area between OB and Fibo 0.786, where large capital might return.
Deep Bullish OB: 4,142 – 4,128 USD → the last defensive zone for the main upward trend.
Order Block Bearish: 4,372 – 4,385 USD → a critical resistance zone, likely to react if the price retraces.
The current structure shows gold is in a retracement – liquidity rebalancing phase, with insufficient signals to reverse the trend.
📈 Trading Scenarios
1️⃣ Main Scenario – Buy reaction at Liquidity zone 4,222 – 4,203 USD
Entry: 4,222 – 4,203
SL: 4,185
TP: 4,260 → 4,318 → 4,372
✅ Condition: Strong rejection candle (rejection / engulfing bullish) appears at the support zone or small reversal BoS.
➡️ This is a “buy the dip” setup following the main trend, leveraging the liquidity zone and confluence OB.
2️⃣ Secondary Scenario – Sell reaction at FVG Down 4,285 – 4,260 USD
Entry: 4,260 – 4,285
SL: 4,300
TP: 4,222 → 4,203
✅ Condition: Strong bearish candle or rejection signal appears at the FVG zone.
➡️ This setup is for scalping traders or short-term shorts in the unfilled price balance zone.
⚠️ Risk Management
Do not FOMO buy when the price has not confirmed the 4,222 zone.
If the price breaks below 4,185 → wait for a re-test to continue selling towards the 4,128 zone.
Keep moderate volume, as the market is in a rebalancing phase – liquidity remains noisy.
💬 Conclusion
Gold is in a transitional phase after a strong decline .
The 4,222 – 4,203 USD zone will be key to determining whether the medium-term upward trend continues.
If this zone holds, gold is likely to retest the 4,318 – 4,372 USD zone.
👉 Reasonable Strategy:
Buy reaction at 4,222 – 4,203 USD when confirmed.
Technical Sell at FVG 4,260 – 4,285 USD if a clear rejection appears.
🔥 “When the market is unbalanced, the strongest side will leave a mark – and this time, the mark is around the 4,220 USD zone.”

GOLD Awaiting Sell Reaction at Peak & Buy Pullback Support🔍 Market Context
After a series of strong Break of Structure (BoS) , gold has reached a new ATH at 4,385 USD – marking a sustainable uptrend over the past 3 sessions.
However, this peak area is currently acting as a significant psychological and technical barrier . Buying momentum is temporarily slowing as the price reacts to the Liquidity Zone around 4,351 – 4,385 USD .
The market is in a phase of liquidity rebalancing .
The major trend remains upward, but the current price area may see a short-term correction before further wave expansion.
💎 Technical Analysis
ATH GOLD: 4,385 USD
Sell Liquidity Zone: 4,430 – 4,435 USD → high liquidity resistance zone, potential for short-term sell reactions.
Liquidity Zone $$$: 4,284 – 4,282 USD → nearby support zone, confluence with trendline.
Order Block | Fibonacci Zone: 4,226 – 4,230 USD → deep discount zone confluencing with Fibo 0.618, high reversal potential.
Overall Structure: remains bullish , but showing short-term signs of weakness as the price fails to hold above 4,360.
📈 Trading Scenarios
1️⃣ SELL Setup – Rejection at peak area 4,385 – 4,433 USD
Entry: 4,430 - 4,435
SL: 4,440
TP: 4,425 → 4,420 →4,415→4,410→4405
✅ Condition: Appearance of rejection or strong bearish engulfing candles at high Liquidity zone.
➡️ This is a liquidity reaction setup – sell when the price sweeps the peak and clear sell signals from major players appear.
2️⃣ BUY Setup #1 – Pullback at 4,284 – 4,282 USD
Entry: 4,284 – 4,282
SL: 4,272
TP: 4,290 → 4,300 → 4,310/Open
✅ Condition: Strong H1 candle reaction at support or minor reversal structure.
➡️ Buy with the main trend, taking advantage of a slight pullback around the support Liquidity zone.
3️⃣ BUY Setup #2 – OB Deep Zone 4,226 – 4,230 USD
Entry: 4,226 – 4,230
SL: 4,190
TP: 4,235 → 4,240 → 4,250/Open
✅ Condition: Appearance of bullish BoS or confirming bullish engulfing candle.
➡️ This is a deep discount zone, suitable for swing orders following the main trend.
⚠️ Risk Management
Avoid FOMO buying at high zones (4,360+).
Prioritize observing price behavior at 4,284 and 4,226 before entering orders.
Sell orders at 4,385–4,430 are only triggered if there is a clear confirmation signal.
Maintain moderate volume, avoid averaging down without confirmation.
💬 Conclusion
Gold is accumulating after reaching the peak of 4,385 USD , this is a crucial phase to determine the correction before the new upward wave.
The most effective strategy now is sell reaction at the high peak area 4,385 – 4,430 and buy with the trend at 4,284 – 4,226 USD when confirmation appears.
👉 Reasonable Strategy:
Sell Reaction: 4,385 – 4,430 → TP 4,284 – 4,226
Buy Pullback: 4,284 – 4,282
Buy OB Deep: 4,226 – 4,230

Gold Plan | Where will gold drop today?🔍 Market Context
Gold continues to maintain a short-term upward trend following a series of Break of Structure (BoS) , confirming active buying from lower zones.
Currently, the price is approaching the ATH GOLD zone and heading towards the Liquidity Sell Zone 4,281 USD – a densely liquid area where short-term sell reactions from major players may occur.
After a hot rise, technical correction risks are starting to increase. Lower zones like 4,186 – 4,152 – 4,130 USD will be potential “accumulation zones” for institutional buyers in the upcoming pullback.
💎 Technical Analysis
ATH GOLD: 4,275 – 4,280 USD
Liquidity Sell Zone: 4,281 – 4,285 USD → high liquidity resistance area, may trigger short-term reversal reactions.
Liquidity Zone $$$: 4,186 – 4,152 USD → crucial support area in the uptrend, where technical reactions are expected.
FVG – BoS Zone: 4,152 – 4,148 USD → “price balance” zone yet to be filled, likely to be retested.
OB Deep Zone: 4,130 – 4,120 USD → deep demand zone converging with Fibo 0.786 – ideal area for large capital to re-accumulate.
Overall structure remains bullish , but in the premium zone – an area where institutions typically distribute orders to gain liquidity before adjusting.
📈 Trading Scenarios
1️⃣ Main Scenario – Sell reaction at Liquidity Zone 4,281 USD
When the price hits the 4,275 – 4,281 USD zone and clear reversal signals appear (rejection candles, bearish engulfing, or minor structure break),
→ open short-term sell orders (scalp/intraday).
Target: 4,186 → 4,152 USD.
Stop Loss: above 4,285 USD.
➡️ This is a typical “liquidity sweep – technical reaction” scenario, capitalising on short-term sell-offs at high liquidity peaks.
2️⃣ Secondary Scenario – Buy back following the main trend after correction
When the price corrects to the 4,186 – 4,152 USD zone or deeper to OB Deep 4,130 USD ,
and clear upward confirmation signals appear (strong rejection or minor BoS increasing again),
→ open buy orders in line with the main trend.
Target: 4,230 → 4,275 USD.
Stop Loss: below 4,120 USD.
➡️ Trend-following scenario – waiting for price correction to discount zones to accumulate in line with the larger trend.
⚠️ Risk Management
Do not FOMO buy when the price is hitting the 4,275 – 4,281 USD zone.
Prioritise short-term sells with clear confirmations or buys at lower OB zones.
Keep light volume when trading against the main trend.
Observe reactions at the 4,186 zone – this is the key level of the day.
💬 Conclusion
Gold is at the peak of the current rise , short-term profit-taking pressure may appear around the 4,281 USD zone.
If strong reactions occur, a correction to the 4,186 – 4,152 USD zone is reasonable for market rebalancing.
The larger trend remains upward , so lower OB zones will be reasonable buy opportunities for the next wave.
👉 Reasonable Strategy:
Sell reaction at 4,281 USD when reversal signals appear.
Buy back at 4,186 – 4,152 – 4,130 USD when confirmation signals appear.

XAUUSD: Profit-Taking Pressure Emerges XAUUSD: Profit-Taking Pressure Emerges - Trading Strategy as Gold Adjusts
Hello traders community,
Today's trading session witnessed a strong "Price Rejection" of XAUUSD at the new peak, triggering a nearly $20 drop. Although the long-term bullish structure remains intact, the profit-taking signal from buyers is evident. This article will delve into the analysis of key price zones and outline a detailed trading strategy in the context of the adjusting market.
📊 Technical Analysis
The H1 chart provides us with an overview of the current liquidity zones and price structure:
Fibonacci Resistance Zone: The price reacted strongly at the confluence of the 2.618 Fibonacci Extension levels, around the $4240 area. A strong bearish candle emerged right after the price touched this zone, confirming it as an extremely potential "Sell zone." Sellers have officially stepped in.
Point of Control (POC) and Liquidity: The Volume Profile (VPVR) indicator shows the area with the highest trading volume concentration (POC) is at $4196. This is the "magnet" zone attracting price in the short term. If the price recovers, this will be the decisive tug-of-war zone.
Key Support Zones:
$4196 (Buy Scalping): The POC zone acts as the first price support point. Scalping traders can look for short-term buying opportunities here.
$4158 (Buy Zone): This is a stronger support zone, the bottom of the previous uptrend, and also an area with significant trading volume. Buyers are likely to return strongly if the price adjusts here.
📰 Market Sentiment
Profit-Taking Pressure: After a hot growth streak, Gold's sharp drop of nearly $20 is a healthy adjustment move. The selling force mainly comes from short-term profit-taking traders.
"Sharks" Still Accumulating: Notably, while the price adjusts, the world's largest gold ETF, SPDR Gold Trust, increased its gold holdings by 1.15 tonnes. This move shows that large institutions remain optimistic about Gold's long-term prospects and are taking advantage of the dip to accumulate more. This is a signal contrary to short-term price action, which traders need to pay special attention to.
🎯 Actionable Trading Plan
With the current technical signals and market sentiment, we prioritize the strategy of selling when the price recovers (Sell the Rally).
Scenario 1: Sell on Downtrend (Sell) 📉
Entry Zone: Wait for the price to recover to the $4228 zone. This is the "retest" area of the liquidity zone previously controlled by sellers.
Stop Loss: $4235, above the nearest minor peak.
Take Profit: $4210 - $4188 - $4165 - $4133.
Scenario 2: Buy at Strong Support (Buy) 📈
Entry Zone: If the price continues to drop, look to buy at the "Buy zone" $4158.
Stop Loss: $4150, a safe level below the support zone.
Take Profit: $4173 - $4190 - $4205 - $4230.
Scenario 3: Short-Term Scalping (Scalping Buy) ⚡️
Entry Zone: Quick buy at the POC zone $4196.
Stop Loss: $4188, a short and tight stop loss level.
Take Profit: $4210 - $4228.
Summary
In the short term, sellers are temporarily dominant after Gold failed to conquer the $4240 resistance zone. The main strategy is to sell when the price recovers. However, the buying action of the SPDR fund indicates that the medium and long-term uptrend remains very solid. Therefore, buying orders at strong support zones like $4158 are also an opportunity not to be missed.
Trade with discipline and manage your capital tightly. Wishing all traders an effective trading day!
Note: This analysis is based on personal views and is for reference purposes only, not direct investment advice.

XAU/USD – Buyers Reclaim Structure, Targeting Liquidity Zone🔍 Market Context
After a strong Liquidity Sweep yesterday, gold has rebounded and formed consecutive Break of Structure (BoS) , confirming buyers have regained control.
The price has now filled the Fair Value Gap (FVG 4,191 – 4,202) and is heading towards the Sell Liquidity Zone 4,237 – 4,240 USD — a concentration of pending sell orders and stop-losses from previous short positions.
The current structure shows strong bullish momentum , however, the possibility of a correction from this high liquidity area is noteworthy.
💎 Technical Analysis
Liquidity Sweep: Completed, clearing liquidity below 4,070.
FVG (Fair Value Gap): 4,191 – 4,202 → filled, confirming price balance.
Sell Liquidity Zone: 4,237 – 4,240 → potential resistance zone, likely strong reaction.
OB Zone | Buy: 4,143 – 4,145 → nearby support, expected first reaction when price corrects.
OB Deep | Buy: 4,110 – 4,115 → deep demand zone, confluence with Premium Zone 4,156 – 4,118.
Overall Structure: The main trend remains bullish , with strong upward momentum but requires a technical correction for re-accumulation.
📈 Trading Scenarios
1️⃣ Main Scenario – Sell reaction at liquidity zone
When the price approaches the Sell Liquidity Zone 4,237 – 4,240 USD , observe candlestick reaction (rejection, bearish engulfing).
If confirmation signals appear, open a short-term sell order .
Target: OB Buy Zone 4,145 → 4,110 USD.
Stop Loss: above 4,245 USD.
➡️ This is a liquidity reaction setup, high probability when the market encounters resistance confluence with Fibonacci zone 0.786–1.0.
2️⃣ Alternative Scenario – Buy with trend from OB
If the price corrects to the OB Zone 4,143 – 4,145 USD and shows a clear reaction (strong rejection or minor structure break),
→ a buy with the main trend can be opened.
Target: return to 4,200 → 4,235 USD.
Stop Loss: below 4,130 USD.
If the price drops further, the OB Deep Buy 4,110 – 4,115 USD will be the final “liquidity attraction” zone for a new upward bounce.
⚠️ Risk Management
Avoid FOMO buying at 4,200+ as it is near the liquidity resistance zone.
Prioritise short-term sell at 4,237 if clear signals are present.
When price corrects to OB, wait for reaction before buying, do not bottom fish early.
💬 Conclusion
After completing the liquidity sweep, gold has confirmed a return to bullish structure with multiple consecutive BoS.
Currently, the price is approaching the liquidity zone 4,237 USD – a short-term correction is highly likely.
The 4,145 – 4,110 USD zone will be where buyers await reaction to accumulate orders and continue the medium-term uptrend.
👉 Reasonable Strategy:
Short sell at 4,237 USD if reversal signals are present.
Wait to buy at OB zone 4,145 – 4,110 USD when clear reaction occurs.

m15 timeframe sees gold drop sharply by 50 points 🔍 Market Context
Gold prices have just reached an all-time high (ATH GOLD) around the 4,180 USD mark, following a steep upward rally over several sessions.
Immediately after, the market witnessed the first break of structure (BoS) – a sign that the upward momentum is weakening .
Currently, prices are returning to fill the Fair Value Gap (FVG) at 4,125 – 4,145 USD , and this is likely a liquidity rebalancing phase before prices choose the next direction.
💎 Technical Analysis
ATH GOLD: 4,180 – 4,185 USD
Fair Value Gap (FVG): 4,125 – 4,145 USD → an empty price zone that needs to be filled.
Order Block Buy Zone 1: 4,050 – 4,060 USD → the nearest demand zone, potentially creating the first technical reaction.
Order Block Buy Zone 2: 3,980 – 3,985 USD → a deeper demand zone, large liquidity confluence, possibly becoming the main "accumulation point."
Overall Structure: After breaking the upward channel, the market is in a retracement phase – the medium-term structure remains bullish .
📈 Trading Scenarios
1️⃣ Short-term Sell Scenario – filling FVG and technical adjustment
If prices continue to test the FVG 4,125 – 4,145 USD zone without surpassing it,
→ consider a short-term sell to catch the technical retracement phase.
Target: the first OB Buy Zone at 4,050 USD .
Stop Loss: above 4,155 USD (to avoid being swept above the FVG peak).
➡️ This scenario suits short-term traders following corrective waves – only enter when there is a clear reversal candle confirmation.
2️⃣ Trend-following Buy Scenario – catching the rebound from OB Zone
If prices adjust to the 4,050 – 4,060 USD zone, observe reaction signals such as Bullish Engulfing or strong Rejection .
Upon confirmation, initiate a trend-following buy order .
Target: zone 4,125 → 4,145 USD or the previous peak at 4,180 USD.
Stop Loss: below 4,030 USD.
If the first OB zone does not hold, the 3,980 – 3,985 USD zone will be an ideal area for long-term "accumulation."
⚠️ Risk Management
Avoid FOMO buying at high prices when the FVG is not yet filled.
Prioritise trading at clear reaction zones (OB, FVG edge).
Reduce volume when entering counter-trend orders to preserve capital.
💬 Conclusion
After a steep rise, gold is entering a value rebalancing phase .
The current market structure leans towards a short-term technical retracement before continuing the main upward trend.
If the 4,050 – 4,060 USD zone reacts well, gold may soon rebound and aim for the 4,150 – 4,180 USD zone.
👉 Reasonable Strategy:
Short-term sell when price reacts at FVG.
Wait to buy at OB Buy Zone when there is a confirmed bullish signal.
CHF/JPY Builds Momentum for Next Wave HigherThe CHF/JPY 1-hour chart shows a completed wave (1) near the 191.17 level, confirming a strong bullish impulse after a previous decline. The pair is now entering a wave (2) corrective phase, which is likely to retrace toward the 188.7–189.0 support zone before resuming the next upward move. This pullback appears to be a healthy correction within the broader uptrend. Once the correction is complete, wave (3) is expected to begin, targeting levels above 193.0 . The overall market structure remains bullish, suggesting that any short-term dips could offer potential buying opportunities for traders waiting for the next impulsive rally
Stay tuned
@Money_Dictators
Thank you.
