Potential Breakdown with Retest or Reversal Zone This chart represents a classic Double Top pattern, a bearish reversal signal indicating strong resistance around the 3,380 - 3,390 USD zone (marked with two white circles).
🔍 Key Zones and Levels:
1. Resistance Zone (~3,380 - 3,390 USD):
Price was rejected twice here.
Suggests strong selling pressure and buyer exhaustion.
2. Mid Support/Retest Zone (~3,337.857 USD):
Marked with a horizontal white line.
Could act as a short-term resistance if price retraces.
3. Demand Zone (~3,330 - 3,337 USD):
Highlighted green box: potential reversal/retest zone.
Bullish scenario: price bounces from here and heads back to retest resistance.
4. Current Price (~3,309.980 USD):
Price has broken below the demand zone and is approaching strong horizontal support.
5. Lower Support (~3,265 - 3,270 USD):
Highlighted with blue horizontal lines and purple arrows.
Could be the next bearish target if breakdown is confirmed.
🔄 Two Possible Scenarios:
📉 Bearish Continuation:
Price retests the broken demand zone (now resistance).
Rejects and forms a lower high.
Falls toward the lower support around 3,265–3,270 USD.
📈 Bullish Reversal:
Price reclaims the green demand zone.
Pushes above 3,337.857 USD level.
Heads back to retest the double top area (~3,380
✅ Conclusion:
The bias is currently bearish, supported by:
Double top formation.
Breakdown below key demand zone.
Momentum favoring further downside
However, a bullish reversal is possible if price reclaims the 3,337 USD zone and shows strong bullish structure.
Forexsignals

EUR USD 15 ANALYSIS AND TARGETAS market have taken all buyside liquiduty it is goignt for sell side....i have marked the todays target .....for more updates follow me

GBPUSD IS BULLISH!!As per analysis, market is trending higher.
Two weeks before market is bullish ( gains a lot).
So last week profit booking happens( just my view only).
Now you know what will happen in bullish market after profit booking,
Yes market will go higher.
My first looking area 1.3632
Second one is 1.3747 area.
This is totally my view only , do your own analysis before taking any decision.
Market is simple, but not easy.
One more thing( I am in a long position from 1.3458)

Technical Analysis on XAU/USD (Gold vs USD) – Bullish Reversal 📊 Chart Overview:
This chart of XAU/USD (Gold) on a lower timeframe shows a potential bullish reversal setup. The price action has formed a series of lower highs and lower lows, but now a bullish momentum is building up, suggesting a possible breakout to the upside.
🔍 Key Observations:
🟠 Swing Points Identified:
The orange circles mark significant swing highs and lows, clearly outlining a recent downtrend.
The latest swing low (bottom-right) shows a strong rejection with a bullish engulfing candle forming, indicating buyer interest.
📦 Demand Zone (Support Area):
The grey rectangle near the lower region marks a demand zone where buyers have stepped in before.
Price has reacted strongly from this zone again, validating it as a key support level.
📉 Resistance Turned Potential Breakout Zone:
The red line (~3,291.416) represents a resistance level that was previously support.
Price has broken above it and now appears to be retesting it, indicating a possible retest-confirmation for a bullish continuation.
🎯 Target & Risk Management:
✅ Entry: Confirmed breakout and retest around 3,291.
📈 Target: 3,364.819 (green zone above), based on previous resistance.
❌ Stop Loss: Below 3,267.772, the recent swing low.
The setup offers a favorable risk-to-reward ratio.
🧭 Projection Path:
The white arrowed path illustrates a likely pullback before continuation upward, suggesting a bullish structure if confirmed.
✅ Conclusion:
Gold is showing signs of a bullish reversal from a well-defined demand zone, with a potential rally toward the 3,365 area. A successful retest of the broken resistance as new support would strengthen the bullish bias.
📌 Watch closely for confirmation candles on the retest before entering.

BTC SELL Recommendation down 109400Timeframe: M15
Strategy in use: Trend-following and supply/demand zone-based trading
Technical tools:
Moving Averages (MA): Short-term (red) and long-term (blue) SMAs. Price is below both — confirming a bearish trend.
Volume: Declining volume during consolidation suggests weak buying interest.
Resistance zone: Around 110,890 - 110,930, clearly acting as a barrier as shown by repeated candle rejections.
Price Pattern: After a technical pullback, BTC hits resistance and forms a short setup.
📉 BTC SELL Recommendation
Sell Entry: 110,840 – 110,900
Stop Loss (SL): 111,023 (above resistance zone)
Take Profit (TP): 109,400
Risk:Reward Ratio: Estimated at 1:3 — suitable for a short-term swing strategy.
🧩 Reasons for Entering a Short Trade
Price below MAs, showing bearish momentum.
Strong resistance zone at 110,890 – 111,023 with multiple rejections.
Falling volume during the pullback, indicating weak demand.
Bearish candle structure: Sellers are currently in control.
Good R:R ratio, with profit potential down to 109,400.
⚠️ Warning
If the price closes above 111,023 with strong volume, this setup becomes invalid.
Watch for price action during the U.S. session — it’s key to the next major move

How to Trade ?Set Up Your Trading Account. ...
Learn Market Basics. ...
Master Bids and Asks. ...
Use Fundamental and Technical Analysis. ...
Set Stop-Loss to Minimise Risk. ...
Start Small and Choose Stable Stocks. ...
Open a Demat account. ...
Get familiar with stock-related terms.

XAU/USD Elliott Wave Count: Preparing for Final ImpulseXAU/USD appears to be in a textbook 5-wave impulsive structure on the 4H chart, with the market now completing Wave 4 as a classic ABC corrective flat/pennant.
The impulsive move from the Wave 2 low has formed clear internal substructures, with Wave 3 exhibiting extended price action, consistent with Elliott Wave guidelines.
Currently, price is consolidating in a contracting pattern labeled Wave 4 (A-B-C), which looks to be near completion. Based on wave symmetry and Fibonacci projections, a strong upside move is anticipated once Wave 4 concludes, leading into the final Wave 5 rally.
Entry Zone: 3286.875
Target: 3367.440– 3410.210
Stop Loss: Below 3260.190.

GBP/USD at a Turning Point – Correction Pattern in PlayIt appears that the corrective Wave A in the GBP/USD pair is nearing completion, and the formation of Wave B may be underway. The Wave 1 to 5 structure seems to have been completed, indicating the beginning of an A-B-C corrective phase.
If the correction unfolds as expected, potential upside targets are 1.32918 and 1.33555. However, if the market faces rejection below the trendline, the stop-loss level would be 1.32021.

Watch This Wedge! AUDNZD Primed for Upside PushThe AUDNZD pair forms a falling wedge pattern, a bullish reversal formation that typically occurs after a downtrend. The price action is being squeezed between a descending resistance line and a descending support line, creating a narrowing range. The market is now attempting to break out of the wedge, with the current price testing the resistance line. A breakout and close above this trendline would signal bullish strength and could lead to a reversal of the recent downtrend.
Targets:
TP1: 1.07605
TP2: 1.07922
Stop Loss: Below the recent low at 1.06542

CHFJPY triangle formed big rally ahead#CHFJPY
Sharing a perfect trade, please take a look at below Image,
As per EWT wave 4 Triangle is formed, is near a demand area
wait for price to react .
and the trade starts boom 💥🚀🚀 wave 5 - approx. 400 pips move.

XAG/USD Eyes Upside Targets as Wave C MaturesXAG/USD is currently trading in a corrective phase where wave B appears to have completed, and wave C is currently forming. Based on the current price action, it doesn’t seem likely that this entire move will result in a full bullish recovery. The structure suggests that this could be sub-wave C of wave 4, potentially completing around the 26.79944 level. Going forward, if the 5th wave begins to unfold, potential targets could be in the range of 29.74182 to 30.57528.

EUR/NZD Wave Structure Shift: 4th Wave Correction in ProgressThe 3rd wave in EUR/NZD appears to have been completed, and the market seems to be entering the 4th wave. There is a possibility that the 4th wave could take support near the Fibonacci 0.5 level (1.19164). After that, the 5th wave of the impulse phase may move upward.
If the market falls below 1.98303, it would confirm the beginning of the 4th wave. In that scenario, the first target could be around 1.95907 .

Trade Idea: SELL BTCUSD at 78,200 – 78,500🧠 Technical Analysis (1H Chart):
Key Resistance Zone: 78,200 – 78,500 USD
Price has consistently failed to break above this area.
Multiple rejections from this zone suggest a strong supply zone.
This area aligns with historical resistance + EMA confluence.
Trend Structure:
Price formed a lower high and shows signs of a short-term bearish reversal.
Breakdown from minor support at 77,800 confirms weak momentum.
Current price action shows hesitation with reduced buying volume.
Volume Analysis:
Large red volume bars signal strong seller presence near resistance.
Weak green candles near resistance imply exhausted buying interest.
🎯 Trade Setup:
Entry Zone: SELL from 78,200 – 78,500 USD
Stop Loss: Above 79,600 USD (just beyond strong resistance zone)
Take Profit:
TP1: 70,000 USD – major support & volume node
TP2: 68,000 USD – high probability support zone from recent base
📊 Risk-to-Reward (R:R): Approximately 1:3 to 1:4 – ideal for swing or short-term positional trades.
🚀 Follow me for more high-probability trading opportunities! 🚀

database trading Database trading involves the exchange of data assets, which can include raw data, processed data, or access rights to specific datasets.
Database trading refers to the buying and selling of databases or data-related products, often for financial or commercial purposes, encompassing large datasets, data assets, or rights to access specific data.

Importance of RSIThe Relative Strength Index (RSI) is a crucial momentum indicator in technical analysis, helping traders identify potential overbought or oversold conditions and gauge the strength of price movements, ultimately aiding in making informed trading decisions

Gold hits important support. Is the downtrend over?
📊 Trump's "reciprocal tariffs" policy is affecting the entire financial market in general and gold prices in particular. The trade war is approaching and the market continued to fall sharply on Monday. Not staying out of the game, OANDA:XAUUSD is also inevitable to sell off when market volatility increases. Let's analyze the next developments of gold from the perspective of **Technical Analysis:** and the opportunity to find profits at this time:
🔹 **Frame D**: After 3 consecutive days of decline, FOREXCOM:XAUUSD prices have temporarily maintained the upward price trend. And currently the price is at an important support area, the old peak area 1 month ago. Whether the correction ends here or not, we will need to consider further in the next time frames
🔹 **H4 frame**: The important key zone has been broken, the bearish price structure has not changed, it is not yet possible to confirm that this downtrend has ended.
🔹 **H1 frame**: The bearish price structure is very clear, however, the selling force is not as strong as before. The support area still brings a cautious mentality to the bears, plus the profit-taking action for SELL positions after the past 3 days.
✅**Trading plan:*
Looking at the price structure, although the price is at an important support area, we are still not sure that this downtrend has ended, so the BUY option will not be considered. However, the current area is no longer suitable for setting up a SELL position. The priority at the moment is to wait for the price to return to the marked resistance area to TRADE WITH THE MEDIUM TERM TREND. The market volatility is very high at the moment so pay attention to reduce the corresponding Volume and Stoploss with the loss you can accept.
💪 **Wishing you success in achieving profits!**

AUD/USD: Bullish Momentum Builds from Strong DemandIn the 4-hour AUD/USD chart, strong supply and demand zones are visible. A significant demand zone is observed around the 0.62269 level. Within the chart, a Change of Character (ChoCh) is identified from the 0.6323 level, and a Break of Structure (BoS) is noted at the 0.63211 level. A strong selling reaction has been observed from the supply zone, and the market has retested that level again.
On the demand side, the market has touched the strong demand zone twice and showed a bullish formation each time. Currently, the price is forming a strong bullish candle again.
Based on the Fibonacci levels, potential upside targets could be seen at 0.62717, 0.63128, and 0.63312, provided the market holds above the demand zone. However, if the demand zone is broken, there is a possibility of the market dropping down to 0.61901 .

XAU/USD: 5th Wave Rally After CorrectionOn the 1-hour timeframe, XAU/USD has formed an Elliott Wave corrective structure. This is an expanded flat correction, typically seen in the 4th wave. The correction seems to have been completed at 3,054, suggesting that the 5th wave may be in progress.
For bullish traders, a potential long position can be considered around the 0.236 retracement level as a pullback entry point.
The 5th wave has the potential to reach the following upside targets: 3,110, 3,145, 3,165
However, this bullish outlook remains valid only if the low of Wave IV holds. A breakdown below this level would invalidate the bullish scenario.

GBP/USD Technical Outlook: Elliott Wave Mapping the Next MoveThis GBP/USD 4H chart presents an Elliott Wave analysis.
Wave (1) and (2): The market had an impulsive bullish movement in Wave 1, followed by a corrective Wave 2.
Wave (3): A strong bullish move with momentum.
Wave (4): A corrective phase, forming a triangle pattern (a-b-c-d-e), which suggests the market is preparing for another impulsive leg.
Entry Confirmation: A breakout above the triangle pattern.
First Target: 1.31457 (Fibonacci 0.382)
Second Target: 1.32105 (Fibonacci 0.5)

Option and Database tradingTo study an option chain, focus on the current market price, displayed in the centre. Analyse the built-up data to understand market direction based on recent changes in open interest and price. ITM call options are typically highlighted in yellow, making it easier to distinguish them from other options.
The put-call ratio measures trading volume using put options versus call options. Instead of the absolute value of the put-call ratio, the changes in its value indicate a change in overall market sentiment.

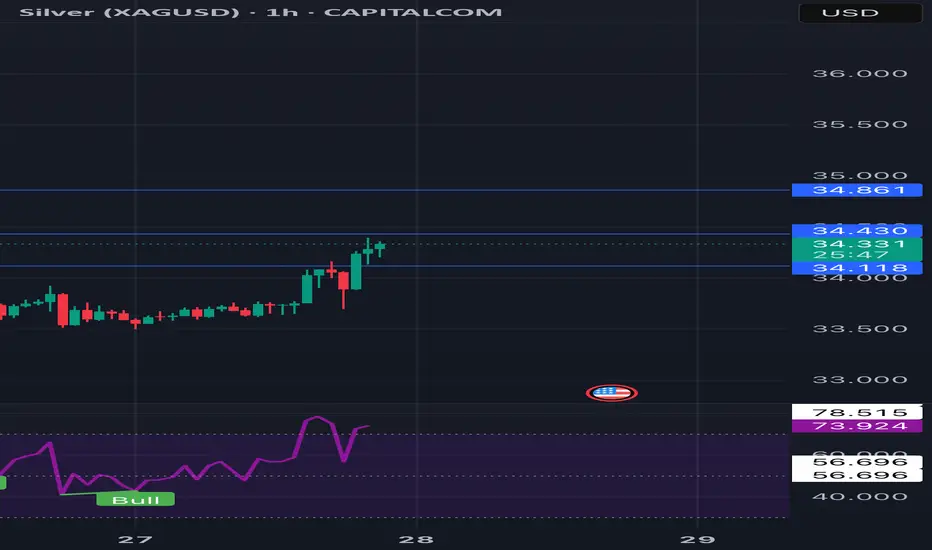
Silver Price Alert: Is XAG/USD Headed for $34.108? Learn Why!"Join us for an educational session on XAG/USD as we analyze key market trends and technical signals pointing to a potential drop toward $34.108. Understand the factors driving gold prices and gain insights to improve your trading strategy!
#chartanalysis
#xagusd
#trendanalysis
Gold Awaits – A Major Move Is Just Around the CornerGold has shown consistent structure since the start of this week.
Today, there are no major economic events, so price is likely to continue moving sideways within the current range, as previously analyzed in AD’s plan.
📌 Important Events Coming Up:
🔸 Thursday: US Quarterly GDP data
🔸 Friday: PCE Inflation Report (Key inflation indicator)
👉 These are the two most impactful news releases this week, and essentially wrap up Q1/month-end flows.
→ Global traders will be closely watching Thursday & Friday, so stay extra cautious during these two sessions.
🔄 Today’s Market Behavior:
Gold continues to range within the same channel shared earlier this week.
There is no clear breakout or strong directional move yet.
The market is essentially waiting for Thursday & Friday's data — which could act as the catalyst for a stronger bearish correction, in line with AD’s mid-term outlook.
🔍 Current Trading Strategy:
As shared from the beginning of the week, AD continues to trade reactions at key support and resistance zones.
Without a confirmed breakout, the approach remains:
→ Trade the range. React to both ends of the zone.
🧭 KEY LEVELS TO WATCH:
🔺 Resistance: 3,010 – 3,036 – 3,046 – 3,057
🔻 Support: 3,010 – 3,001 – 2,988
🎯 TRADE ZONES:
BUY ZONE: 2988 – 2986
SL: 2982
TP: 2992 – 2996 – 3000 – 3004 – 3008 – 3015
SELL ZONE: 3045 – 3047
SL: 3051
TP: 3042 – 3038 – 3034 – 3030 – 3026 – 3020
🧠 Final Reminder:
There is no breakout confirmation yet → market is still in accumulation mode.
Be patient, avoid FOMO, and watch price reaction closely at each zone.
➡️ Trade clean levels. Enter only when setups are clear — stay out if not.
Protecting your capital always comes first.
— AD | Money Market Flow

Gold Outlook – Breakout or Pullback in the Final Week of March?🧠 Final Week of March: Will Gold Break Out or Pull Back? Complete Market Outlook + Trade Plan for XAUUSD
🌐 1. Fundamental Overview – Macro Factors Driving Gold
Gold experienced a sharp $50+ correction last week after printing new all-time highs. The recent price action was shaped by several key macroeconomic factors:
🔸 The Federal Reserve held interest rates steady and delivered a more cautious tone — suggesting no immediate rate cuts, which strengthened the USD and put pressure on gold.
🔸 US Dollar Index (DXY) recovered above the 104 mark, adding bearish momentum for XAUUSD.
🔸 Upcoming US inflation data (PCE this Friday) is the main event of the week — market participants are positioning cautiously ahead of this.
🔸 End-of-quarter fund flows may trigger erratic moves and profit-taking, especially as institutions rebalance portfolios.
Despite this pullback, late-week buying activity suggests that buyers are still defending key zones, and the medium- to long-term bullish structure remains intact.
📈 2. Technical Analysis – Chart Structure & Price Action
✅ Market Context:
Price broke out of the short-term ascending channel but is still respecting the major uptrend structure
Currently testing support zones with potential for either continuation or deeper correction
Key zone around 3,013.67 is holding for now, but volatility is expected
🆕 Monday Opening (March 25, 2025) Update:
Gold opened with weakness after a brief end-of-week bounce
Price is currently stalling at a key Fibonacci retracement area (0.5–0.618) on H1/H2
Buyers have lost momentum, suggesting a consolidation or second leg down may be forming
🔁 Scenarios:
🟢 Bullish Scenario:
Price holds above 3,000 / 2,987 zone
Rebound to test 3,031.80 → breakout → targets 3,046.38 and 3,057.58
🔴 Bearish Scenario:
Failure to hold 3,000 → break below 2,987 → opens downside continuation
Price could revisit deeper demand zones below (e.g., 2,970–2,950)
📌 Key Levels:
Resistance: 3,031- 3,046 - 3,057
Support: 3,013 - 3,000.33 - 2,987
🎯 TRADE PLAN – XAUUSD
BUY ZONE: 3000 – 2998
SL: 2994
TP: 3004 – 3008 – 3012 – 3016 – 3020
SELL ZONE: 3030 – 3032
SL: 3036
TP: 3026 – 3022 – 3018 – 3014 – 3010 – 3000
Trade within reaction zones. Prioritize partial profits and always protect your capital with tight SLs.
✅ Conclusion:
Gold is still technically bullish but in a corrective phase
Market awaits confirmation from either bulls or bears before a clean breakout
News flow + macro data (PCE) will be key catalysts this week
Stay patient, trade the levels, and let price action lead
— AD | Money Market Flow
