Gold holds firm at 3,63x | Caution for Friday session🟡 XAU/USD – 19/09 | Captain Vincent ⚓
🔎 Captain’s Log – Market Context
FED : Probability of a 25bps cut in October is 91.9%, while holding rates is only 8.9% → almost certain FED will continue easing.
US News : No major data today, market remains quiet.
Gold : Sharp moves in Asia session, but support 3,632 – 3,630 held strong.
Yesterday’s Buy at 3,62x delivered 200 pips , confirming this zone as a “fortress” support.
Note : Today is Friday – end of the week session, unexpected volatility may occur before the weekly close → strict risk management required.
⏩ Captain’s Summary : Gold remains bullish, but caution is needed with end-of-week swings. Golden Harbor around 3,63x continues to be a solid anchor.
📈 Captain’s Chart – Technical Analysis
Storm Breaker (Resistance / Sell Zone)
3,661 – 3,663 (intraday resistance)
3,683 – 3,685 (strong OB, likely profit-taking zone)
Golden Harbor (Support / Buy Zone)
3,602 – 3,605 (FVG zone – deeper support if 3,63x breaks, waiting for strong demand)
Market Structure
After rebounding from 3,62x, Gold consolidated around 3,65x – 3,66x.
Main trend stays bullish, but needs support retest to confirm buyers’ strength.
3,66x is the pivot barrier:
• Breakout → targets 3,68x
• Rejection → retest 3,64x – 3,62x
🎯 Captain’s Map – Trade Plan
✅ Buy (priority)
Entry: 3,602 – 3,605
SL: 3,588
TP: 3,629 – 3,661 – 3,683
⚡ Sell (short scalp)
Entry: 3,683 – 3,685
SL: 3,695
TP: 3,665 – 3,645
⚓ Captain’s Note
“The 3,63x fortress continues to hold, keeping the Golden ship safe on its northward journey. Golden Harbor 🏝️ (3,602 – 3,605) remains the main dock for sailors to gather strength. Storm Breaker 🌊 (3,683 – 3,685) may raise waves, suitable for short Quick Boarding 🚤 . Today is Friday – the sea can shift unexpectedly, so keep the sails full but hands steady on the helm.”
Forextrading

FED slows down: Cuts 25bps, gold stays flat🟡 XAU/USD – 18/09 | Captain Vincent ⚓
🔎 Captain’s Log – News Context
FED : Cut rates by 25bps as expected, hinted at 2 more cuts this year → initially supported Gold to rebound around 3,65x.
Powell turned hawkish :
• “No need to move quickly on rate cuts.”
• “Today’s cut is mainly risk-management.”
This message signaled that the FED is not fully opening the easing door → Gold fluctuated and stalled its upside momentum.
Tonight: Awaiting Jobless Claims & Philly Fed for more clarity on the FED’s path.
⏩ Captain’s Summary
Gold is supported by the rate cut, but Powell’s “braking” caused volatility.
Zone 3,663 – 3,665 has become the pivot support to determine the next move.
📈 Captain’s Chart – Technical Analysis
Storm Breaker (Resistance / Sell Zone)
3,684 – 3,686 (strong OB)
3,717 – 3,719 (ATH Zone – very strong, likely heavy selling)
Golden Harbor (Support / Buy Zone)
Pivot Dock: 3,663 – 3,665 (new pivot support)
Main Harbor: 3,629 – 3,630 (BoS confluence & old sideway)
Market Structure
After breakout and profit-taking, Gold returned to test support.
3,663 – 3,665 : pivot support.
• If it holds → rebound to 3,684 – 3,717.
• If it breaks → deeper correction to 3,629.
🎯 Captain’s Map – Trade Plan
✅ Buy (priority)
Buy Zone 1
Entry: 3,663 – 3,666
SL: 3,655
TP: 3,684 – 3,717
Buy Zone 2
Entry: 3,629 – 3,630
SL: 3,618
TP: 3,663 – 3,684 – 3,717
⚡ Sell (only at resistance)
Sell Zone OB
Entry: 3,684 – 3,686
SL: 3,695
TP: 3,665 – 3,645
Sell Zone ATH NEW
Entry: 3,717 – 3,719
SL: 3,727
TP: 3,706 – 3,690 – 3,675
⚓ Captain’s Note
“The Golden sails caught wind as the FED cut rates, but Powell’s headwind slowed the advance. Golden Harbor 🏝️ (3,663 – 3,629) is the pivot dock to decide the next course. If it holds, the ship may rebound to test Storm Breaker 🌊 (3,684 – 3,719) . If it breaks, the ship will retreat deeper to gather strength. For now, Quick Boarding 🚤 should only be done at strong resistance, while the larger voyage still leans northward.”

FED countdown | Buy at support, Sell at resistanceXAU/USD – 17/09 | Captain Vincent ⚓
🔎 Captain’s Log – News Context
18/09, 01:00 (US time): FED rate decision + Dot Plot → policy outlook for upcoming meetings
01:30: Powell’s speech – the key market focus
Market consensus: FED almost certain to cut -25bps. However, the -50bps scenario still exists → if it happens, it will be a “big boost” for Gold
During Asia–Europe session, Gold faced early profit-taking, dropping quickly to 3,677 – 3,675, reflecting caution ahead of the FED
⏩ Captain’s Summary
Gold is making a technical pullback before the FED.
Medium-term trend remains bullish, but patience is needed to wait for better Buy entries.
📈 Captain’s Chart – Technical Analysis
Storm Breaker (Resistance / Sell Zone)
Nearby OB: 3,693 – 3,695 (short scalp)
ATH Zone: 3,717 – 3,720 (strong resistance, potential heavy selling)
Golden Harbor (Support / Buy Zone)
Shallow Dock: 3,656 – 3,657 (short-term)
Main Harbor: 3,629 – 3,630 (trendline confluence + old BoS)
Market Structure
Multiple BoS confirm bullish trend
Price retracing to support, likely to bounce back and test 3,693 – 3,717
Break above 3,720 → confirms new ATH
🎯 Captain’s Map – Trade Plan
✅ Buy (priority)
Buy Zone 1
Entry: 3,656 – 3,657
SL: 3,648
TP: 3,675 – 3,693 – 3,717
Buy Zone 2
Entry: 3,629 – 3,630
SL: 3,618
TP: 3,656 – 3,690 – 3,717
⚡ Sell (only at resistance)
Sell Zone OB
Entry: 3,693 – 3,695
SL: 3,705
TP: 3,690 – 3,685 - 3680 - 368x - 36xx
Sell Zone ATH
Entry: 3,717 – 3,720
SL: 3,727
TP: 3,715 – 3,710 – 3,705 - 37xx
⚓ Captain’s Note
“Before the FED countdown, profit-taking waves pulled the Golden ship toward Golden Harbor 🏝️ (3,656 – 3,629) .
Yet the main current still flows north, the bullish trend remains intact.
Storm Breaker 🌊 (3,693 – 3,720) is the big wave, suitable for short Quick Boarding 🚤 scalps.
Sailors must stay patient – the FED wind could be the force to propel Gold to new peaks.”

FED shaken by politics | Gold eyes new ATH🟡 XAU/USD – 16/09 | Captain Vincent ⚓
🔎 Captain’s Log – News Context
FED & US Politics :
S. Miran elected to the FED Board but still serves as Trump’s economic advisor → concerns FED may face White House influence.
Michelle Mills elected with a narrow 48–47 margin.
Appeals Court blocked Trump from firing L. Cook, affirming FED’s independence, but raising the risk of a legal battle at the Supreme Court.
US Economy :
6:30 AM (US time): Retail Sales release – key consumer spending indicator.
Probability of a -50bps FED cut this week is down to 1.2% , nearly ruled out. FED is almost certain to deliver -25bps next week.
⏩ Captain’s Summary : Politics create noise, but the macro backdrop (FED easing + weak US data) remains the tailwind supporting Gold’s journey toward new ATH.
📈 Captain’s Chart – Technical Analysis
Storm Breaker (Resistance / Sell Zone) :
3706 – 3714 (Fibonacci resistance)
3722 – 3724 (Strong Sell Zone, potential ATH test)
Golden Harbor (Support / Buy Zone) :
FVG Dock: 3666 – 3668
OB Harbor: 3643 – 3645
Strong Low: 3611 (deep support)
Market Structure :
After a series of BoS , Gold broke out of sideways EqH/EqL and surged.
Preferred scenario: retrace to FVG 3666 , then bounce toward 3714 – 3722.
If 3722 breaks successfully → confirms new ATH and extends bullish momentum.
🎯 Captain’s Map – Trade Plan
✅ Buy (priority)
Buy 1 (FVG)
Entry: 3666 – 3668
SL: 3657
TP: 3690 – 3706 – 3714 – 372x
Buy 2 (OB)
Entry: 3643 – 3645
SL: 3632
TP: 3666 – 3700 – 3714 – 372x
⚡ Sell (short scalp at resistance)
Sell Zone
Entry: 3722 – 3724
SL: 3732
TP: 3714 – 3706 – 3690
⚓ Captain’s Note
“The Golden ship has broken free from sideways waters and is heading toward new peaks. Golden Harbor 🏝️ (3666 – 3643) is the safe dock for sailors to gather strength before sailing further. Storm Breaker 🌊 (3722 – 3724) is the big wave, suitable only for short Quick Boarding 🚤 . With dovish winds from the FED, the Golden sails are set toward new ATH.”

Gold faces early selling pressure | Main trend still Buy🟡 XAU/USD – 15/09 | Captain Vincent ⚓
🔎 Captain’s Log – News Context
FED rate cut probabilities this week :
-25bps : 96.4% (up from 89.1%).
-50bps : only 3.0% (down sharply from 10.9%).
Trump : Announced more sanctions on Russia, urged NATO to stop buying Russian oil; also emphasized “the possibility of significant FED rate cuts.”
Key event today : New York Manufacturing Index at 1:30 (US time).
⏩ Captain’s Summary : The sharp drop in -50bps expectations caused early selling pressure on Gold this morning. But overall, FED is still certain to cut rates and inflation is cooling → the bigger trend continues to favor Buy .
📈 Captain’s Chart – Technical Analysis
Storm Breaker (Resistance / Sell Zone) : 3665 – 3670 (Weak High & upper cap).
Golden Harbor (Support / Buy Zone) : 3623 – 3603 – 3587.
Market Structure :
On H1, Gold is moving within a tightening triangle with EqH and EqL .
Main trend stays bullish, but needs a retest of support before rallying toward 3665 – 3670.
🎯 Captain’s Map – Trade Plan
✅ Buy (priority)
Buy Zone 1
Entry: 3623 – 3625
SL: 3612
TP: 3640 – 3650 – 3660 – 3665+
Buy Zone 2 (FVG)
Entry: 3603 – 3605
SL: 3592
TP: 3620 – 3640 – 3655 – 3665
Deep Buy Zone
Entry: 3587 – 3590
SL: 3575
TP: 3610 – 3630 – 3650
⚡ Sell (short scalp at resistance)
Sell Zone
Entry: 3665 – 3670
SL: 3678
TP: 3655 – 3645 – 3635 – 36xx
⚓ Captain’s Note
“The Golden ship faces headwinds this morning as sailors reduce expectations for a -50bps cut. But the larger sail remains filled with dovish FED winds, steering the voyage north. Golden Harbor 🏝️ (3623 – 3603 – 3587) is the safe dock to gather strength. Storm Breaker 🌊 (3665 – 3670) may raise waves, suitable for short Quick Boarding 🚤 . The main journey still favors Buy , waiting for the FED to blow more tailwind into the Golden sails.”

XAUUSD – Pennant Pattern Waiting for ConfirmationXAUUSD – Pennant Pattern Waiting for Confirmation
Hello Traders,
Gold started the week with a strong bounce of nearly 20 dollars after testing the ascending trendline. This move further confirms the Pennant Flag formation that is currently in play. The key now is to wait for a clear breakout from this structure to position trades effectively.
Bullish Scenario
A break above the upper trendline, with confirmation ideally above 3657, would signal continuation of the uptrend.
Best entry: around 3650, targeting 3680 in the short term.
Bearish Scenario
The 3627 level is critical. A breakdown below this zone, along with a close under nearby support, would validate the bearish case.
Traders can either enter directly on the break or wait for a retest around 3630 for a cleaner entry.
Downside targets could extend to 356x or even lower.
Medium-Term Buy Setup
The 3560 – 3564 zone remains an attractive area, aligning with an FVG and strong volume accumulation.
This is a medium-term buying opportunity, with stop-loss placed below 3544.
Requires larger account size (above $1000) due to wider stop distance, but offers higher reward potential while aligning with the broader bullish trend.
This is my outlook for gold today. Traders can take it as a reference and align it with their own setups.
If you trade gold regularly, you can follow me here and join my community to receive updates quickly when the price action changes.
👉 Wishing everyone a profitable and disciplined trading week with Gold.

Waiting for CPI & FED rate cut | Priority Buy at support🟡 XAU/USD – 11/09 | Captain Vincent ⚓
🔎 Captain’s Log – News Context
US PPI yesterday : Wholesale prices dropped sharply, below forecasts → strengthening expectations of a FED rate cut.
FED probabilities : 100% odds for a -25bps cut next week, and even 16% of investors bet on -50bps.
Today : US CPI & Jobless Claims – key data to assess inflation & labor, determining the specific cut.
⏩ Captain’s Summary : FED will certainly cut rates, so Gold remains supported in its bullish trend. Short-term fluctuations may occur due to sentiment or surprises (e.g., tariff news from Trump).
📈 Captain’s Chart – Technical Analysis
Storm Breaker (Resistance) :
Bearish OB: 3645 – 3650 (near-term resistance)
Weak High: 3674 (target if breakout succeeds)
Golden Harbor (Support) :
Near support: 3622
FVG Dock: 3603
Bullish OB: 3581 – 3585 (strong mid-term support)
Market Structure :
H1 shows a short-term bearish BoS, retesting support.
Main trend remains bullish → possible pullback to 3622 or 3603 before rallying toward 3670+.
🎯 Captain’s Map – Trade Plan
✅ Buy (priority with trend)
Entry 1 (FVG): 3603 – 3605
SL: 3592
TP: 3610 – 3615 – 3625 – 365x
Entry 2 (Bullish OB): 3581 – 3585
SL: 3572
TP: 3600 – 3620 – 3640
⚡ Sell (only short scalp at resistance)
Sell Zone: 3645 – 3650
SL: 3658
TP: 3635 – 3628 – 3622
⚓ Captain’s Note
“The Golden sails remain full of wind as the FED is almost certain to cut rates. Golden Harbor 🏝️ (3622 – 3603) and the deeper OB 3581 – 3585 are safe havens to follow the bullish tide. If the ship touches Storm Breaker 🌊 (3645 – 3650) , only Quick Boarding 🚤 short scalps are recommended. The larger voyage still heads north, steering Gold toward new highs at 367x.”

XAU/USD – Captain Vincent Update | 15m Outlook🔎 Captain’s Log – Market Structure
On the 15-minute timeframe (M15) , price just formed a Break of Structure (BoS) above the previous accumulation zone → confirming temporary control by the Buy side.
However, the Bearish Order Block (H1 Zone) around 3655 is being tested, marking a key resistance area.
📈 Captain’s Chart – Bullish Scenario
If price holds above the OB zone 3644 – 3655 , buying pressure may continue to push the ship toward the Weak High 3674 .
Further ahead, the next destination is Storm Breaker Peak (3701 – 3708) – where strong selling reactions are expected.
📉 Captain’s Chart – Bearish Scenario
After sweeping liquidity and touching the Storm Breaker (Sell Zone) , Gold may reverse lower.
Key level to monitor: OB 3644 . If this area breaks, the market could open a deeper bearish leg.
🎯 Captain’s Map – Key Levels
Golden Harbor (Support) : 3644 – 3655 (OB retest zone)
Target (Bullish) : 3674 → 3701 – 3708
Storm Breaker (Sell Zone) : 3701 – 3708
Invalidation : Break below 3644 opens a new bearish journey
⚓ Captain’s Note
“The Golden sails have just caught new wind after a BoS , showing that the captain and crew still hold a short-term advantage. Golden Harbor 🏝️ (3644 – 3655) is the key dock to sustain the bullish trend. If Gold clears the Weak High 3674 , the ship may head straight to Storm Breaker 🌊 (3701 – 3708) , where reversal waves are likely to rise. While the short-term tide remains bullish, Storm Breaker still hides major risks – sailors must sail with strict risk management discipline.”

Gold Plan - Waiting for a pullback to Buy safely | New ATH ahead🟡 XAU/USD – 09/09 | Captain Vincent ⚓
🔎 Captain’s Log – News Context
FED : The probability of a September rate cut is now almost certain, reinforcing confidence that flows will continue moving into Gold.
Dollar : Dropped to a 7-week low due to FED rate cut expectations, adding further support for Gold.
US Economic Data : No major news today, the market focus remains on interest rates.
⏩ Captain’s Summary: Gold remains in a strong uptrend. However, Vincent advises waiting for a pullback into support to Buy safely , avoiding chasing price at higher levels.
📈 Captain’s Chart – Technical Analysis
Storm Breaker (Resistance / Sell Zone) :
Quick Boarding: 3654 – 3656 (Short-term Sell scalp)
Storm Breaker Peak: 3673 – 3675 (Sell zone – potential new ATH)
Golden Harbor (Support / Buy Zone) :
Buy Scalp Dock: 3615 – 3617
Main Golden Harbor: 3597 – 3599 (Strong support)
Price structure remains bullish after multiple BOS – Break of Structure. Current highs may trigger short-term profit-taking waves before Gold pulls back to Golden Harbor and then rallies toward ATH 367x .
🎯 Captain’s Map – Trade Scenarios
✅ Golden Harbor (BUY – Priority with trend)
Buy Scalp: 3615 – 3617 | SL: 3598 | TP: 3620 → 3623 → 3626 → 3630 → 36xx
Main Buy Zone: 3597 – 3599 | SL: 3589 | TP: 3660 → 3663 → 3666 → 3670 → 36xx
⚡ Quick Boarding (SELL Scalp – Only at resistance)
Sell Zone 1: 3654 – 3656 | SL: 3662 | TP: 3650 → 3647 → 3644 → 3640 → 36xx
Sell Zone 2 – Storm Breaker Peak (ATH test): 3673 – 3675 | SL: 3682 | TP: 3670 → 3667 → 3664 → 3660 → 36xx
⚓ Captain’s Note
“The interest rate winds from the FED continue to power the Golden sails. Golden Harbor 🏝️ (3597 – 3599) is the safe haven for sailors trusting the bullish tide. Quick Boarding 🚤 (3615 – 3617) is just a short ride before the voyage resumes. Storm Breaker 🌊 (3654 – 3675) may bring big waves, but it’s only suitable for technical scalps – as the main current still carries Gold toward new highs.”

GBP/USD Rising Wedge Breakdown PotentialThe GBP/USD 30-minute chart shows price moving within an ascending trendline but recently stalling near resistance around 1.3550–1.3560. The Ichimoku cloud suggests weakening bullish momentum, with price struggling to sustain above the support line.
Bearish Setup: A breakdown below the ascending trendline and cloud support around 1.3500 could trigger stronger downside pressure.
Targets: If selling momentum continues, price may test the 1.3420 and 1.3395 support levels.
Stop Loss: A safe invalidation zone lies above 1.3550–1.3560, where further upside would invalidate the bearish scenario.
🔎 Overall, GBP/USD looks vulnerable to a short-term pullback unless it reclaims strong bullish momentum above 1.3550.

Gold Trading Scenario – Start of the WeekGold Trading Scenario – Start of the Week
Hello traders,
A new week begins with gold holding above the 34xx zone, establishing a fresh value area. The current structure has already broken through major resistance levels on the higher timeframe – including trendline and H4 barriers – confirming strong bullish momentum.
The uptrend played out exactly as expected, reaching the target around 3450 (specifically 3454). Now price is seeing a mild pullback. This will only be considered a trend reversal if price breaks below 3404. Otherwise, it is just a secondary correction as per Dow theory.
Wave 5 may be complete, but the ABC structure is still unclear. For that reason, the plan is to continue with long positions in line with the trend, which increases the probability of success.
Buy zone for today: 3408–3412, an area where sellers previously failed at resistance and which was broken through the trendline on Friday.
This is my outlook for Monday, viewed from a medium-term perspective. Take it as reference, and feel free to share your thoughts in the comments.

XAUUSD Price Action Analysis Current Market Overview
Price is trading at 3,371.67 🟢, showing bullish momentum after bouncing from the highlighted support zone (purple box).
The support zone (3,358 – 3,348) is currently holding strongly, converting old resistance into support 🔄.
🔑 Key Levels to Watch
Support Zone (3,358 – 3,348) 🛡️ → Price respected this area, confirming it as a demand zone.
Immediate Support: 3,358.65 🟪
Secondary Supports: 3,348.60 📉 | 3,325.99 📉 | 3,311.63 📉
📈 Bullish Scenario
If buyers maintain momentum above 3,358, price may attempt a move toward 3,380+ 🚀.
Break above 3,380 could signal continuation to new highs 📊✨.
📉 Bearish Scenario
A strong break back below 3,358 could re-test 3,348 → 3,325 → 3,311 ⬇️.
Failure to hold support may trigger deeper correction.
✅ Professional Takeaway
Market sentiment is bullish as long as price stays above 3,358 support zone 🟩.
Traders may look for buy opportunities on dips near support with targets toward 3,380 – 3,390 🎯.
Watch price reaction closely at the purple zone for confirmation before entering.

Gold (XAU/USD) Short-Term Bearish Setup1. Well-Defined Resistance Zones
Two horizontal shaded areas labeled Resistance R1 and Resistance R2 mark zones near $3,360–$3,380, where price repeatedly failed to break higher.
Trading ideas from analysts on TradingView reinforce that the immediate resistance lies around $3,364–$3,370. As long as price stays below that, sellers remain in control
TradingView
+1
.
2. Descending Channel & Bearish Momentum
The chart highlights a shift from an earlier ascending channel (green), followed by breakdown and decline — a classic reversal from bullish to bearish.
In line with this, there’s also mention of a bearish flag pattern forming on the 30-minute (M30) timeframe, offering a potential shorting opportunity
TradingView
+1
.
3. Key Support Levels & Targets
Multiple support levels annotated: Support S2 (at two levels) and Support S3, with notable levels around $3,315, $3,301–$3,302, and $3,300.
The annotated price action indicates projected declines toward those levels—especially highlighting $3,314.94, $3,301.55, and $3,300.96 as intermediate and key targets.
Ultimately, the red “High support area” below suggests a broader demand zone, perhaps around $3,280–$3,300, where stronger support may emerge.
4. Trading Plan Illustrated
White arrows depict a descending trajectory: from current levels down to each support, suggesting a sell-on-rally approach.
Blue markers denote possible bounce points for pullbacks before continuation lower.
Broader Market Context
Gold prices have recently been tracking in the $3,330–$3,350 range, facing resistance near $3,350–$3,360 and support near $3,300. Analysts caution that a break below that could push it toward $3,245 or $3,150–$3,120
TradingView
+1
.
Overall momentum has turned cautious or bearish—bearish engulfing patterns, weakening rally strength, and below-average technical indicators emphasize the risk of further declines
FXEmpire
+2
FXEmpire
+2
.
Weak U.S. economic indicators or dovish signals from Fed officials (like Powell) could offer brief relief rallies; but failure to reclaim resistance may extend the slide
FXEmpire
+1
.
Key Levels at a Glance
Level Type Price Range Notes
Resistance ~$3,350–$3,360+ Strong ceiling—decline confirms bearish bias
Support S1 ~$3,315–$3,320 First potential reaction zone
Support S2 ~$3,301 Intermediate target for sellers
Support S3 ~$3,300 Psychological barrier; near high support zone
High Support Area ~$3,280–$3,300 Zone where bullish buyers might regroup
Conclusion
Your chart effectively captures a short-term bearish trend in gold (XAU/USD), showing:
Failed attempts to overcome resistance near $3,360.
A bearish flag breakout signaling potential continuation downward.
Clearly plotted support targets, with bounce zones drawn out.
A visual trade plan suggesting sell-on-rallies targeting declining support levels until reaching a strong demand zone.
To succeed with this setup, traders might wait for a brief rally into one of the identified sell zones (e.g. ~$3,314 or $3,325) before entering shorts, with stop-loss placements above the resistance areas and profit objectives aligned with support levels ($3,301 or near $3,300).

EURUSD after NFPFollowing Friday’s NFP release, EURUSD flipped bearish structure. I’m now looking for a retracement into a key demand zone, where I’ll be watching for buy setups.
Until then, I’ll look for a possible sell-to-buy scenario — shorting the move down into demand, and then reassessing for bullish confirmation.
Let’s see how price reacts on Monday.

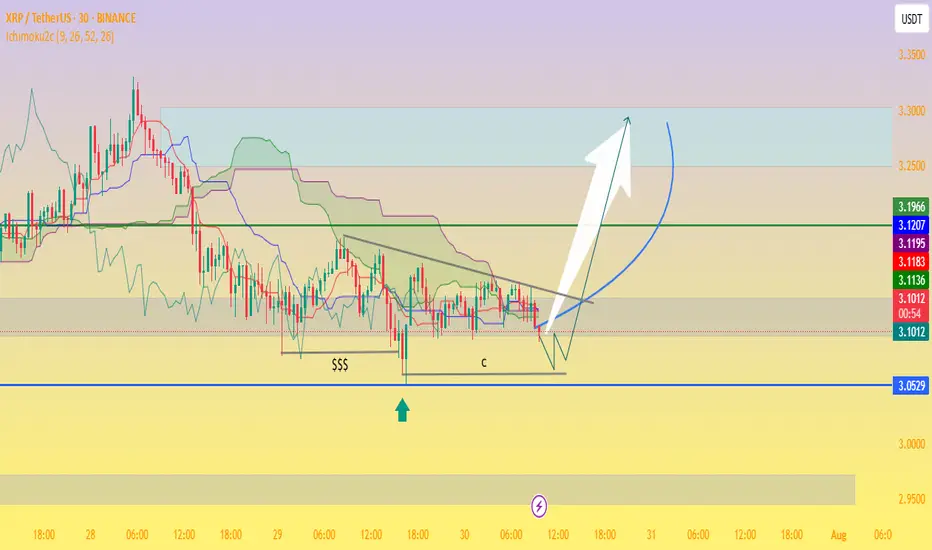
XRP/USDT Potential Reversal Zone — “Bottom Tested, Bullish!📉 Chart Analysis Summary
The divided chart indicates XRP trading between a critical support zone near $3.05–$3.09 and overhead resistance around $3.19–$3.23, forming what could be a bullish pennant or descending wedge setup on the 30-minute timeframe:
Support Zone (~$3.05–$3.09):
Price retested this level multiple times (labeled as “$$$” and “c”), clearly identifying a demand zone.
Ichimoku cloud support lies nearby, adding technical relevance to the floor.
Resistance Trendline & Green Line (~$3.19–$3.23):
A descending trendline is visible, showing lower highs and building compression.
A breakout above this resistance zone is necessary to signal bullish continuation.
Projected Path:
The schematic arrow suggests a bounce off support, followed by consolidation, and then a breakout above resistance, targeting the $3.25–$3.30+ zone and potentially higher.
🔍 Context from Recent Market Commentary
Support Holding Above $3.11–$3.15: Analysts highlight strong support around $3.11–$3.15, where institutional and retail interest appears concentrated
TradingView
+13
TradingView
+13
CoinCentral
+13
.
Resistance & Consolidation at $3.30: While XRP briefly surpassed $3.30, it encountered rejection and remains rangebound. A confirmed break beyond this level could validate the bullish carry-forward
CryptoPotato
CoinDesk
.
Wave-Elliott Bull Case: Various Elliott Wave scenarios forecast targets as high as $5.25, $6.85, or even $10–$15 should Wave 5 materialize, though this depends on market strength and momentum
CoinCentral
.
✅ Trading Outlook
Bullish Scenario:
Bounce off $3.05–$3.15 support.
Break above $3.23–$3.30 resistance.
Potential upside targets:
Near term: $3.30–$3.40.
Medium term: $4.64 or $5–$6, with strong case for $6.85 if momentum and on-chain demand strengthen
CryptoPotato
+15
TECHi
+15
CoinGape
+15
.
Bearish Scenario:
Failure to hold $3.05–$3.11 risk retest toward $2.95 or lower zones ($2.30–$2.70)
TECHi
.
🧭 What to Watch
Key Level Role
$3.05–$3.11 Critical support/demand zone
$3.19–$3.23 Short‑term resistance/framing compression
~$3.30+ Confirm bullish breakout — key trigger for Wave 5 and higher targets
🧠 Overall Take
This chart is painting a classic consolidation near strong support with a visible descending upper boundary. If XRP holds the ~$3.05 zone and breaks above $3.23–$3.30 with conviction, it could initiate a bull move toward $3.40–$4.00, and potentially even $5–$6+ depending on volume and momentum.
However, breaks below $3.11 may open deeper downside risk. For many traders, this is a simple risk-reward setup: entry near the lower channel with a stop under $3.05 and initial profit targets at $3.30–$3.40.
Is a Pullback Coming or Will the Bulls Continue?Gold Faces Resistance at 3300 – Is a Pullback Coming or Will the Bulls Continue?
Market Overview: USD Gains Pressure Gold as Trade Deals Unfold
Gold has been under pressure recently due to the strong recovery of the US dollar. Positive developments in global trade talks and agreements between major nations, including the US, have been a key driver for the USD, which in turn has weighed on gold.
US inflation data continues to show signs of easing, providing the Fed more room to hold off on rate hikes, strengthening the USD.
FOMC meeting minutes due this week will provide further insight into the Fed’s approach to interest rates.
With geopolitical tensions easing and trade deals stabilizing, the demand for safe-haven assets like gold is slightly reduced.
In the short-term, the market is testing crucial levels, and while gold remains bullish in the long run, the current market conditions suggest potential for a pullback before further upside.
Technical Analysis: Gold in a Range-Bound Market
Looking at the H1 timeframe, gold has formed a clear downward channel between 3360 and 3290, which could signal further corrective action if the price remains within this range. If gold fails to break above resistance at 3360, a dip to 3250 might occur, especially if the USD strength continues to put pressure on gold.
However, waiting for confirmation patterns before entering a trade is key. False breakouts can be a risk when price moves quickly through key levels without sustaining momentum.
Buy Bias in Short-Term with Caution on Bearish Moves
Given the current market structure, there is more room for buy opportunities than for selling at the moment. Watch out for a potential bounce back in the 3320-3325 region as gold might test these levels before continuing its rise. The rejection wick on yesterday's D1 candle shows that the sellers are losing control, and buying pressure is starting to build again.
In the M30 chart, there's a continuation pattern forming around the 16-14 zone, which could be an ideal place to enter a buy position if it holds.
Resistance and Support Levels:
Key Resistance Levels: 3302 – 3310 – 3324 – 3335 – 3361
Key Support Levels: 3275 – 3259 – 3248
Trading Strategy – Buy and Sell Zones
BUY ZONE:
3250 – 3248
Stop Loss: 3244
Take Profit: 3254 → 3258 → 3262 → 3266 → 3270 → 3280 → ????
SELL SCALP:
3303 – 3305
Stop Loss: 3310
Take Profit: 3298 → 3294 → 3290 → 3286 → 3280 → 3270 → 3260
SELL ZONE:
3334 – 3336
Stop Loss: 3340
Take Profit: 3330 → 3326 → 3320 → 3315 → 3310 → 3305 → 3300 → ????
Key Updates to Watch: FOMC and Trade Policy News
With FOMC minutes due and trade policy developments on the horizon, it’s crucial to stay alert for any shifts in market sentiment. Ensure you stick to TP/SL levels to protect your account from any unexpected volatility.

XAU/USD Double Bottom Breakout Bullish Momentum Incoming!🔄 XAU/USD Double Bottom Breakout 💥 | 🚀 Bullish Momentum Incoming!
Analysis:
🟡 Double Bottom Pattern: Two clear lows have formed around the $3,340 support, signaling a potential reversal.
🟦 Accumulation Zone: The price consolidated in a range, indicating strong buying interest before the breakout.
🟣 Bullish Momentum: Recent aggressive bullish candles show strong buying pressure.
📈 Breakout & Retest Zone: If the price holds above $3,370, a bullish continuation toward $3,409 and possibly $3,445 is expected.
🧭 Target Area: Marked with a blue box, the upside potential is clearly projected.
Conclusion:
A successful retest of the breakout level may lead to a strong bullish run. Keep an eye on $3,370 as the pivot zone. 🎯

Support and Resistance Support Level:
A price level where demand is strong enough to prevent the price from falling further. It's like a floor—buyers enter here expecting prices to rise.
Example: If Nifty falls to 22,000 repeatedly and bounces back, 22,000 becomes a support level.
🔹 Resistance Level:
A price level where selling pressure overcomes buying, preventing prices from rising. It's like a ceiling—sellers dominate at this level.
Example: If Bank Nifty rises to 50,000 but fails to move above, 50,000 is resistance.
📊 How to Identify Them:
Historical price charts
Trendlines
Moving averages
Fibonacci levels
Volume analysis
📈 Use in Trading:
Buy near support
Sell near resistance
Use breakout strategy when price breaches either level

XAU/USD Technical Analysis for Next Week (May 18–23, 2025)
# The following technical analysis for XAU/USD (Gold/US Dollar) is based on current market conditions, recent price action, and insights, focusing on key levels, trends, and potential price movements for the upcoming week. This analysis integrates technical indicators, support/resistance levels, and market sentiment while critically examining the data for a balanced outlook.
# Current Market Overview
Price as of May 17, 2025 closed around $3,204
Recent Price Action: Gold has experienced a sharp decline from highs near $3,430–$3,500, dropping to a one-month low below $3,200. Unable to close below support level $3,163
A corrective bounce has occurred, with prices testing key support zones in 4 hour time frame.
# Market Sentiment: Mixed, with short-term bearish pressure due to fundamental factors (e.g., US-China tariff truce, Fed's hawkish stance) but potential bullish triggers from renewed dollar weakness or geopolitical shocks. Technical indicators show neutral to bearish signals, with some bullish setups emerging on lower timeframes. (4-Hour)
Key Support and Resistance Levels given in the chart for your reference

basic of support and resistanceSupport occurs at the point where a downtrend is expected to pause due to a concentration of demand. Resistance occurs at the point where an uptrend is expected to pause due to a concentration of supply. Support and resistance areas can be identified on charts using trendlines and moving averages.

overview of financial marketsFinancial Markets include any place or system that provides buyers and sellers the means to trade financial instruments, including bonds, equities, the various international currencies, and derivatives. Financial markets facilitate the interaction between those who need capital with those who have capital to invest

USDINR By KRS Charts 11th March 2025 / 7:24 PM
Why USDINR?
1. Wave Count is Clearly showing that USDINR is in Correction Wave.
2. FVG - Fair Value Gap is Visible + Price is also reacting as per both the theory.
3. 1:3 Risk/Reward
TARGET - Impulsive 4th Wave Level Depth
SL - FVG is Upper Band Closing Basis

The “Pain Threshold” Concept & Why It Ruins Traders!Hello Traders!
Ever felt that unbearable urge to close a trade just because you "can’t take it anymore"? That’s your Pain Threshold kicking in—a psychological limit where traders make emotional, irrational, and costly mistakes. Understanding and managing this concept is key to long-term trading success. Let’s dive into why the Pain Threshold ruins traders and how to overcome it!
1. What is the "Pain Threshold" in Trading?
The Pain Threshold is the moment when traders can no longer tolerate a trade’s loss or drawdown, leading them to exit prematurely, overtrade, or revenge trade.
It’s a psychological trigger that causes traders to abandon rational decision-making, leading to impulsive actions that damage their account.
This emotional breaking point happens because of fear, over-leverage, poor risk management, or simply a lack of discipline.
2. How the Pain Threshold Destroys Your Trading?
Cutting Winning Trades Too Early: Traders exit profitable trades too soon, fearing that the market will reverse.
Holding Losing Trades Too Long: Instead of cutting losses, traders hope for a reversal, leading to massive drawdowns.
Overtrading & Revenge Trading: After a painful loss, traders jump into new trades emotionally, without proper setups.
Ignoring Trading Plans & Strategies: Traders abandon their pre-planned stop-loss and target levels because emotions take over.
Blowing Up Accounts: When pain crosses a threshold, traders make reckless decisions, like doubling down on bad trades.
3. How to Overcome the Pain Threshold & Trade Like a Pro?
Accept That Drawdowns Are Normal: Losses happen even to the best traders— treat them as part of the game.
Use Proper Position Sizing: If a loss feels unbearable, your lot size is too big. Reduce risk per trade.
Predefine Your Risk Before Entering Trades: Set a fixed stop-loss and take profit —and stick to it!
Detach Emotionally from Your Trades: Don’t get emotionally attached to any single trade—focus on the long game.
Develop a Systematic Approach: Follow a trading plan based on data, not emotions.
Take Breaks When Needed: If emotions are high, step away— the market isn’t going anywhere!
4. The Secret: Raise Your Pain Threshold Like Pro Traders!
Trade Small Until You Build Confidence: Reduce risk until you’re mentally comfortable holding trades longer.
Use a Trading Journal to Track Emotional Mistakes: Review past trades to understand when emotions affected your decisions.
Practice Holding Trades According to Your Plan: The longer you stay disciplined, the stronger your pain tolerance becomes.
Accept That the Market is Unpredictable: No one wins every trade— focus on consistency, not perfection.
Conclusion
The Pain Threshold is the silent killer of trading accounts, forcing traders into emotional decisions that ruin profitability. Instead of falling into the trap of fear and impulse reactions, train yourself to handle market fluctuations with a rational, disciplined approach.
Have you ever closed a trade too early or held onto a bad one for too long? Let’s discuss below!
