Indraprastha Medical Ltd | Bullish Flag Breakout | Swing SetupCompany Overview (Fundamental)
Indraprastha Medical Corporation Ltd (IMCL) operates under the Apollo Hospitals Group and manages the Indraprastha Apollo Hospital, New Delhi — one of India’s largest multi-specialty hospitals. Company financially strong, consistent profitability, improving margins, and low debt.
Fundamentally stable company with consistent earnings and a defensive sector (Healthcare).
Strong base for technical breakout follow-through.
💰 Market Cap: ~₹5,400 Cr
📈 Revenue Growth (YoY): +16% (Strong Growth)
💸 Net Profit Margin: ~10–12% (steady)
💵 Debt-to-Equity: 0.05 (virtually debt-free)
📊 ROE (Return on Equity): ~20%
Technical Overview
The setup represents a bullish continuation phase, with EMAs stacked positively and volume confirming accumulation.
Price trades above all 3 key EMAs (9, 20, 50) — strong bullish alignment.
Formation of a textbook Bullish Flag Pattern after a sharp pole rally from ₹460 to ₹610.
Recent candle closed bullish with +3.4% gain and high volume (2.48M) — indicating renewed buying interest.
RSI ~60 → Momentum healthy and not overbought.
MACD positive crossover developing, confirming bullish trend strength.
Price Action Analysis
Clean, bullish, momentum-driven move with volume confirmation.
Buy on dip near breakout retest at ₹580-583
Book Partial profit at ₹625–630
target 2: ₹655–660 this will be Flag breakout projection.
A perfect risk to reward ratio following.
Disclaimer
This analysis is for educational and research purposes only — not investment advice.
Always do your own due diligence and manage risk before trading.
Fundamental Analysis

Nifty outlookBased on nifty performance, Index looks like double top near 26000!. After a tremendous bull run in the month of October reached new 52 week high. Despite this run even on monthly expiry day nifty failed to reach all time high!!. After that fed action failed to fuel the bulls. I think till next trigger like Bihar election, US - India trade deal nifty will oscillate in a range between 26100 - 25500

Nifty Outlook Based on nifty performance, Index looks like double top near 26000!!. After a tremendous bull run in the month of October reached new 52 week high. Despite this run even on monthly expiry day nifty failed to reach all time high!!. After that fed action failed to fuel the bulls. I think till next trigger like Bihar election, US - India trade deal nifty will oscillate in a range between 26100 - 25500

🇺🇸 IMPACT OF FED AFTER FOMC DECISION🇺🇸 IMPACT OF FED AFTER FOMC DECISION
Hello traders,
The latest Federal Reserve rate decision shook global markets — pushing Gold (XAUUSD) and Bitcoin lower while the US Dollar strengthened sharply.
The Fed cut interest rates for the second time this year, bringing them down to 3.75%–4%, but the announcement to end Quantitative Tightening (QT) by 1st Dec 2025 was the real game changer.
This is the moment to stay calm, read the market structure, and act according to your plan.
📰 MACRO ANALYSIS – THE FED’S DOUBLE IMPACT
Rate Cut (Normally Bullish for Gold):
The second rate cut should, in theory, support Gold prices. However, much of this was already priced in before the announcement.
QT Ending (USD Strength Booster):
Ending QT signals that the Fed is trying to rebalance its monetary stance. This boosted the US Dollar Index (DXY), putting heavy selling pressure on both Gold and BTC.
Market Reaction:
Gold saw a sharp drop right after the announcement, then moved sideways in a wide range. During today’s Asian session, Gold fluctuated nearly $70 before retracing slightly.
📊 TECHNICAL OUTLOOK – WIDE RANGE, BUILDING BULLISH STRUCTURE
Looking at the current XAUUSD market structure:
Structure: Gold is currently consolidating in a wide range. However, a bullish structure seems to be forming with higher lows — a sustainable Dow-style uptrend pattern.
Trading Plan: Stay flexible and trade both sides —
🔴 Sell (Short) near liquidity resistance zones.
🟢 Buy (Long) from deep liquidity supports.
🎯 TRADING ACTION PLAN
🔴 SELL CONTINUATION – Short from Resistance
Entry Zone: 4005
Stop Loss: 4013
Targets:
TP1: 3990
TP2: 3975
TP3: 3960
TP4: 3943
🟢 BUY RECOVERY – Long from Support
Entry Zone: 3907–3909
Stop Loss: 3902
Targets:
TP1: 3933
TP2: 3954
TP3: 3970
TP4: 3999
⚖️ FINAL THOUGHTS
The Fed’s decision has reshaped the short-term outlook.
A $70 volatility range shows Gold’s high liquidity — but also high risk.
📌 LiamTrading’s Note:
A strong bullish structure is building up on the lower timeframes. Patience is key — wait for the ideal Buy zone near 3907 to catch the next recovery leg.
Always maintain strict risk and capital management, especially during post-FOMC volatility.
Are you ready to ride this 70-dollar range?
👉 Tap LIKE 👍 and COMMENT your setup!

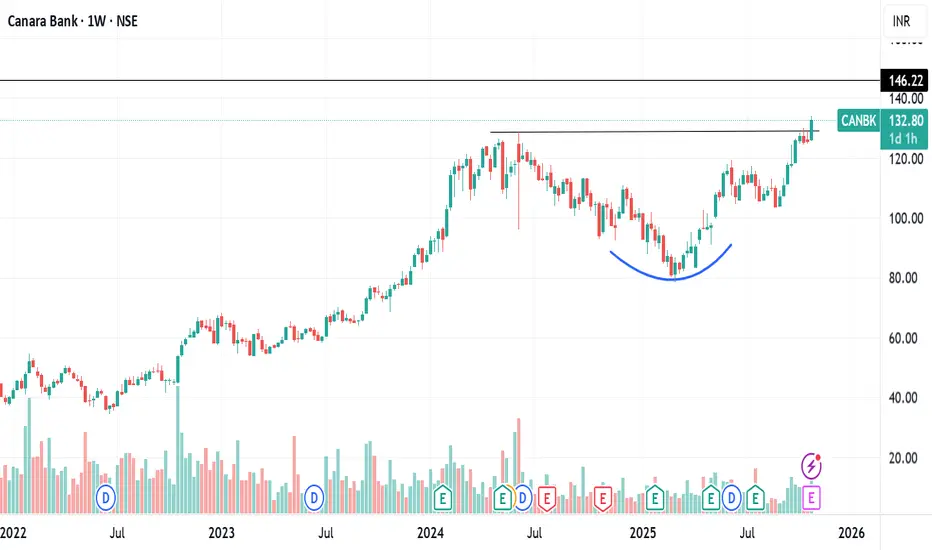
CANARA BANK ROUNDING BOTTOM BREAKOUTCanara bank breaking rounding bottom weekly
with huge volume this week
RSI above 60 bullish
heading towards 15 yr high
q2 net profit rises 19% +ve
target 146 then can lead to ATH 164 also
NO BUY/SELL RECOMENDATION
Gold Spot Ready For Big Move in Coming Days - 30 October 2025Gold prices may see a major breakout soon. Traders eye upcoming data and Fed signals for the next big move in the gold spot market.

Solarium Green Energy LtdDate 30.10.2025
Solarium Green Energy
Timeframe : Day Chart
About
It is solar energy company which specializes in integrated solar solutions and turnkey services
Revenue Breakup
(1) Residential Rooftop Projects ~23%
(2) Commercial, Industrial & Ground Mounted Projects ~ 4%
(3) Government Projects ~34%
(4) Solar PV Inverters ~4%
(5) Solar PV Modules ~32%
(6) Other Solar Products ~3%
Geographical Revenue Split
(1) Gujarat ~79%
(2) Delhi ~5%
(3) Maharashtra ~4%
(4) Rajasthan ~4%
(5) Karnataka ~2%
(6) Tamil Nadu ~2%
(7) West Bengal ~2%
(8) Others ~2%
Projects Undertaken (in last 3 years)
(1) 11,195 Residential rooftop projects
(2) 189 projects under Commercial and Industrial
Order Book
(1) Company has 39 projects worth ₹185.07 Cr
(2) Current bids for under government projects worth ₹885.36 Cr
(3) L1 bidder for projects worth ₹60.36 Cr, awaiting official approvals
Valuations
(1) Market Cap 686 Cr
(2) Stpock Pe 36.8
(3) Roce 20%
(4) Roe 23%
(5) Book Value 4.5X
(6) Opm 12%
(7) Promoter 58.34%
(8) Profit Growth (TTM) 18%
Note* A bse listed company with good valuations & decent busniess spread
Regards,
Ankur

BLACKBUCK Price ActionAs of October 22, 2025, **Zinka Logistics Solutions Ltd (BlackBuck Limited)** traded around **₹733.50** on the NSE and **₹733.35** on the BSE, registering a **6% daily gain** from previous levels near ₹690. The stock hit an intraday high of about **₹748** and a low of approximately **₹699**, marking a fresh 52-week high zone. Its **market capitalization** stands near **₹13,250 crore**, reflecting strong growth momentum in investor sentiment this week.
Zinka’s **52-week range** is between **₹248.35 and ₹748**, showing a substantial multi-fold rally over the past year. The company’s **P/E ratio** is currently around **36.5**, while **P/B stands near 10.7**. The **RSI** hovers close to 68, indicating high momentum but nearing overbought levels, and all key moving averages (20-, 50-, and 200-day) remain aligned positively — confirming a continued uptrend.
From a technical view, the **immediate support zone** is placed near ₹705–₹710, with major resistance around ₹750. A breakout above ₹750 could extend the rally toward ₹780–₹800, while holding above ₹700 keeps the short-term structure constructive.
On the fundamental front, the firm recently reported a **72% quarter-on-quarter growth in consolidated revenue** and a **17% increase in profit year-on-year** for Q1 FY2025–26, supported by stronger digital logistics volumes and reduced operating expenses.
Overall, Zinka Logistics (BlackBuck) remains **firmly bullish in the short term** with upward bias, though minor profit-booking may occur near ₹750–₹760 before the next leg of momentum.

What Are MEME Stocks? The Viral Phenomenon Explained1. Understanding Meme Stocks
Meme stocks are shares of companies that gain sudden popularity and price surges primarily through social media hype rather than financial metrics. Platforms like Reddit (r/WallStreetBets), Twitter (now X), YouTube, and TikTok play a key role in spreading discussions, memes, and buying calls.
Unlike traditional stocks whose prices are influenced by earnings reports or macroeconomic indicators, meme stocks move largely on viral momentum. A meme stock’s rise often begins when a group of retail investors collectively decide to buy shares — not necessarily because the company has strong fundamentals, but because they believe they can drive up the price together.
This phenomenon democratized market influence, empowering small investors to move prices once thought controllable only by large institutions.
2. The Spark: GameStop and AMC Revolution
The meme stock phenomenon entered the mainstream in January 2021 during the GameStop (GME) short squeeze saga.
GameStop, a struggling American video game retailer, had been heavily shorted by hedge funds betting that its price would fall. Retail traders on Reddit’s r/WallStreetBets noticed this excessive short interest and decided to buy and hold GME shares en masse, creating a short squeeze — a scenario where short sellers are forced to buy back shares to cover their positions, driving prices even higher.
The stock skyrocketed from around $20 to nearly $500 within weeks.
Soon after, AMC Entertainment, BlackBerry, and Bed Bath & Beyond became part of the same movement. For many retail traders, this wasn’t just about profits — it was a symbolic battle of the small investor versus Wall Street elites. It represented a collective digital uprising, coordinated not by analysts or hedge funds but by memes, emojis, and hashtags.
3. How Social Media Fueled the Frenzy
The rise of meme stocks is inseparable from the influence of social media communities. Platforms like Reddit and Twitter became virtual trading floors, where users shared screenshots of trades, jokes about hedge funds, and rallying cries like “Hold the Line!” or “To the Moon!”.
Memes — humorous images or catchphrases — acted as emotional fuel. They simplified complex financial concepts into shareable content, creating a sense of belonging among retail traders. Instead of dry market analysis, posts often carried cultural energy, blending humor, defiance, and optimism.
Moreover, apps like Robinhood provided zero-commission trading and gamified interfaces, encouraging participation from young, first-time investors. This convergence of technology, humor, and finance birthed a new breed of traders who saw the market not only as a profit engine but also as a social movement.
4. The Psychology Behind Meme Stocks
At its core, the meme stock mania is as much about emotion as it is about economics. Several psychological forces drive this movement:
a) Fear of Missing Out (FOMO)
When investors see others posting massive profits online, they rush to join in before “it’s too late.” The viral nature of meme stocks amplifies this herd behavior.
b) The Power of Community
Online forums give traders a sense of unity. It’s not just about making money — it’s about belonging to a digital tribe with shared goals, humor, and enemies (often Wall Street).
c) Revenge Trading
For many, buying meme stocks was a symbolic act of resistance against institutional investors. The 2008 financial crisis left deep scars, and this movement became a way for retail traders to “fight back.”
d) Speculative Thrill
Meme stocks offer the excitement of massive short-term gains. The adrenaline rush from volatile price moves creates a gambling-like experience, which can be addictive.
e) The “Diamond Hands” Mentality
A popular meme phrase, diamond hands, refers to holding onto a stock despite volatility, symbolizing loyalty and resilience against selling pressure.
Together, these psychological drivers created a feedback loop — social excitement drove price rallies, and rising prices fueled even greater enthusiasm.
5. The Role of Technology and Retail Platforms
The meme stock revolution wouldn’t have been possible without the technological democratization of trading. Mobile apps like Robinhood, Zerodha, Groww, and Webull broke down barriers that once favored institutional players.
Key enablers included:
Zero-commission trading, making frequent transactions affordable.
Fractional investing, allowing users to buy parts of expensive shares.
Easy access to market data and real-time discussions.
Social trading communities, where users share strategies and screenshots.
Technology turned investing into a viral experience, merging finance with digital culture. What was once a Wall Street-exclusive domain became an open playground for anyone with a smartphone.
6. Fundamental vs. Sentimental Value
Traditional investors analyze fundamentals — revenue, profits, balance sheets, and future prospects. Meme stock traders, however, operate on sentimental value — the shared belief that a stock’s price can rise simply because enough people want it to.
In meme stocks:
Valuation is often disconnected from fundamentals.
Price is driven by social momentum rather than intrinsic worth.
Sentiment is volatile and can shift overnight.
This emotional market behavior challenges classic theories of efficient markets, suggesting that modern finance is also a theater of collective psychology.
7. The Aftermath: Volatility and Reality Check
While some early traders made fortunes, most late entrants faced heavy losses as prices crashed once the hype faded. For instance:
GameStop (GME) fell over 80% from its peak after the initial mania.
AMC Entertainment (AMC) also retraced most of its gains.
These crashes highlighted a crucial truth: momentum-based markets are unsustainable without continuous new demand. Meme stocks are often volatile and speculative, resembling short-term trading battles rather than long-term investments.
However, the phenomenon left an enduring mark — it revealed that collective retail investors can move markets, a notion once thought impossible.
8. Meme Stocks in India: A Growing Trend
While the meme stock craze originated in the U.S., India, too, is witnessing its own version. Platforms like Twitter (X), Telegram, and YouTube have become hubs where traders discuss small-cap or penny stocks that can “explode.”
Stocks such as Suzlon Energy, Vodafone Idea, Zomato, and Paytm have at times displayed meme-like behavior — where social buzz, not fundamentals, triggered sharp rallies.
This trend is especially visible among young investors who entered markets post-2020, drawn by social media content and a desire for fast profits. Though not as extreme as GameStop’s story, the Indian market’s growing retail participation shows similar psychological patterns — community-driven speculation, influencer effects, and herd excitement.
9. Risks and Regulatory Concerns
Meme stock trading brings both opportunity and danger. Regulators worldwide, including SEBI and the U.S. SEC, have raised concerns over market manipulation and misinformation.
Key risks include:
Extreme volatility, leading to rapid losses.
Pump-and-dump schemes, where influencers artificially inflate prices.
Emotional decision-making, ignoring risk management.
Platform restrictions, as seen when trading apps halted meme stock orders in 2021 due to liquidity stress.
Regulators now monitor online discussions and social trading platforms more closely to prevent coordinated manipulation.
10. Lessons for Investors
The meme stock era offers valuable takeaways for traders and long-term investors alike:
Understand Market Psychology: Price moves are not always rational. Emotions and narratives often overpower fundamentals.
Avoid Herd Mentality: Entering trades solely because “everyone else is doing it” can be disastrous.
Do Your Own Research (DYOR): Always analyze a company’s financial health before investing.
Diversify: Don’t put all your capital in one speculative play.
Separate Entertainment from Investment: Trading for fun is fine — but never risk money you can’t afford to lose.
11. The Cultural Impact of Meme Stocks
Beyond finance, meme stocks became a pop-culture event. They inspired documentaries, news debates, and even movies (like Dumb Money, released in 2023).
They also reshaped public perception of investing. Millions of young people who had never cared about the stock market began to see trading as accessible, even cool.
The term “stonks” (a humorous take on “stocks”) became a symbol of modern finance — blending irony, humor, and rebellion. Meme stocks thus bridged two worlds: Wall Street’s seriousness and the internet’s playfulness.
12. The Future of Meme Stocks
Will meme stocks fade away? Not entirely.
While the 2021 mania may not return in the same form, social-driven investing is here to stay. Platforms now integrate community discussions directly into trading apps, and sentiment analysis tools are being used by institutions to monitor online chatter.
In India, the rise of finfluencers (financial influencers) mirrors this global shift — where retail narratives can sway short-term market sentiment. Future meme stocks might emerge around trending sectors like renewable energy, EVs, or AI, driven by excitement and online buzz.
However, with greater awareness and regulation, the next wave may be more structured and transparent, balancing social energy with financial prudence.
Conclusion: The Meme Stock Legacy
The meme stock revolution redefined what it means to “invest.” It blurred lines between trading and activism, community and speculation, humor and finance.
It revealed a deeper truth — that markets are not just mechanical systems of numbers and charts, but human arenas of belief, behavior, and shared emotion.
While many lost money chasing viral trends, the movement empowered millions to learn, engage, and question long-standing power dynamics in finance.
In the end, meme stocks symbolize more than speculative chaos — they represent the digital democratization of investing, where anyone, anywhere, can shape the market narrative with nothing more than a smartphone, a meme, and a mission.

RBLBANK ( M ) BREAKOUTStock Name : RBL BANK ( M )
Friends, after a long time, this stock has broken out in the monthly time frame after about five years and eight months. This type of breakout is considered very strong and there are only two days left for the completion of this month's candle. So we can consider this as a complete breakout. If you look at the range of the breakout, it was Rs 180. Then you can add the stock to your watch list.
Target 1 : 396 - 400
Target 2 : 475 - 500
Note: Our posts are posted for learning purposes. You will be responsible for any profit or loss you make from the advice given in the channel. Before investing in the stock market, you must consult your financial advisor.
WE ARE NOT A SEBI REGISTERED

BUY TODAY SELL TOMORROW for 5%DON’T HAVE TIME TO MANAGE YOUR TRADES?
- Take BTST trades at 3:25 pm every day
- Try to exit by taking 4-7% profit of each trade
- SL can also be maintained as closing below the low of the breakout candle
Now, why do I prefer BTST over swing trades? The primary reason is that I have observed that 90% of the stocks give most of the movement in just 1-2 days and the rest of the time they either consolidate or fall
Cup & Handle Breakout in SAIL
BUY TODAY SELL TOMORROW for 5%

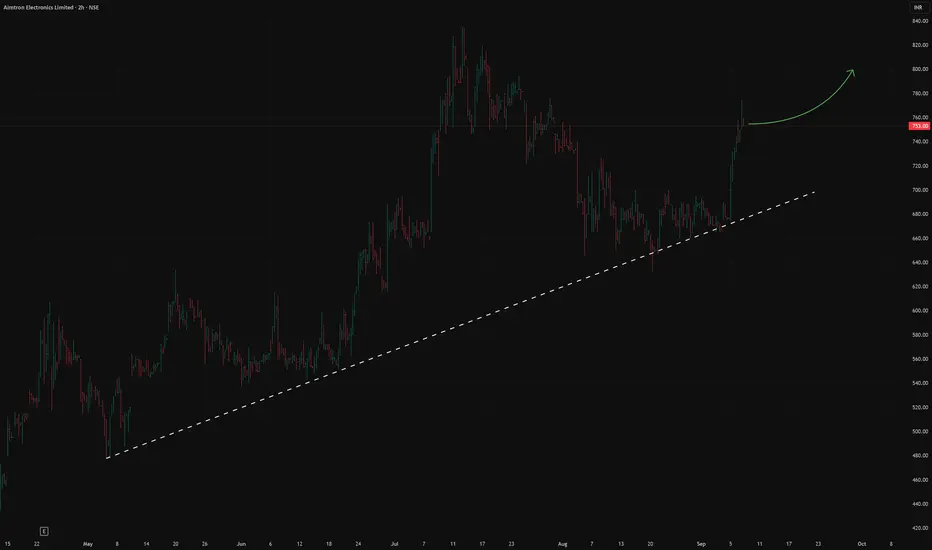
AIMTRON IN (Aimtron Electronics)Aimtron Electronics Limited (NSE: AIMTRON) is an Electronics Technology company specializing in Electronic System Design and Manufacturing (ESDM). It offers a wide range of services including Printed Circuit Board (PCB) design, assembly, and complete electronic system manufacturing ('Box Build').
The company serves global clients in the areas of Industrial Automation, Electric Vehicles, IoT, Medical Devices, Robotics and more
Aimtron focuses on precision engineering and complex electronic systems
The company serves over 500 global customers, including the US, UK, India, Hong Kong, Spain and Mexico markets
Aimtron Electronics successfully completed its IPO in June 2024, wherein 54,04,800 equity shares were issued at a price of Rs 161 per share.
This allowed the company to raise Rs 87.01 crore
The proceeds from the IPO were partially used to increase equity capital.
One of the key objectives of the IPO was to pay off debt.
The company has significantly reduced its debt burden
The shares are trading at a high valuation.
P/E 59
P/S 9.5
👆Such a high valuation is explained by operational and financial performance, and investors are giving a significant premium for such business growth
Revenue over the past year has grown by 71%, and net profit by 89%
ROE is 24.9% This indicates an efficient use of capital.
The company has almost no debt
The main reason for the growth of the shares was strong earnings growth
Aimtron's board of directors has met several times to discuss plans to attract additional capital
The company has already begun expanding its production capacity.
In fiscal 2025, it added a new surface mount (SMT) line, which increased production capabilities
The funds raised will be used for further capital investments in equipment, meeting working capital needs and general corporate purposes, including expanding its international presence
Monolithisch India LtdDate 29.10.2025
Monolithisch India
Timeframe : Day Chart
About
(1) MonolithischIndia Ltd is a manufacturer of pre mixed high-quality ramming mass.
(2) A heat insulation/lining material used as a refractory consumable for Induction furnaces installed in iron, steel, and foundry plants.
(3) The company serves iron and steel producers in the Eastern India, specifically in West Bengal, Jharkhand, and Odisha.
Product Profile
(a) SGB-777
(b) SLM-999
(c) BG-77
(d) SLM-980
(e) Quartzite Grain SLM-980
(f) Other specialized formulations
Product wise Revenue Split
(1) SGB-777: 49.73%
(2) SLM-999: 18.36%
(3) BG-77: 21.93%
(4) Quartzite Grain SLM: 1.05%
(5) SLM 980: 4.46%
(6) Others: 4.46%
State wise Sales Split
(1) West Bengal 66.53%
(2) Odisha 16.72%
(3) Jharkhand 16.64%
Revenue Breakup
(1) Sale from manufactured products 94%
(2) Sale of traded products 6%
Valuations
(1) Market Cap 967CR
(2) Stpock Pe 55
(3) Roce 61%
(4) Roe 53%
(5) Book Value 8X
(6) Opm 21%
(7) Promoter 74%
(8) Profit Growth (TTM) 66%
Regards,
Ankur

TATASTEEL ( W ) BREAKOUT
Breakout price 183
Target 1 : 198-200
Target 2 : 218-220
Sl : 166
All Target & sl DCB
Note : Only for education purpose

🇮🇳 LiamTrading – XAUUSD: Dual Strategy Ahead of FOMC🇮🇳 LiamTrading – XAUUSD: Dual Strategy Ahead of FOMC | Focus on Buying the Retracement near $3914
Hello Traders,
After a strong sell-off, Gold (XAUUSD) is showing early signs of recovery, building a minor upward structure.
We continue to focus on buying the pullback, viewing this move as a short-term correction within the broader downtrend.
Expect higher volatility as the FOMC decision approaches.
📰 MACRO CONTEXT & FUNDAMENTALS
The market is holding steady ahead of the FED announcement:
🟢 Technical Recovery:
Gold reversed part of its decline during the Asian session, bouncing slightly from a 3-week low as traders await the FOMC rate decision.
🔴 Headwinds:
However, optimism around US-China trade talks and a stronger USD continue to limit the upside momentum.
📊 TECHNICAL VIEW & TRADING PLAN
We are focusing on high-probability liquidity zones for both long and short opportunities:
🟢 Primary BUY Setup (Retracement Buy)
Looking for a retest of the key buy-side liquidity zone to trigger the next recovery wave.
Entry Zone (Buy): $3914
Stop Loss: $3906 (Tight SL recommended)
Take Profit: TP1 $3933 | TP2 $3956
🔴 SELL Setup (Retest / Short-Term Scalping)
Using the broken trend area for short opportunities.
Entry Zone (Sell): $4048
Stop Loss: $4056
Take Profit: TP1 $4035 | TP2 $4022
🧭 SUMMARY & TRADER’S NOTE
Gold is now in a decision zone — volatility will spike around FOMC.
Trade with discipline:
✅ Enter only at confirmed liquidity zones.
✅ Always respect your Stop Loss.
✅ Manage your capital carefully before the news release.
Wishing everyone a profitable and disciplined session!

J Kumar Infraprojects LtdDate 29.10.2025
J Kumar Infraprojects
Timeframe : Weekly
About
(1) Engaged in the business of execution of contracts of various infrastructure projects
(2) Including Transportation Engineering, Irrigation Projects, Civil Construction and Piling Work
(3) It is amongst the top 5 EPC players eligible to undertake underground metro projects
(4) Amongst few companies qualified to undertake elevated & underground metro projects
Revenue Mix
(1) Metro - 40%
(2) Flyovers, Bridges & Roads - 49%
(3) Civil, Water & Others - 11%
Geographical Split
(1) Maharashtra - 74%
(2) NCR - 15%
(3) Tamil Nadu - 6%
(4) Other - 5%
Clientele
CIDCO, DMRC, MMRC, MSRDC, NHAI, JSW, MMRDA, TATA Steel, Indian Oi
Order Book
Current order book is around 20,000/- crores against the market cap of 4713 Cr
Order Book Break-Up
(1) Flyovers - 39%
(2) Roads - 24%
(3) Metro (Elevated) - 14%
(4) Metro (Underground) - 12%
(5) Civil & Others - 11%
Valuations
(1) Market Cap 4713 CR
(2) Stpock Pe 11.6
(3) Roce 20%
(4) Roe 14%
(5) Book Value 1.5 X
(6) Opm 15%
(7) Promoter 46.64%
(8) Profit Growth (TTM) 19%
Regards,
Ankur

Golden Rally Losing Steam!Following an extended bullish run, gold seems to have completed a double top formation, signaling exhaustion of upward momentum. The emerging head and shoulders pattern reinforces the bearish outlook, with a projected downside target around 3600.

XRPUSDT - EYEING A BREAKOUT ABOVE KEY RESISTANCESymbol - XRPUSDT
XRPUSDT is attempting to break through the upper boundary of its trading range amid a broader bullish recovery across the cryptocurrency market. A confirmed breakout may occur following a minor pullback.
The market continues to absorb the liquidation impact from last few days, with Bitcoin showing structural recovery, suggesting a potential resurgence of bullish sentiment. This development supports a more optimistic outlook for the overall crypto market.
XRPUSDT is currently testing resistance and entering a phase of consolidation. The key breakout trigger lies near 2.661 However, during consolidation, a retest of support levels remains possible as the market may seek liquidity before a potential upward continuation.
Resistance levels: 2.661, 2.739
Support levels: 2.587, 2.500
Since the start of the session, momentum has been notably strong, though a brief correction could materialize before the upward movement resumes. Within this corrective phase, XRPUSDT may retrace toward the 2.587 – 2.500 zone to gather liquidity before potential continuation.

BTCUSD - RESISTANCE RETEST IN PROGRESSSymbol - BTCUSD
Bitcoin continues to consolidate beneath the previously breached ascending trendline, with no distinct signs indicating the end of the corrective phase or the emergence of strong bullish momentum. A retest of the resistance zone is currently forming.
Bitcoin is trading within a defined range between 1,11,650 & 1,06,250 At present, there are no clear bullish reversal signals, and price action suggests a corrective move toward resistance before a potential decline into the liquidity pool near 1,06,250, shaped by prior consolidation and retesting activity.
Two critical resistance zones lie ahead — 1,11,650 and 1,13,600 Resistance at 1,11,650 has been validated. However, failure to sustain rejection here may lead to a test of the upper boundary. A false breakout in that area could trigger a subsequent pullback. Overall, the cryptocurrency market remains relatively subdued, reflecting ongoing uncertainty and caution surrounding broader macro and policy factors.
Resistance levels: 1,11,650 - 1,13,600
Support levels: 1,08,650 - 1,07,375 - 1,06,250
Current price action indicates a developing consolidation phase within a localized downtrend. A confirmed breakout above 1,13,000 and subsequent consolidation above 1,13,500 would strengthen the case for a potential trend reversal. Until such confirmation emerges, a pullback from resistance into the zone of interest remains the primary expectation.

GOLD (XAU/USD): SHORT OPPORTUNITY — RIDING THE FINAL BEAR LEG!1. MACRO VIEW: THE FED DECISION & MARKET TENSION
The Gold market is currently caught in a tug-of-war:
Downside Pressure (USD): Positive developments in the US-China trade talks are easing global risk concerns, which often reduces demand for safe-haven Gold.
Upside Support (Gold): Traders are fully pricing in a 25bps Fed rate cut on Wednesday, putting downward pressure on the US Dollar (which is supportive of Gold). Geopolitical tensions (Russia-US) add further safe-haven appeal.
Key Takeaway: While USD weakness is supportive, our Technicals strongly suggest a corrective move needs to conclude first. The FOMC decision is the ultimate game-changer.
2. TECHNICALS: STRUCTURE CONFIRMS THE BEARISH BIAS
Trend Shift: Gold’s strong previous rally has ended. The structure has been clearly broken, confirming a Bearish Shift for the short-term trend.
Expected Move: We are looking for a classic technical pullback (Retest) to the newly formed resistance zone. Following this retest, we expect sellers to push the price down to complete the correction.
3. 💡 TRADE STRATEGY (THE SHORT SETUP)
We are positioning for a SELL (SHORT) trade, anticipating the end of the corrective phase:
Ideal Entry Zone (Entry): 3,949.849 (Retesting the previous major Support, now acting as Resistance)
Take Profit (TP1): 3,929.793
Take Profit (TP2): 3,878.287 – 3,811.333 (The Major Demand Zone Target below)
Stop Loss (SL): Above 3,949.849 (Placed above the confirmed resistance)
⚠️ Important Note: The FED rate decision on Wednesday guarantees high volatility. Trade cautiously and ALWAYS prioritize risk management!
What is your view on Gold's bottom? Share your thoughts below! 👇
#Gold #XAUUSD #FOMC #TradePlan

LiamTrading - XAUUSD: SCENARIO AHEAD OF FOMCLiamTrading - XAUUSD: SCENARIO AHEAD OF FOMC - The $3840 Mark Awaits a Bottom Catch Reaction Wave
Hello trading community,
The Gold market is exhibiting a strong and sustainable downtrend. We are witnessing a crash after the price broke through key support zones. With the upcoming FOMC event, our strategy is to seek Buy opportunities at deep liquidity zones and continue to Sell when the price recovers to retest the broken trend.
📰 MACRO ANALYSIS & CASH FLOW CONTEXT
Gold is currently under dual pressure:
Bearish Pressure 🔴: Optimism about the US-China trade progress has significantly weakened the demand for Gold, traditionally a safe-haven commodity. Spot Gold prices have fallen below $3950, hitting a three-week low, down about 0.78% on the day (28/10).
Short-term Support 🟢: Bets on the possibility of Fed rate cuts continue to weaken the US Dollar (USD), which is the only factor that could potentially support this precious metal.
Conclusion: This tug-of-war makes bottom identification challenging. The bearish scenario remains the top priority.
📊 TECHNICAL ANALYSIS: THE DOWNWARD WAVE CONTINUES
Based on the H4 chart (image_5fa7fa.png):
Current Trend: The price has successfully broken the key liquidity support zone near $3950 and is continuing its downward momentum.
Current Fibonacci Level: The price is touching and reacting at the 1.618 Fibonacci level (around $3950).
Next Target: The next target for Gold will be the 2.618 Fibonacci area (around $3840), which is a large liquidity zone expected to see strong reactions.
Main Strategy: We focus on two scenarios: Catching the bottom reaction at 3840 and continuing to Sell when the price rebounds.
🎯 DETAILED TRADING PLAN (ACTION PLAN)
We have two detailed scenarios based on the current price level:
🟢 BUY Reversal Scenario
We wait for the price to hit the deep liquidity bottom at 3840 to execute a buy order with the expectation of a technical recovery.
Entry Zone: 3840
Stop Loss (SL): 3832 (tight SL)
Take Profit Targets (TP): TP1: $3872 | TP2: $3898 | TP3: $3925 | TP4: $3950
🔴 SELL Retest Scenario
If Gold recovers without breaking the downtrend structure:
Entry Zone: Watch for a Sell retest at $4091
Stop Loss (SL): $4099
Take Profit Targets (TP): TP1: $4065 | TP2: $4033 | TP3: $4004 | TP4: $3965
SUMMARY & DISCIPLINE (Steven's Note)
Gold is in a strong decline ahead of the FOMC, with significant volatility expected. Capturing deep Fibonacci and Liquidity zones is key.
Note: Always adhere to the set Stop Loss. Capital management is the top priority, risking only 1-2% of the account per trade.
Wishing traders a successful and disciplined new trading week!

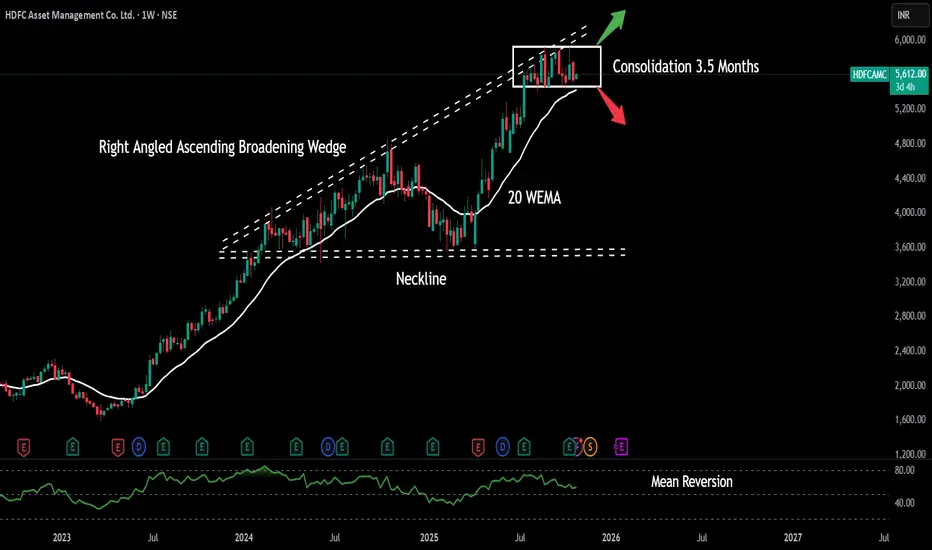
HDFC Asset Management Company Date 28.10.2025
HDFC AMC
Timeframe : Weekly Chart
About
(1) The company acts as an Investment Manager for HDFC Mutual Fund, one of the largest mutual funds in India.
(2) It offers 98 mutual fund schemes, including 39 equity-oriented, 32 debt-oriented, 2 liquid, and 25 others
Market Share
(1) Closing AUM: 11.6%
(2) QAAUM: 11.5%
(3) Actively managed Equity Oriented QAAUM: 12.8%
(4) MAAUM: 13.2%
Operational Metrics
(1) Closing AUM (Rs. Bn): 7,764
(2) QAAUM (Rs. Bn): 7,874
(3) Alternatives AUM (Rs. Bn): 50
(4) Unique Investors (Mn): 12.6
(5) Live Accounts (Mn): 22.1
Closing AUM Mix
(1) Equity-Oriented: 66%
(2) Debt-Oriented: 20%
(3) Liquid: 10%
(4) Other: 4%
Distribution Mix
(1) Direct: 44%
(2) MFDs: 27%
(3) National Distributors: 21%
(4) Banks: 11%
Valuations
(1) Market Cap 1,19,257
(2) Stpock Pe 43
(3) Roce 43%
(4) Roe 32%
(5) Book Value 15 X
(6) Opm 80%
(7) Promoter 52%
(8) Profit Growth (TTM) 24%
Regards,
Ankur
GOLD - ENTERS COREECTION PHASESymbol - XAUUSD
Gold is currently undergoing a corrective phase following approximately six weeks of aggressive upward movement. Price action is forming a consolidation range while continuing to pressure the support zone.
The recent record breaking rally became overheated, prompting profit-taking and long liquidation. Additionally, a gradual shift in market sentiment and macroeconomic backdrop is contributing to capital outflows. However, ongoing US–China trade negotiations, the US government shutdown, and heightened geopolitical uncertainty, including the cancellation of Trump’s meeting with President Putin, continue to pose economic risks that could provide underlying support for the precious metal.
Overall, the current pullback appears to be a healthy corrective pause within the broader structure. The 4000 level remains a critical support area. A sustained recovery above 4110 would indicate that buyers are interested, though further momentum largely depends on developments surrounding global trade policies.
Resistance levels: 4100, 4110, 4163
Support levels: 4058, 4000
A decisive breakdown of the lower boundary of the trading range could trigger a deeper corrective wave. The 4000 level is the primary focus, as strong volatility may occur around this zone. Given the current market conditions - with declines matching the previous intensity of the rally, patience is warranted until momentum stabilizes, enabling more informed technical decisions.
