XAUUSD – Waiting for Trend Confirmation Around the 4,160–4,170..XAUUSD – Waiting for Trend Confirmation Around the 4,160–4,170 Zone
At the moment, gold has not shown a clearly defined medium-term trend. Price is moving around an important resistance zone, so instead of predicting direction early, I prefer waiting for price reaction at key levels before taking action.
The main focus today is the 4,160–4,170 area – where the market will decide whether to continue the uptrend or start a deeper correction.
🎯 Scenario 1 – SELL at 4,162–4,165 (Priority if No Clear Breakout)
Sell: 4.162 – 4.165
SL: 4.173
TP: 4.140 – 4.122 – 4.110 – 4.100
The 4.162–4.165 zone on H1 is a strong resistance area combining Fibonacci confluence, previous supply, and proximity to the short-term rising trendline.
If price taps this zone and shows weakness (upper-wick rejection, reversal candle, low volume confirmation), I prefer taking a short-term sell toward 4.140, with deeper targets at the liquidity cluster around 4.110–4.100.
Risk for this scenario is capped at 1–2% per trade. Do NOT hold the position if price closes above 4.173.
⭐ Scenario 2 – BUY on Break Above 4,170 (Trend Continuation Confirmation)
Buy: 4.171 – 4.173 (only after a clean breakout)
SL: 4.163
TP: 4.188 – 4.200 – 4.215
If price breaks decisively above 4.170 and sustains above it, that confirms buyers are still in control.
In this case, I switch my bias to buying the breakout, targeting the next resistance zones around 4.200–4.215, and possibly higher if momentum remains strong.
Note: Only buy if the breakout is genuine — strong candle body closing above 4.170, not a stop-hunt wick that pulls back immediately.
1. Fundamental Outlook
The DXY continues slipping below 99.50, now near 99.45, showing sustained weakness as markets increase expectations for a December Fed rate cut.
Easier monetary conditions generally support gold because the opportunity cost of holding gold is reduced.
However, U.S. initial jobless claims have dropped to the lowest level since April, showing the labour market is still resilient.
This creates a mixed environment: rate-cut expectations support gold, but strong economic data may cause sudden volatility around news releases.
Overall, fundamentals lean slightly bullish for gold, but not strongly enough to ignore potential technical pullbacks.
2. Technical Structure
On the H1 chart, after a strong rally, gold is now consolidating right below the 4.160–4.170 resistance.
The 4.162–4.165 region is a confluence zone:
• horizontal resistance
• previous supply
• area where strong selling pressure appeared earlier
The 4.140 level is the “correction confirmation level” — if price breaks and closes below it, the market will likely aim for the major liquidity area around 4.110–4.100, where many Buy-side stop losses are clustered.
The current structure allows for both long and short setups, but each scenario requires clear price confirmation at the 4.160–4.170 zone.
3. Market Sentiment & Action Plan
Both buyers and sellers are watching the same price zone — 4.160–4.170.
This makes it a high-liquidity area where stops for both sides may get swept before the market shows its real direction.
If price rejects strongly from this zone, it could be a sign of late buyers being flushed out.
If buyers hold price above 4.170, trapped short positions may fuel a short squeeze toward higher resistance zones.
My plan: I do not enter mid-range. I wait for clear signals:
• Sell at 4.162–4.165 if reversal confirmation appears.
• Buy at 4.171–4.173 after a confirmed breakout and hold above the zone.
• Always use a hard stop-loss. No widening stops if price goes against the trade.
If price breaks both zones without giving clear signals, I stay out and wait for a new structure instead of forcing a prediction.
I always read feedback to improve how I share these analyses in future posts.
Fundamental Analysis

Bullish breakoutHello,
Silver is ready for the new High. If the fed cut the interest rate on 9th-10th of Dec. This will skyrocket and may break the all-time high.
My target will be
T1 ---> 166169
T2 ---> 172000
T3 ---> 184000
SL in Premium Group.

XAUUSD – H1 uptrend channel, short-term downside risk increasingXAUUSD – H1 uptrend channel, short-term downside risk increasing Brian – Prioritize short selling at the channel peak, wait to buy back at lower support
I. Strategy Summary Gold is trading in an uptrend channel on H1, but the rise around 4.160 shows signs of weakening, increasing short-term correction risk.
Preferred Scenario: Short sell at the channel peak 4.162–4.164, targeting support areas 4.145 – 4.130 – 4.115 – 4.100.
After the correction, the 4.100–4.080 area may become the foundation for the next rise in the larger trend.
Important price areas to watch: 4.139 – 4.127 – 4.110 – 4.088.
II. Macro Context & News 27/11
02:00 – Fed releases Beige Book This document updates the Fed branches' assessment of the US economic situation.
Describing slower growth, cooling price pressures will further reinforce expectations that the Fed will soon cut interest rates → supporting gold.
Conversely, if the Beige Book describes the economy as still “resilient,” the market may temporarily slow down pricing in rate cuts → causing a short-term adjustment for gold.
19:30 – ECB releases October meeting minutes
If the minutes lean towards the scenario of keeping high interest rates longer, the EUR may be supported, indirectly affecting the USD and gold inflows.
However, the impact is usually not as strong as US data, mainly affecting the overall risk-on/risk-off sentiment.
General Context: Gold has surpassed 4.160 USD/oz as the market increasingly expects the Fed to cut interest rates as early as December, reducing the appeal of interest-bearing assets and increasing the allure of gold – a non-yielding asset. This creates a support foundation for the medium-term uptrend, but after a hot rise, technical adjustments on H1 are normal.
III. Technical Structure – H1 uptrend channel
The price is within the H1 uptrend channel, with rising peaks and troughs, but the upper area near 4.160 coincides with:
The upper boundary of the price channel. The “Sell POC” area on the chart – where liquidity and sell orders are concentrated.
Preferred scenario on the chart: The price may slightly rebound to the POC area 4.162–4.164, then be rejected and slide to the important support area around 4.110 before extending the adjustment down to 4.100–4.080.
The lower trendline of the uptrend channel also acts as a short-term buy area if a clear candle reaction appears.
Notable price areas on H1: Resistance: 4.162–4.164 (channel peak + POC). Intermediate support: 4.139 – 4.127 – 4.110. Deep support: 4.088 – 4.080 – 4.100 (area that may form the bottom for the next rise).
IV. Trading Plan 1. Preferred Scenario – Short sell at the channel peak Idea: Short sell when the price rebounds to the upper boundary of the H1 uptrend channel and POC 4.162–4.164, expecting a correction to support.
Sell: 4.162–4.164 SL: 4.168 TP targets: TP1: 4.145 TP2: 4.130 TP3: 4.115 TP4: 4.100
This is a counter-move order in the uptrend channel, only targeting a short-term correction, not a major trend reversal scenario.
2. Supplementary Scenario – Short buy at support trendline Idea: When the price hits the lower trendline of the H1 uptrend channel and a nice candle reaction appears, consider a short-term buy according to the channel, prioritizing areas:
4.139 – 4.127 – 4.110 – 4.088
Specific Entry/SL levels will depend on the actual price reaction at the trendline, but the general principle:
Buy close to the trendline,
SL placed below the immediate support area,
TP aimed at the middle of the channel or the nearest resistance.
V. Risk Management & Notes
Do not open new positions right before or at the time of the Beige Book and ECB minutes release, as volatility may suddenly increase, widening spreads.
The sell order at 4.162–4.164 is a short-term counter-trend order in the uptrend channel, requiring moderate volume and strict adherence to SL 4.168.
If the price clearly breaks and holds above the 4.170 area, the H1 correction scenario weakens – in that case, stay out, wait for a new structure instead of trying to maintain a sell view.

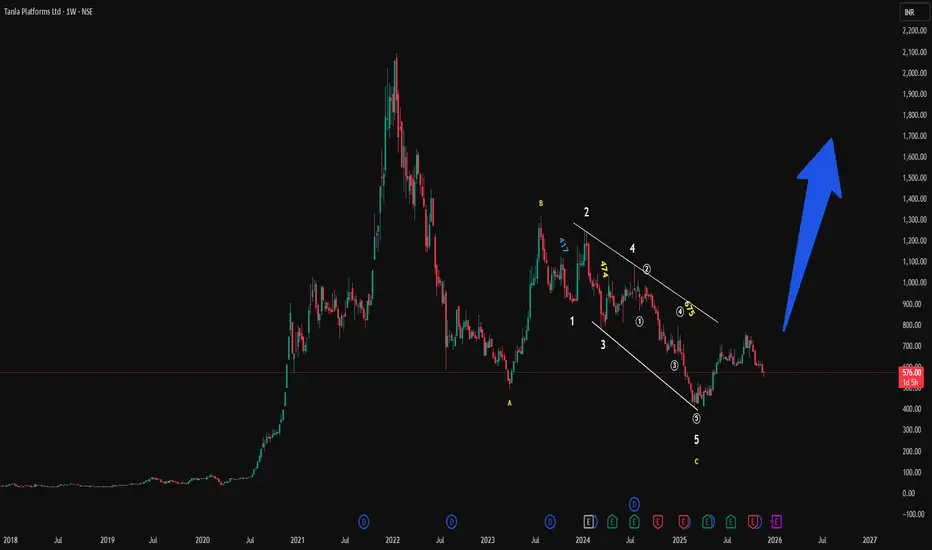
TANLA new Impulse start soonGood fundamental with Good price
Tanla Platforms Ltd. has an average share price target of 705.
The consensus estimate represents an upside of 1300 and 2100
View 3 reports from 1 analysts offering long-term price targets for Tanla Platforms Ltd..
XAUUSD BUY OR SELL TODAY?1. Main Market Context for Today
Jobless claims came in better than expected → USD strengthens, but gold did not drop — it continued to move sideways → the market is in accumulation and waiting for a breakout.
Today’s priority strategy is range trading:
Lower range: 4130–4135
Upper range: 4170–4175
Once price breaks clearly out of either range → switch to trend-following (pursuit) trading.
2. Range-Trading Plan (Primary Strategy for Today)
(A) Buy at the Lower Range – 413X Zone
Buy area: 4130–4135
SL: 100 pips
TP: 100 pips
Reason: This is the main demand zone and aligns with the ascending trendline shown on your chart.
➡️ Strategy:
Wait for price to “sweep” the lows → show confirmation → then take a quick BUY trade.
(B) Sell at the Upper Range – 417X Zone
Sell area: 4170–4175
Reason: Strong supply zone with repeated reactions.
➡️ Strategy:
Wait for a rejection candle (pin bar / bearish engulfing) → then SELL.
3. Current Reaction Zone – 414X
This is the zone price is currently testing.
Do not enter immediately; just observe:
If price bounces strongly from 414X → target is to retest 417X
If 414X breaks → price will likely retest 413X → better BUY entries there.
4. Deeper BUY Zones (If Price Breaks Downward)
Here are the levels you mentioned, organized clearly:
BUY Zone
4110–4108
4102–4100
4096–4094
→ These are deeper liquidity zones below the main range, activated only if gold breaks below 413X.
5. SELL Zones if Price Breaks Upward (Above 417X)
SELL Zone
4202–4200
4194–4190
4183–4180
→ These are upper supply retest zones, activated only after price breaks above 417X.
🟨 6. Main Scenarios for Today
Scenario 1 – Expected Sideway (Highest Probability)
Price moves within 413X – 417X, bouncing between the range limits.
→ Trade the range (scalp/intraday).
Scenario 2 – Break Below Range
If 4130 breaks → price will head to 4110 → 4100 → 4094
→ BUY at deeper zones.
Scenario 3 – Break Above Range
If 4175 breaks → price will aim for 4183 → 4194 → 4200–4202
→ SELL at higher zones.
✅ One-Line Trading Summary
Trade primarily within the 413X–417X range (buy low – sell high). If the range breaks, switch to trend-following using the deeper BUY zones or higher SELL zones provided above.

Gold (XAU): Fed Cut Incoming? Breakout Time!I. 📰 FUNDAMENTAL ANALYSIS (FA)
The Vibe: The US Dollar (DXY) is facing serious heat! The US Fed's recent dovish signals are a major tailwind for non-yielding Gold.
Fed's New Tune: Big guns like Governors Williams and Waller are now talking about rate cuts soon. Why? Because US economic data (Retail Sales, Consumer Confidence) is getting weaker, boss.
Market Buzz: The market is pricing in a strong nearly 85% probability of a 25bps rate cut in December. Picture clear, right?
Takeaway: This shift is Massively Bullish for Gold because lower interest rates make the Dollar less attractive.
II. 📈 TECHNICAL ANALYSIS (TA)
The Scene: Gold is currently bumping heads with a major hurdle – the Discount Zone (our supply zone). The real action is here!
Crucial Resistance: Gold is testing the Discount Zone (the main resistance area). This is the make-or-break level.
The Short Game (Bearish): Wait for a clear rejection signal at this resistance zone. If it holds, a correction is coming.
The Long Game (Bullish): For Gold to go on a proper rally, it needs a Strong Breakout and Close above the entire resistance area.
💡 THE STRATEGY
Focus on the Resistance Level: Trade based on Confirmation, whether that's a reversal signal for a short correction, or a strong breakout for a fresh long position.
Don't miss the US data tonight (Durable Goods/Jobless Claims) – it will be the real fire starter!
#GoldTrading #XAUUSD #ForexIndia #FedRates #DovishFed #TechnicalAnalysis #MarketUpdate #FinanceIndia

XAUUSD – Inverse Head and Shoulders Pattern Still Active...XAUUSD – Inverse Head and Shoulders Pattern Still Active, Continue to Prioritise Buying at POC
I maintain the view that the current dominant trend is buying based on the inverse head–and–shoulders structure, and the bullish wave is not yet complete. The plan is to wait for price to retrace into the POC zone to re-enter with the trend, avoiding chasing buys at the highs.
🎯 Main Scenario – BUY THE DIP AT POC
Buy: 4,133 – 4,130
SL: 4,123
TP: 4,155 – 4,178 – 4,200 – 4,250 – extended targets if momentum remains strong
For me, total risk per trade never exceeds 1–2% of the account. A good setup with poor risk management is still a bad trade.
1. Fundamental Context
Gold is maintaining its upward momentum, trading near its highest levels in about two weeks.
The US Dollar is weakening as markets increase bets on the Fed cutting rates soon, following data showing continued cooling in inflation.
Lower yields and a softer USD reduce the opportunity cost of holding gold, supporting the flow back into safe-haven assets.
With this backdrop, I do not prioritise large sell setups. Most pullbacks are mainly opportunities for me to accumulate long positions.
2. Technical Analysis & Market Sentiment
On the H1 timeframe, gold has formed and activated an inverse head–and–shoulders pattern, confirming a bullish reversal phase.
Price is retracing to retest the POC zone around 4,133–4,130, overlapping the previous accumulation area where heavy sell orders were absorbed. This is the zone I prioritise for buying.
Below this lies a deeper FVG acting as secondary support; however, I’m not waiting for price to drop too far to avoid missing the core move of the pattern.
Regarding price behavior, recent pullbacks have been absorbed quickly, with multiple long-wick candles showing buyers are still in control. I’m waiting for a clean pullback into POC with a strong bullish reaction to trigger the entry.
3. Action Plan
Only enter positions when price returns to the 4,133–4,130 zone — absolutely no FOMO buying at higher levels.
Take partial profits at 4,155 – 4,178 – 4,200 – 4,250, leaving the remaining position open if gold continues to extend its bullish leg.
If price breaks below 4,123 and closes under that level, I will cut the trade immediately and reassess the structure — never hold on to a bias when the market has changed.
If this analysis is helpful, follow my TradingView channel and leave your comments. I always read feedback to improve and refine my future posts.

XAUUSD – H4 Trend Structure Awaiting BreakoutXAUUSD – H4 Trend Structure Awaiting Breakout
Brian – Strategy to Buy on Pullback in Uptrend Channel
I. Strategy Summary
Gold continues its uptrend on H4, supported by the upward trendline from the 3,880–3,900 region.
The price is testing the resistance zone of 4,133–4,150, coinciding with the H4 supply and descending trendline, making short-term corrections likely.
Main strategy: wait for a pullback to support/FVG to buy with the trend, avoid FOMO buying at resistance.
Key levels to note: closing below 4,000 weakens the uptrend structure; below 3,884 risks shifting to a medium-term downtrend.
II. Macro Context
Unemployment Claims (weekly unemployment benefits):
Forecast: 226K
Previous: 220K
Higher-than-expected figures → indicate a weakening labor market, cooling economy, increasing the likelihood of the Fed easing sooner → real yields decrease, supporting gold.
Better-than-expected figures (lower than forecast) → support USD and bond yields, potentially causing short-term pressure on gold.
Geopolitical:
Trump's statement on easing "deadline" pressure for Russia–Ukraine negotiations ("the deadline will be when the issue is resolved") helps the market worry less about a hard deadline, but conflict risks remain. The demand for gold as a safe haven remains stable, not overly inflated but also unlikely to disappear entirely.
III. Fundamental Picture
Expectations for a rate cut cycle in 2025 continue to support gold as the market gradually prices in lower real interest rates in the medium to long term.
The demand for holding defensive assets persists amid slowing global growth and unresolved geopolitical hotspots.
In the short term, USD and US bond yields remain the two leading variables; any USD recovery can pull gold back to technical support areas, creating opportunities for buy-on-dip strategies.
IV. Technical Structure – H4 Trend Channel & FVG Zone
On H4, the price is moving within an uptrend channel, with the support trendline respected multiple times since the end of last month.
Above is the descending trendline connecting the nearest peaks, creating a price compression zone as the market approaches the 4,133–4,150 area. This is a confluence resistance zone:
The nearest swing high.
H4 supply zone.
Intersection with the descending trendline.
Notable price zones:
Resistance: 4,133–4,150 – a zone that may trigger short-term profit-taking and create a correction.
Near support/FVG: 4,078–4,080 – FVG zone combined with support after the previous breakout.
Psychological support: 4,000 – if H4 closes below this area, the uptrend structure weakens.
Medium-term reversal level: 3,884 – closing below here opens the risk of shifting entirely to a medium-term downtrend.
V. Trading Plan
Scenario 1 – Buy with the Trend (Priority)
Idea: wait for a shallow pullback to near support in the H4 uptrend channel and then buy.
Entry: 4,111–4,114
SL: 4,005
TP: 4,133 – 4,150 – 4,172 – 4,190
Scenario 2 – Buy Deep at FVG Zone
Idea: if a stronger pullback to FVG 4,078–4,080 occurs, take advantage of the good price zone to buy.
Entry: 4,078–4,080
SL: 4,073
TP: 4,100 – 4,115 – 4,142
VI. Risk Management & Notes
Limit opening new orders at the time of Unemployment Claims announcement due to potential volatility and spread widening.
If H4 closes below 4,000, reassess all current buy positions.
If H4/Daily closes below 3,884, consider the medium-term uptrend structure broken; prioritize staying out to observe or wait for a new downtrend scenario instead of continuing to look for buying points.

Stock Analysis: Axtel Industries Ltd Introduction:
Axtel Industries Ltd, incorporated in 1991, specializes in manufacturing custom-designed food processing plants and machinery. The company provides engineering process solutions covering the entire food processing value chain—from raw ingredient handling to final processing—for industries such as dairy, beverages, snacks, confectionery, spices, and nutraceuticals. Their offerings include equipment and systems for chocolates and confectionery, ingredients management, size reduction, sieving, mixing, spices processing, steam sterilization, and customized solutions.
AIL operates a single manufacturing facility at Halol, Gujarat, expanding recently through a Rs. 16 crore capex to increase plant area to 2 lakh sq. ft. The company has long-term technical associations with Wenger Inc. (USA) for extrusion systems and AnuTec GmbH (Switzerland) for powder handling. Their clientele includes major brands like Adani Wilmar, Amul, Britannia, Hershey’s, Nestle, Pepsico, and Unilever. For FY24, about 92% of revenue comes from machine sales, with exports contributing 14% of total revenue in FY23, and the balance from domestic markets. Axtel focuses on automation, hygiene, and turnkey solutions to maximize profitability and reliability for food processing clients.
Fundamentals:
Market Cap: ₹ 788 Cr.;
Stock P/E: 39.3 (Ind. P/E: 34.34) 👎;
ROCE: 19.8% 👍; ROE: 14.4% 👍;
Dividend yield: 2.26 👍%
3 Years Sales Growth: 7% 👎;
3 Years Compounded Profit Growth: 13% 👍;
3 Years Stock Price CAGR: 23% 👍;
3 Years Return on Equity: 21% 👍
Technicals:
Resistance levels: 494, 525
Support levels: 455, 421
The stock has been in consolidation for over 8 months.
Recent quatrterly results has been Good.

LANA_M2 XAUUSD – WAIT FOR A PULLBACK TO BUY WITH THE UPTREND ...LANA_M2 XAUUSD – WAIT FOR A PULLBACK TO BUY WITH THE UPTREND
1. Fundamental Analysis
Gold continues its bullish momentum and has just formed a two-week high as expectations for an early FOMC rate cut strengthen.
Weaker U.S. economic data, cooling bond yields, and pressure on the USD are supporting gold, both from real-yield dynamics and safe-haven demand.
With this outlook, Lana prefers waiting for a mild correction before buying with the trend, instead of chasing buys at higher prices.
2. Technical Analysis
On the H1 chart, the market structure has shifted to bullish with consecutive BOS, confirming buyer control.
FVG demand zones around 4100 and 4080 are acting as support, aligning with key swing lows after BOS.
The upper zone around 4180–4200 is an FVG supply area and a premium/ resistance zone where price may react with a short-term pullback.
With Fibonacci confluence, 4103–4105 and 4086–4088 match the 50–61.8% retracement of the latest bullish leg — ideal for waiting for a pullback to buy.
3. Key Price Zones
Support / Discount (Demand & FVG):
4103 – 4105
4086 – 4088
Resistance / Premium (Supply & FVG):
4165 – 4194 – 4202
4. Trade Setups
⭐ Primary Scenario – Buy with the Trend
Buy entry: 4103 – 4105
SL: 3998
TP: 4115 – 4130 – 4165 – 4190
⭐ Alternative Scenario – Deep Buy at Lower FVG
Buy entry: 4086 – 4088
SL: 4080
TP: 4100 – 4125 – 4146 – 4170 – 4190
⭐ Short-term Reversal – Sell at Premium Zone
Sell entry: 4194
SL: 4202
TP: 4177 – 4150 – 4132 – 4110
👉 Follow Lana on TradingView to get the earliest gold analysis updates. 💛

WHICH SIDE TO CHOOSE TODAY — BUY OR SELL?1. Quick Market Context
PPI, Core PPI, and Retail Sales came in weak → low inflation → Fed may cut rates in December.
Price has broken out of the H4 accumulation zone → BUY bias for today.
Tonight we have Unemployment Claims → if the data is higher → XAU tends to continue rising.
✅ MAIN STRATEGY – BUY ON DIP
📌 All setups follow SL 100 pips – TP 100 pips
🎯 BUY ZONE 1 (Primary Entry)
4130 – 4136
→ Open BUY.
→ Retest zone after breakout.
→ SL: 10 pips | TP: 10 pips
🎯 BUY ZONE 2 (Major Support Zone)
4108 – 4113
→ Strong BUY zone.
→ If broken → deeper correction possible.
→ SL: 10 pips | TP: 10 pips
🔵 POTENTIAL BUY ZONES (SWING ENTRIES)
Use for bottom-picking with flexible RR (1:1, 1:2, 1:3, 1:4...)
4100 – 4102
4092 – 4094
4088
4060 – 4066
→ For swing setups: SL/TP depends on larger RR (not fixed 10 pips).
❌ SECONDARY STRATEGY – SELL REACTION (COUNTERTREND / QUICK SCALP)
📌 SELL setups also follow SL 10 pips – TP 10 pips.
🎯 SELL ZONE 1 (Strongest Reaction Area)
4192 – 4195
→ Short SELL for quick reaction.
→ SL: 10 pips | TP: 10 pips
🎯 SELL ZONE 2
4200 – 4202
→ Psychological resistance → SELL scalp.
→ SL: 10 pips | TP: 10 pips
🎯 SELL ZONE (Fibo Extension)
4180 – 4187
→ Short-term SELL for a small pullback.
→ SL: 10 pips | TP: 10 pips
🔶 BI / INVALIDATION ZONES
If price breaks these levels → short-term trend shifts:
Break below 4108 → BUY invalid → potential drop to 4100 / 4092.
Break above 4202 → SELL invalid → upside extension toward 4215 – 4220.
⚠️ Risk Management
Manage your capital strictly, observe market reactions, and adjust accordingly.
This plan is for reference only, not financial advice.
Trade responsibly.
Have a good day, guys!

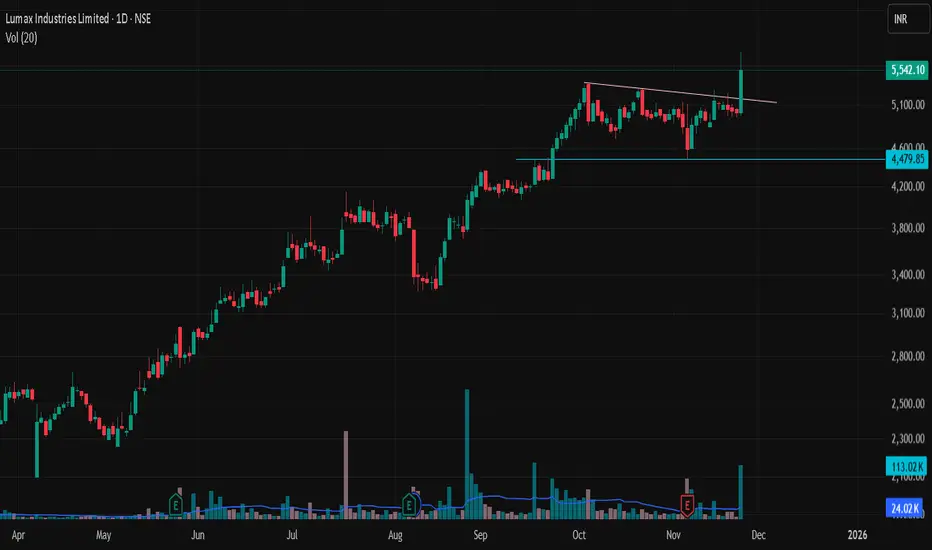
LUMAXIND - continue to rise with rising strength -Positional BuyLUMAXIND
KEY HIGHLIGHTS
good for positional buy
at its all time high
rising strength on strength meter
passes daily and weekly mark minervini trend template criteria
SCORING
Core Fundamentals (Sales + Profit + Margins + ROE/ROCE) – 20% weight
EPS Trend & Consistency – 20% weight
Multi-year EPS breakout & new highs: ~85/100
Institutional Trend (Promoter, FII, DII) – 20% weight
Stable 75% promoter, strong DII build-up, small but rising FII: ~80/100
Technicals / Momentum (Price vs MAs, 1Y performance, RSI) – 40% weight
Strong uptrend, above key MAs, 1Y 142% but some overextension risk: ~80/100
Weighted together, this gives around:
Overall ≈ 81 / 100
Quick Take
Positives
Strong, consistent topline growth (20–25%+).
EPS has broken out post-COVID and is hitting new highs.
ROE/ROCE in high-teens – healthy quality.
DIIs have aggressively accumulated over the last 2 years.
Stock is in a clear technical uptrend, outperforming the market sharply.
Watch-outs
Valuation is rich vs. historical and vs. typical auto-ancillary.
Debt has increased meaningfully to fund growth – fine if cycle stays strong, a risk if it doesn’t.
1-year move (142%) means any small disappointment in future quarters can trigger sharp corrections.
Daily Macro, Market Mood Swings, and the Stories Behind the NoisGlobal Markets: Three’s a Trend
Global stocks pushed higher for a third straight session on Tuesday, fueled by growing confidence that the Federal Reserve will slip in a December rate cut like an early holiday present. U.S. Treasury yields eased as well, giving investors one more reason to feel optimistic — or at least less grumpy.
Wall Street’s Tech Glow-Up
Over on Wall Street, stocks climbed with the help of Silicon Valley’s usual superheroes — Alphabet and Meta. Google’s parent company surged 1.53% to a record close of $323.44, inching closer to the absolutely casual milestone of $4 trillion in market cap.
The Dollar Takes a Tumble
The dollar index dropped 0.44% as weaker-than-expected U.S. data — including September retail sales, core PPI, and ADP employment — boosted bets on a December Fed cut. Add in falling bond yields (with the 10-year sliding to a 3.5-week low of 3.987%), plus consumer confidence hitting a 7-month low, and the dollar had all the reasons it needed to slump politely into a corner. Retail sales rose just 0.2% versus the expected 0.4%, reminding everyone that the American consumer may finally be getting tired of carrying the global economy on their back.
The Fed Repricing Whiplash & Consumer Mood Swings
Markets have repriced December rate-cut expectations with the grace of a roller coaster: from the low 30% range to 90% an hour ago, now cooling at 87%. A month ago? Also 90% — before collapsing and then bouncing back. The main culprit: nonstop Fed commentary, proving once again that “forward guidance” is more of a suggestion than a plan. Meanwhile, fresh U.S. sentiment data didn’t help the mood. The headline index missed badly at 88.7 (vs 93.3 expected), current conditions hit the lowest since 2021, and future expectations slid to their April 2025 low — courtesy of stubborn inflation worries and rising job-income anxiety.
Global Highlights: Gold Glitters, Rupee Stutters & Data Storm Ahead
Germany delivered a flat Q3 GDP print, which, considering last quarter’s contraction, counts as… stability. Gold edged up 0.3% to $4,150.09 as weak retail sales strengthened the case for a December cut. Global equities mostly turned green, shrugging off AI-overinvestment and debt concerns as if the Fed’s 25-bps cut-in-waiting is a magic eraser. India, however, bucked the trend: the Sensex fell 314 points and the Nifty slipped 75. The rupee ended nearly unchanged at 89.22 as importer demand offset regional currency strength.
Today’s data docket is a global buffet — Australia CPI, New Zealand rate decision, Japan’s BoJ core CPI, a heavy U.S. lineup (GDP, durables, core PCE, spending, home sales, jobless claims), plus ECB’s Lagarde and Lane holding the mic in the Eurozone.

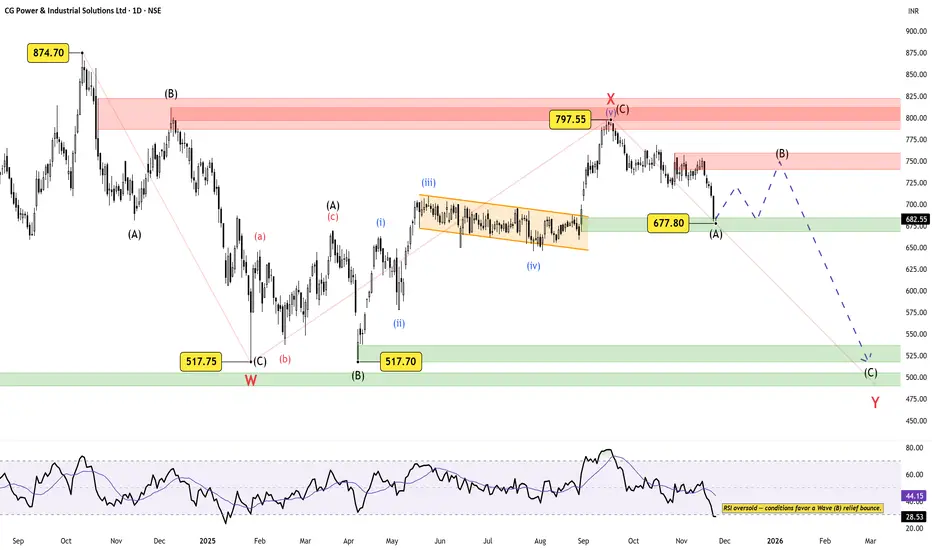
CG Power: Technical Correction vs Strong FundamentalsCG Power has reacted sharply from the 797–800 zone, confirming a reversal from the prior up-leg.
The decline into 677.80 has unfolded as a clean impulsive drop, which fits well as Wave (A) of the larger Wave Y.
With RSI oversold, the market is now in a zone where a corrective Wave (B) bounce becomes the higher-probability path. Any recovery into the 720–750 bearish order-block region will be the critical zone to watch.
As long as price remains below this region, the broader structure still points toward a Wave (C) decline — a final leg lower to complete Wave Y in the 520–540 support region.
This is a developing corrective structure , not a completed one.
Fundamentals Tell a Very Different Story
Free cash flow now at ₹5.82B, a major turnaround.
Long-term debt almost zero at ₹2.6M.
Three years of strong revenue growth.
ROCE around 19%, very healthy.
Margins stable and improving.
The only real tension point is valuation:
P/E ~98, which is stretched enough to justify a technical correction even in a fundamentally strong business.
Putting It All Together
Wave (A) of Y is likely complete at 677.80.
Wave (B) bounce expected next.
Wave (C) lower remains unfinished — completing Wave Y.
Fundamentals remain strong, long-term story intact.
Short-term corrective move doesn’t change the broader bullish health of the company.
Disclaimer: This analysis is for educational purposes only and does not constitute investment advice. Please do your own research (DYOR) before making any trading decisions.
Sensex - 84700 CE and PE for expirySir/Mam,
Please buy CE and PE of strike price 84700. For best price wait for the value (-75% of both)
The best time for buying is after 1 PM or breakout points.
Today, it is closed at 84587.01 - It will go upside up to 84700 and then down till 84500 - 84400.
I am bearish if it is below 84800 levels.
Hope you have booked profits in Nifty as I suggested in my previous Idea chart.
Stay safe and keep smiling.
Thank you for taking time to read my ideas and your support really helps me a lot.

High Dividend Yield Stock at Attractive Valuations - Coal india
Coal India is a high-dividend PSU that typically pays multiple dividends a year, adding up to roughly ₹20–₹30 per share annually in recent years.
The stock is available at attractive valuations with P/E of 7.37 compared to the industry P/E of 11.62.
Company has a good return on equity (ROE) track record: 3 Years ROE 48.7%
Stock is providing a good dividend yield of 7.11%.
Company has been maintaining a healthy dividend payout of 45.1%
In the last 12 months, Coal India has paid about ₹21–₹27 per share in total dividends, depending on whether you take the latest declared interim into the tally.
For FY 2024-25, recent disclosures show multiple dividends (interims and final) that together sum to over ₹20 per share so far, with scope for one more interim depending on earnings and board decisions.
FY 2023-24: Dividends included an interim of ₹15.25 and further payouts of ₹5.25 and ₹5.00 per share, totaling about ₹25.50 per share for that year.
Earlier years (2020–2023) also show aggregate annual dividends generally in the ₹15–₹25 range per share, with some years higher due to special or larger interim payouts.
When compared to other PSU mining companies, Coal India generally maintains a higher dividend yield, with major competitors like NMDC offering roughly 7% and ONGC around 6%.
In comparison, companies like NMDC have similar dividend yields but may fluctuate slightly year-to-year depending on prevailing market conditions and profitability. Some other PSU mining entities, such as ONGC and BPCL, tend to offer dividend yields between 4% and 6%, usually lower than Coal India's steady 7% payout.
Overall, Coal India's dividend payments are among the most attractive within the PSU mining sector, making it a preferred choice for income-focused investors seeking stable dividend returns.

LiamTrading – XAUUSD H1 | Gold forming Head–Shoulders Pattern...LiamTrading – XAUUSD H1 | Gold forming Head–Shoulders Pattern, waiting for pullback to POC for entry
Gold is completing the final bullish leg of the Head–Shoulders structure on the H1 timeframe.
Price has now reached the Fibonacci zone (both retracement + extension), which also aligns with a resistance cluster and the POC of the Volume Profile — so the current choppy reaction is completely normal.
My plan is to use this pullback:
→ prioritize short-term Buy entries following the current bullish leg,
→ then look for Sell setups at the strong resistance above.
Macro Background
Russia continues missile strikes on Kyiv right after the US–Ukraine reached a “19-point framework”, causing peace prospects to stall again.
However, secret negotiations among the US, Russia, and Ukraine in Abu Dhabi are still ongoing, though no major terms have been finalized.
With “war not stopping – negotiations not settled”, global risk sentiment remains tense.
This keeps medium–long-term demand for Gold strong.
But in the short term, price may still show wide swings around key technical zones before choosing a clearer direction.
H1 Technical Analysis – Head & Shoulders, Fibonacci, Volume Profile
The Head–Shoulders pattern is now clearly visible.
Price is currently in the right-shoulder completion phase, approaching upper resistance.
Gold at the moment is:
Hitting the Fibonacci retracement of the previous decline.
Also overlapping with the Fibonacci extension of the short-term bullish wave → high chance of reaction and volatility.
Below price, the 4090–4093 zone is a support/mini-POC area where Volume Profile thickens — ideal for a short-term Buy following the current bullish structure.
Above price, the 4185–4187 zone is a strong resistance cluster:
Confluence of potential right-shoulder top + old supply + Fibonacci extension.
This is the area I will prioritize for Sell setups once the pattern completes.
Notable Support/FVG zones:
4122–4116 (near support)
4169–4210 (mid-term FVG/resistance)
Reference Trading Scenarios
1. Buy with the current bullish wave (short-term)
Buy: 4091–4093
SL: 4085
TP: 4120 → 4145 → 4170 → 4190 → 4220
Logic:
Buy at the confluence support + small POC, taking advantage of the upward push completing the right shoulder.
Once the trade reaches +1R, shift SL to breakeven to protect capital.
2. Sell at the Head–Shoulders resistance zone (medium-term priority)
Sell: 4185–4187
SL: 4193
TP: 4170 → 4155 → 4130 → 4110
Logic:
This is a strong resistance zone overlapping the supply region and Fibonacci extension.
Only activate the Sell if H1/M15 shows clear rejection signals (pin bar, bearish engulfing, weak volume) around 4185–4187.
Additional Levels to Watch
Support – FVG: 4122–4116
Resistance – FVG: 4169–4210
Can be used for quick scalp opportunities, but the main scenarios remain:
Buy near 409x as long as major resistance hasn’t been touched.
Sell near 418x when the Head–Shoulders structure shows completion signs.

Brian – Gold game plan for the US sessionBrian – Gold game plan for the US session
Gold’s rally yesterday shook a lot of traders out of position – the move was slow, steady and unforgiving, making it hard both to get in and to get out. For now, the short-term trend is clearer on H1, while H4 is still in transition.
Fundamental view – the Fed is confusing everyone
Fed expectations for December have been on a roller-coaster:
The market went from pricing a 25 bp cut in December at over 90%,
Then collapsed those odds to below 30%,
And has now swung sharply back again – all within about a month.
That kind of violent repricing in rate expectations usually creates two things for gold:
underlying support as soon as the market believes in easier policy again, and
choppy two-way volatility around each new data print or Fed comment.
So the macro backdrop still leans supportive for gold, but you do not want to ignore intraday whipsaws.
Technical view – H1 bullish, H4 testing the top of structure
On the H4 chart:Price is trading above the rising medium-term trendline from late October, keeping the broader structure constructive as long as 4,000 holds.
We are now pushing up towards the descending trendline and a H4 supply/FVG band between roughly 4,160 and 4,200.
Higher up sits a larger FVG / resistance block around 4,280–4,330 – if price ever accepts above the current downtrend line, that zone becomes a realistic upside magnet.
On H1:Structure is clearly bullish with higher highs and higher lows after yesterday’s impulsive move.
The current leg is extended, so I prefer to buy dips into support or a clean retest, rather than chase at the top of the candle.
Core bias: still prefer buys with the trend. Shorts are tactical, only at clear reaction zones.
Key levels
Resistance / sell zones
4,167–4,169: short-term reaction zone at the descending trendline and FVG
4,200–4,220: upper part of the same supply area
4,280–4,330: major H4 FVG / supply above
Support / buy zones
4,110–4,113: intraday support and potential retest area
4,080–4,070: minor support from recent consolidation
4,040–4,020: deeper pullback zone
4,000: key structural support; a break here would damage the bullish case
3,884: level that would confirm a medium-term bearish shift if price breaks and holds below
Trade scenarios (reference only, not financial advice)
Scenario 1 – Primary long: buy the dip into 4,110
Idea: stay with the bullish H1 structure, use the first decent pullback to get a better entry.
Entry: 4,110–4,113
Stop: 4,105
Targets: 4,125 → 4,140 → 4,180 → 4,200
I want to see price pull back into this zone after a push higher, ideally with a rejection wick or bullish candle confirming buyers are still in control.
Scenario 2 – Tactical short: fade the trendline at 4,167–4,169
Idea: counter-trend scalp from a clean confluence of resistance and FVG.
Entry: 4,167–4,169
Stop: 4,175
Targets: 4,155 → 4,140 → 4,120 → 4,105
This is not a swing short – it is a tactical trade against the intraday trend. Size should be smaller, and I would look to lock in profit or move to breakeven quickly if price reacts in our favour.
Scenario 3 – Breakout long if the trendline gives way
If gold pushes through the descending trendline and holds above the 4,170–4,180 zone:
I will shift back to a breakout-continuation mindset, looking to buy pullbacks above the broken trendline.
The next upside magnets then become 4,220 first and eventually the 4,280–4,330 FVG.
As long as 4,000 holds, I respect the upside and prefer to position with the trend, not against it. If we ever see a daily close below 4,000 and then 3,884, the whole story flips and I’ll start treating rallies as selling opportunities.
Trade the structure in front of you, not the headline noise. Manage risk around the shifting Fed expectations, and let the levels do the heavy lifting.
If this breakdown helps with your game plan, follow Brian for more gold updates during the US session and drop your own view in the comments so we can compare scenarios.

XAUUSD – TUESDAY BREAKOUT BUY SETUP, WATCH REACTIONS AT FIBO...💛 XAUUSD – TUESDAY BREAKOUT BUY SETUP, WATCH REACTIONS AT FIBO 1.618–2.618 🎯
🌤 Overview
Hello everyone, Lana here 💬
After spending several days compressed inside a triangle pattern, Gold has finally broken the descending trendline on H1, absorbed liquidity around the FVG zone, and continued to hold above the breakout area.
This shows that short-term bullish momentum is currently favored, with price targeting the higher Fibonacci extensions.
Today the market is waiting for major data releases: CPI, PPI, retail sales… These numbers can create strong volatility, especially when gold is in an “overcrowded trade” condition.
If US consumer data comes in strong, a deeper pullback may appear after a liquidity sweep.
💹 Technical Analysis (ICT Perspective)
On H1, price has:
Broken the descending trendline of the accumulation triangle.
Retested the FVG + liquidity repurchase zone around 4.101–4.105 and bounced back upward.
The 4.133–4.135 area, previously resistance, has now turned into support — a suitable zone for a buy-on-dip strategy.
Technical Targets:
Fibonacci Extension 1.618 of the current bullish leg is around 4.16xx.
Fibonacci Extension 2.618 + major liquidity pool sits around 4.23xx–4.24xx, aligning with previous highs — a zone where sellers may show strong reaction.
Overall, as long as price stays above 4.10–4.11, the short-term bullish structure remains valid.
🎯 Reference Trading Plan
💖 BUY Scenario – Priority with Trend
Buy on breakout – current price zone
Entry: 4.130–4.133
SL: 4.125
TP: 4.150 → 4.175 → 4.198 → 4.230
Buy on deeper retest
Entry: 4.100–4.103
SL: 4.095 (you may choose a tighter SL instead of 3.995 for better R:R)
TP: 4.125 → 4.150 → 4.175 → 4.198
💢 SELL Scenario – Only Short-Term Reaction at Resistance
Sell: 4.167–4.169
SL: 4.175
TP: 4.150 → 4.133 → 4.110 → 3.990
This Sell setup is only for short-term scalping against the trend — priority is to close quickly at nearby TP levels.
⚠️ Important Notes
Today includes CPI, PPI, retail sales and other US data — spreads may widen and price can spike both ways.
Gold is currently a crowded trade, so after strong rallies, deeper washout moves can occur to shake out weak positions.
Best strategy:
Prioritize Buy setups at confirmed support zones.
Reduce position size before major news; avoid holding heavy trades through data releases.
Treat Sell setups only as fast in–fast out scalps.
🌷 5. Conclusion & Interaction – With LanaM2
In summary, the breakout from the H1 triangle supports the scenario of Gold continuing upwards toward the Fibo 1.618–2.618 extension levels, as long as price stays above 4.10–4.11 💛
Today, focus on finding clean Buy entries instead of chasing price, and be cautious during CPI & PPI releases.
If you found this useful, please 💛 Like – 💬 Comment – 🔔 Follow LanaM2 to get daily Gold insights on TradingView ✨

HOW FAR WILL GOLD RISE?
1. MARKET CONTEXT
Yesterday, during the Asian and European sessions, gold prices mainly moved sideways – accumulating within a narrow range.
In the U.S. session, gold prices broke strongly through the 413X region and formed:
Inverse Head and Shoulders pattern (iH&S)
The upward structure returns → buyers dominate
This indicates that the upward momentum has returned, and the market leans towards continuing to rise if it does not break the important support area.
Fundamental factors supporting buyers
The market is expecting the Fed to cut interest rates in December.
Tonight there is PPI news — an important indicator directly affecting inflation expectations and Fed expectations.
→ This could be a catalyst for strong volatility in the U.S. session.
2. MAIN TRADING DIRECTION FOR THE DAY
➡️ Prioritize BUY (look to buy) according to the main trend.
➡️ SELL is only reactive – for retracement, not the main trend.
3. POTENTIAL BUY ZONES
Beautiful support areas to look for buying opportunities today:
📍 BUY zone 1 – Nearest
413X (early day resistance and yesterday's breakout area)
→ Beautiful entry area for scalping or buy follow trend.
📍 BUY zone 2
4100 – 4103
→ Psychological support & structural confluence area.
📍 BUY zone 3
4088 – 4090
📍 BUY zone 4
4060 – 4065
→ Strong support area, look to catch the bottom in case of deep price correction.
4. REACTIVE SELL ZONES (ONLY SELL FOR RETRACEMENT)
Only sell when price hits the area — clear rejection signals appear:
📍 SELL zone 1 (nearest)
4180 – 4186
📍 SELL zone 2
4190 – 4195
📍 SELL zone 3
4202 – 4205
Safe SELL conditions:
Only sell counter-trend, prioritize scalping.
If these areas are strongly broken + H1/H4 candle closes, consider buyers winning, then do not sell anymore.
5. CAPITAL MANAGEMENT – RISK MANAGEMENT
SL = 10 points
TP = 10 points
RR ratio = 1:1.2
Do not hold positions through PPI news if not really sure about the pattern.
6. NOTES ON METHOD
Buy orders will dominate the day.
Sell only when there is a strong reaction at resistance.
Scalping: open orders on smaller timeframes (M1–M5–M15) to optimize Entry.
Always wait for price action confirmation (pinbar, engulfing, retest…) before entering orders.
7. SUMMARY
Today's tendency is mainly BUY, based on:
The return of the upward trend
Inverse Head and Shoulders pattern
Expectations of a dovish Fed
PPI news triggering volatility
Wishing everyone an effective trading day — total victory! 🔥💹

Warren Buffett Core Rules for Building Wealth!Hello Traders!
Warren Buffett is known as the “Oracle of Omaha” not because he picks magical stocks, but because he follows timeless principles that build wealth slowly and safely.
His rules are simple, but powerful, and every trader or investor can learn from them.
1. Rule No. 1: Never Lose Money
Buffett’s first rule is all about capital protection.
Before entering any investment, ask one question: “What is my real downside here?”
Building wealth starts with protecting what you already have.
2. Rule No. 2: Never Forget Rule No. 1
Most people break this rule because emotions take over.
They underestimate risk and overestimate their confidence.
A smart investor never lets their guard down.
3. Invest Only in What You Understand
Buffett only invests in businesses he clearly understands.
If you don’t understand how a company makes money, you shouldn’t invest in it.
Confusion always adds risk.
4. Be Fearful When Others Are Greedy, and Greedy When Others Are Fearful
When the crowd is celebrating, assets are usually overpriced.
When the market is in panic, opportunities quietly appear.
A contrarian mindset creates long-term winners.
5. Focus on Long-Term, Not Short-Term Noise
Short-term ups and downs are temporary.
Long-term business growth is what builds real wealth.
Buffett thinks in decades, not months.
6. Buy Great Businesses at a Fair Price
Don’t chase cheap stocks, chase quality.
A great business may look expensive today, but it can reward you for years.
Price is what you pay; value is what you get.
7. Do Not Rely on Market Predictions
Buffett ignores forecasts, experts, and predictions.
He studies the business, not opinions.
You don’t need to predict the market, you need to understand what you own.
8. Build an “Inner Scorecard”
Your decisions should follow your own principles, not public opinion.
Integrity and independence are at the core of Buffett’s philosophy.
Winning long-term requires your own standards.
9. Keep Emotions Out of Money Decisions
Emotional investing leads to guaranteed mistakes.
Patience, discipline, and consistency create long-term winners.
A calm mind makes better decisions.
10. Your Best Investment Is in Yourself
The strongest returns come from your skills, knowledge, and mindset.
Books, learning, and personal development give lifelong compounding.
A smarter you creates better financial choices.
Rahul’s Tip:
Wealth-building is not complicated, staying disciplined is.
Once you start thinking long-term, the market automatically starts rewarding you.
Conclusion:
Buffett’s rules are not just investing rules, they are life rules.
Protect your capital, stay patient, stay disciplined, and invest in becoming better every day.
Wealth grows slowly… until the day it grows suddenly.
If this post helped you understand Buffett’s principles better, like it, share your thoughts in comments, and follow for more timeless wisdom!

Inverted Cup & Handle Breadown in HALHAL is showing a textbook inverted cup and handle breakdown. Price failed to bounce above key support and triggered sharp downside, confirmed by a spike in put options. Pattern projects lower levels ahead—bearish setup for spot and options traders. Watch for continued weakness below support.

Bear - Bulls Fight Nifty ExpirySir/Mam,
Last published Idea worked perfectly to all my viewers/followers.
For tomorrow, if Nifty opens below 25900 < then the levels opens for 25700. For safe Trading buy 26150 PE and CE now it is 200.65 + 15.45 = 216.1
That's it !
Tomorrow expiry, Volume timing as follows -
9.15 - 10.00 am - Price flow
10.00 - 1.45 PM - No Trade zone, watch the market support and resistance.
1.45 - 2.00 PM - Choose best strike price (both CE and PE should be -80 to 85% negative)
2.00 PM - 3.00 PM - Buy CE and PE of same strike price and sell with one side profit.
3.00 PM - 3.30 PM - Just watch the Profit !
Hope you have nice trading day tomorrow.
Stay safe and Take care.
