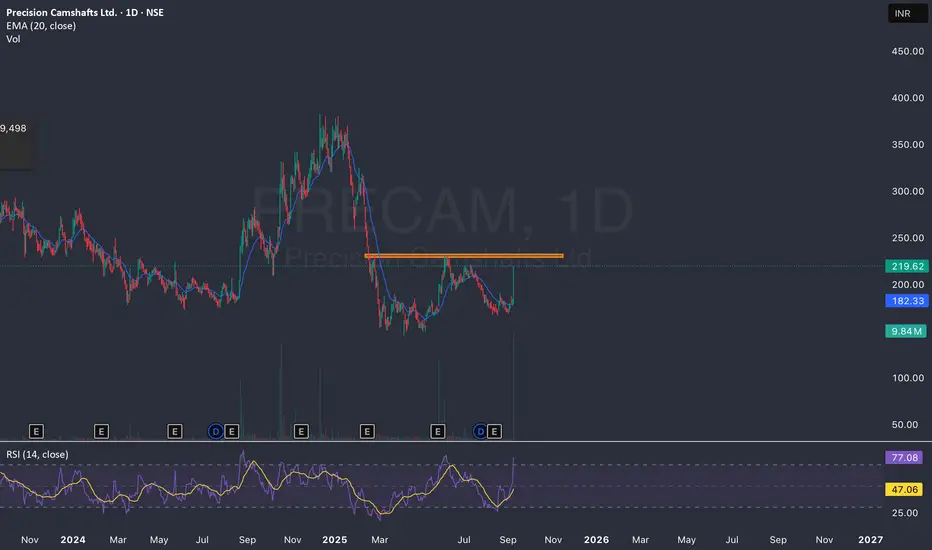
Precision Camshaft ready to fly (Volume spurt)Precision Camshafts Ltd is currently exhibiting notable technical momentum, with its RSI above 60 and a sharp increase in trading volume, pointing to strong short-term bullish sentiment. The company posted a robust net profit in Q1 FY 2025-26, and valuations remain sound with a P/E ratio near 45 and stable promoter holding. While fundamentals support a favorables outlook, recent volatility and historical September performance warrant close risk management and observation of broader market trends
• RSI above 60 signals bullish momentum, but watch for potential overbought conditions.
• Volume surge reflects active interest; rapid price swings increase short-term risk.
• Net profit up 62% YoY, yet revenue dropped 15.5%—mixed fundamental signals.
• Precision Camshafts has delivered negative returns in September across 7 of the last 10 years; seasonality adds caution.
• Valuation remains high (P/E ~45), requiring disciplined risk management for entries and exits
Fundamental Analysis
BUY TODAY SELL TOMORROW for 5%DON’T HAVE TIME TO MANAGE YOUR TRADES?
- Take BTST trades at 3:25 pm every day
- Try to exit by taking 4-7% profit of each trade
- SL can also be maintained as closing below the low of the breakout candle
Now, why do I prefer BTST over swing trades? The primary reason is that I have observed that 90% of the stocks give most of the movement in just 1-2 days and the rest of the time they either consolidate or fall
Resistance Breakout in ZOTA
BUY TODAY SELL TOMORROW for 5%

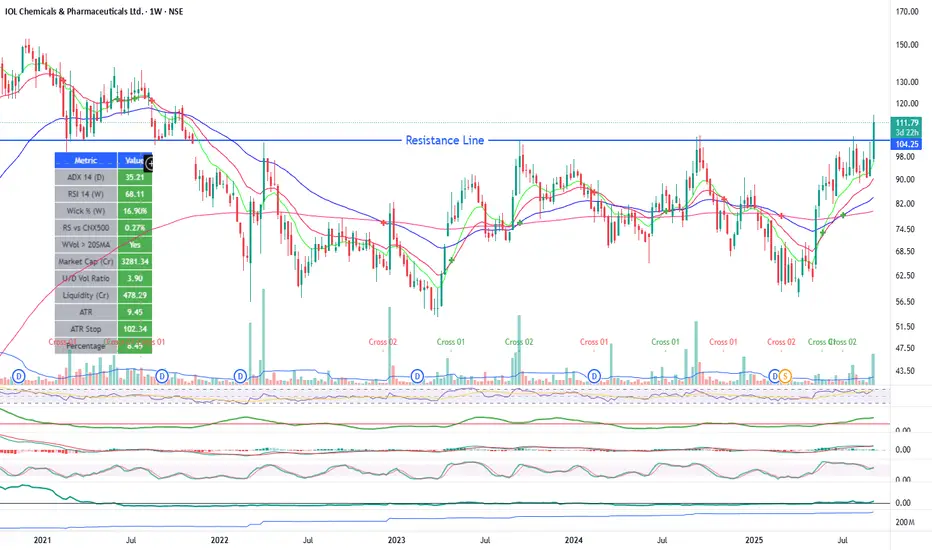
Ye Chart Kuch Kehta Hai - IOL LimitedBased on the weekly chart technical and fundamental outlook of IOL Limited (IOL Chemicals and Pharmaceuticals Ltd), here is the rationale why this stock is likely to grow over the next 2 to 3 months:
Technical Analysis
The weekly chart shows strong bullish signals with all key moving averages from 5-day to 200-day (SMA and EMA) indicating a bullish trend.
Multiple momentum indicators such as RSI, MACD, Stochastic RSI, and ADX are pointing towards bullish momentum, suggesting continued upward price movement.
The recent price performance has shown a positive weekly gain, confirming strength in the short to medium term.
Fundamental and Growth Outlook
IOL Limited is forecasted to grow earnings at approximately 26% per annum and revenue at around 11% annually, which indicates strong fundamental growth potential.
The company maintains a healthy market cap (₹3,325 Cr) with a reasonable P/E ratio (~27) for growth stocks in its sector.
ROCE (Return on Capital Employed) and other financial metrics indicate improving operational efficiency.
The strategic focus on specialty chemicals and pharmaceuticals positions the company well for long-term growth in a high-demand sector.
Risk Mitigation and Timing
Given the technical momentum and strong earnings growth prospects, coupled with a well-defined sector tailwind, the stock is favorably positioned for growth over the next 2-3 months.
The relatively low volatility as indicated by ATR and positive accumulation/distribution trends support a stable upward movement.
In summary, the combination of bullish weekly chart patterns aligned with robust earnings growth forecasts and solid fundamentals offers a strong rationale for the stock's potential appreciation in the near term (2 to 3 months)
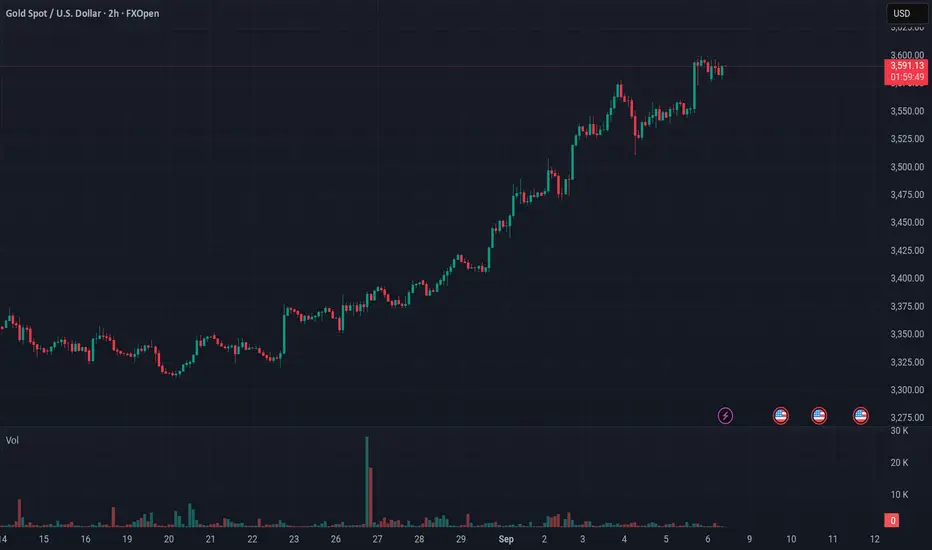
Gold Surges 37% YTD: Fed Cuts, Jobs Slump & Trade Setups!Namaste, traders! Gold (XAU/USD) has skyrocketed 37% in 2025, building on a 27% rally in 2024, fueled by a weakening USD, central bank buying, loose monetary policies, and global economic/geopolitical unrest. With US jobs growth tanking in August 2025 and unemployment climbing to 4.3%, markets are betting big on Fed rate cuts: 90% chance of 0.25% and 10% for 0.5% in September. Let’s dive into today’s (08/09/2025) action and uncover trading opportunities tailored for Indian investors! 💰
Fundamental Analysis: Why Gold Keeps Shining Bright 🌟
Massive Rally: Gold thrives in low-rate, high-uncertainty environments—perfect for India’s gold-loving market! Weak USD and central bank purchases are key drivers. 📈
US Jobs Slump: August data shows a sharp slowdown in hiring and a 4.3% unemployment rate, boosting Fed rate cut expectations and safe-haven demand.
Fed Drama Fuels Gold: Trump’s attempt to sack Fed Governor Lisa Cook and pressure for rate cuts has sparked legal battles, shaking USD confidence. Tariff tensions (Trump’s appealing to the Supreme Court after lower court losses) further drive gold as a hedge. Standard Chartered sees more upside amid these uncertainties.
Demand Dip in India: Record-high prices have slowed physical gold demand in India and China this week, but the bullish outlook remains strong for Indian investors chasing safety.
Gold’s your ultimate bet in this volatile market—will the Fed’s next move keep the rally alive?
Technical Analysis: Breakouts & Liquidity Grabs—Stay Sharp! 📉
In today’s early Asian session, gold dipped to 358x before a swift rebound, smashing last week’s ATH resistance at 3600 and hitting 361x. No major news triggered this spike, but continuous ATHs mean fast liquidity sweeps—beware of traps! Avoid FOMO: Focus on broken round levels for BUY setups or structure breaks at round numbers for SELL, but watch out for false breakouts.
Key Resistance: 3614 - 3624 - 3634 - 3644
Key Support: 3597 - 3581 - 3574 - 3566 - 3560 - 3550
Trading Opportunities:
Sell Scalp: 3624 - 3626
SL: 3630
TP: 3621 - 3616 - 3611 - 3606
Sell Zone: 3634 - 3636
SL: 3644
TP: 3626 - 3616 - 3606 - 3596
Buy Scalp: 3596 - 3594
SL: 3591
TP: 3599 - 3604 - 3609 - 3614
Buy Zone: 3581 - 3579
SL: 3571
TP: 3589 - 3599 - 3609 - 3619
Gold’s breaking out, but fakeouts are everywhere—wait for confirmations at key levels! If supports hold, bulls could push for new highs. 📊💡

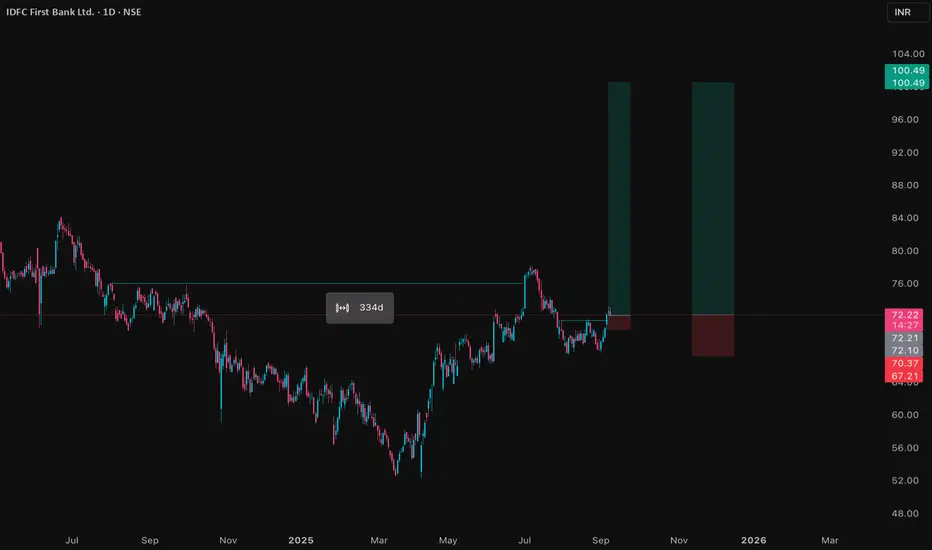
IDFCFIRSTB Price ActionIDFC First Bank is trading at ₹72.60 as of September 8, 2025, and maintains a solid presence in India’s private banking sector. The stock has a market capitalization near ₹53,264 crore, having seen an 8.7% gain over the last three months and a 25% rise over six months, while its year-on-year change is slightly negative. The share price is just below its 52-week high of ₹78.50, reflecting mild short-term consolidation after recent rallies.
Financially, IDFC First Bank continues to deliver growth: its annual operating revenue for FY25 approached ₹36,500 crore. Net interest margin remains strong at 5.6%, and the bank’s gross NPA ratio has declined to 1.87%, with net NPA at 0.53%, representing improved asset quality. Net profit for the previous year edged higher, and the latest quarter saw stable promoter holdings, a minor uptick in DII ownership, and balanced institutional participation.
The valuation remains elevated, with a price-to-earnings ratio of 40.78 and price-to-book near 1.4, as the market is factoring in future growth from retail advances, digital initiatives, and improving cost efficiencies. Technical indicators show the share trading above 50-day and 200-day averages, confirming ongoing bullish sentiment, and weekly stochastics point to strong price momentum. Dividend yield is modest but consistent, as the bank prioritizes growth and capital buffers.
Overall, IDFC First Bank offers a constructive outlook thanks to ongoing improvements in profitability, asset quality, and operational metrics. The bank is well-positioned for further gains if trends in retail lending, fee income, and digital channels remain favorable.
ZOTA Price ActionAs of September 3, 2025, Zota Health Care Limited is trading near ₹1,236. The stock has performed exceptionally well, gaining over 12% in the past month, 35% in three months, and more than 104% in one year. The price is near its 52-week high of ₹1,397, with the low for the same period at ₹535, underscoring significant volatility and appreciation.
Zota’s market capitalization is around ₹4,068 crore, classifying it as a small-cap company in the pharmaceutical sector. The company has reported strong operating revenue of ₹257 crore for the financial year ended March 2025, with sales and net profit showing solid growth rates. Key technical indicators (such as moving averages around ₹1,291 for the 5-day and ₹1,128 for the 50-day) show that the stock is currently well-supported by underlying market momentum.
Valuation metrics indicate a high price-to-earnings ratio, reflecting growth expectations already embedded in the share price. The company is not currently issuing dividends and maintains a robust financial position with stable equity capital. Near-term trading has seen the stock fluctuate between daily highs of ₹1,384 and lows of ₹1,337, with overall sentiment remaining positive due to continued sector expansion and operational progress.

Lupin LtdDate 08.09.2025
Lupin
Timeframe : Weekly Chart
Brands
(1) Lupin Life
(2) Lupin Diagnostics
(3) Life Atharv Ability
(4) SciFlix
(5) Humrahi
(6) Pharmarack
Leadership
(1) Respiratory
(2) Diabetes Care
(3) Cardiac Care
Lupin has partnered with Amman Pharma for exclusive marketing and
commercialization of Ranibizumab, a biosimilar of Lucentis, in the Middle East region, including select territories of Jordan, Saudi Arabia, UAE, Iraq, Lebanon, and other GCC countries
Sales Mix
(1) India 34%
(2) US 38%
(3) API 5%
(4) EMEA 10%
(5) ROW 4%
(5) Growth markets 9%
Valuations
(1) Market Cap ₹ 89,467 Cr.
(2) Stock P/E 24
(3) ROCE 21%
(4) ROE 20%
(5) OPM 23%
(6) PEG 0.48
(7) Sales Growth 12%
(8) Profit Growth 63%
(9) Promoter 47%
(10) DII 25%
Regards,
Ankur

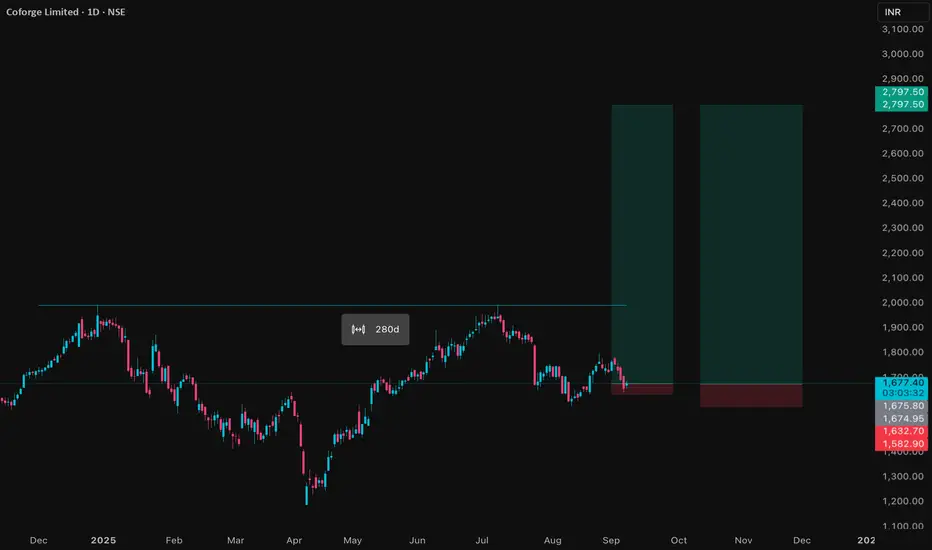
COFORGE Price AnalysisCoforge Ltd is trading near ₹1,675 as of September 8, 2025, undergoing mild recovery after a recent period of price consolidation. The stock’s market capitalization is around ₹56,000 crore, and average daily volume remains robust, reflecting solid institutional and retail participation. Coforge reached a 52-week high of ₹2,005 and a low of ₹1,194, highlighting significant volatility in the past year.
Recent quarterly revenue crossed ₹3,777 crore with net profit at ₹356 crore, showing resilience despite sector-wide macro uncertainties. Annual profit stood at ₹936 crore on a total income of ₹12,050 crore, as digital transformation and global IT services remain growth drivers. Operating profit margins are healthy and comparable to top industry peers, with cost controls and process efficiency supporting bottom-line growth.
Coforge trades at a price-to-earnings ratio above 50, reflecting the market’s expectation of future earnings growth. Technical indicators currently show support near ₹1,657 with minor resistance at ₹1,710; the stock is slightly below its 50-day moving average but well-supported over the medium term by improving fundamentals. The dividend yield is modest, as the company prioritizes reinvestment for expansion and client acquisition.
Overall, Coforge’s outlook is stable, bolstered by its diversified service portfolio, strong client relationships, and continued demand for IT and cloud services. Near-term swings may persist, but the stock remains attractive for investors seeking steady long-term growth within the IT sector.
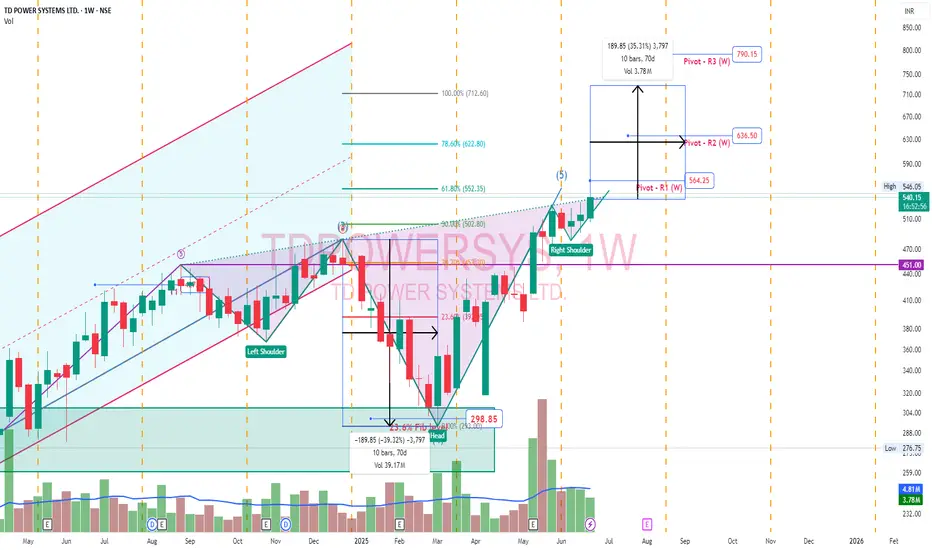
TdPowerSystem - Inverted Head & ShoulderTD Power Systems secured a ₹67 crore export order for traction motor components. This order is for delivery between 2026 and 2027
Inverted Head and Shoulder pattern. Pivot points plotted. Head would be ideal target. Right shoulder low would be long term stoploss.
Shriram Pistons 7.4Y BaseBigger the base, Bigger the target. H&S negated.
Disclosure: Invested. Position increased

TATAMOTORS Price ActionTata Motors is trading close to ₹1,028 as of September 8, 2025, retaining its strong uptrend following a year of robust price appreciation. The company’s market capitalization exceeds ₹3.6 lakh crore, underlining its position among India’s largest automotive manufacturers. After reaching new 52-week highs, the stock is experiencing healthy consolidation, with volumes remaining elevated—reflecting continued institutional and retail investor interest.
Recent quarterly earnings have showcased remarkable performance: net profits have doubled year-on-year, with total revenue growth driven primarily by the continued success of its passenger vehicles, electric vehicle segment, and global subsidiary Jaguar Land Rover. Operating margins are stable at healthy levels, as cost control and efficiency gains offset input price volatility. The EPS has consistently improved, confirming strengthening core profitability.
Technically, Tata Motors trades well above its key support levels and major moving averages, confirming bullish momentum. RSI and MACD oscillators indicate the trend is not overextended, and the stock remains attractive for both momentum and value investors. The company maintains prudent leverage and increasing free cash flow, ensuring capacity for capital expenditure, dividend payout, and strategic investments.
Long-term prospects are optimistic: Tata Motors is benefiting from shifts toward EVs, resilient domestic demand, and strong exports. The outlook is constructive, with potential for further capital gains, provided operational progress continues and sector tailwinds remain supportive.

Gold sentiment Here is a detailed technical and sentiment analysis for gold incorporating RSI, MACD, Ichimoku, and Volume, based on the charts and data you provided, followed by a concrete trading strategy.
Overall Sentiment: Bullish Exhaustion at a Critical Juncture
The market is in a state of powerful bullish momentum fueled by weak economic data (NFP) but is showing clear technical signs of exhaustion and overbought conditions. This creates a high-risk environment where a significant pullback is increasingly probable before any next leg up.
---
Technical Indicator Analysis
While your charts don't show the indicators directly, we can infer their likely state based on the price action and standard settings.
1. Relative Strength Index (RSI - Typically 14-period):
· Likely Reading: On the Daily (1D) and 4H charts, the RSI is almost certainly in overbought territory (above 70, likely even above 80).
· Analysis: This confirms the market is overbought. The minor pullbacks on the 2H and 4H charts (shown by the small red candles) are likely causing the RSI to dip from extreme levels, but it remains elevated. This is a classic warning sign of a potential reversal or consolidation.
2. Moving Average Convergence Divergence (MACD - Typically 12,26,9):
· Likely Reading: On all timeframes, the MACD is above its signal line and at or near extreme highs.
· Analysis: This supports the strong bullish momentum. However, on the shorter timeframes (2H, 4H), we should be watching for bearish divergence (price making equal or higher highs while the MACD makes lower highs). This would be a strong short-term sell signal. The current consolidation increases the probability of this divergence forming.
3. Ichimoku Kinko Hyo:
· Price vs. Cloud (Kumo): The price is ** dramatically above the Senkou Span (Cloud)** on the daily chart. This indicates an extremely strong bullish trend but also a massive extension from its mean, suggesting a pullback towards the cloud is a high probability.
· Tenkan-sen (Conversion Line) vs. Kijun-sen (Base Line): The Tenkan-sen is almost certainly far above the Kijun-sen, confirming the strong trend. A crossing below would be a strong short-term bearish signal.
· Future Cloud: The cloud is likely bullish (green) and thinning, suggesting underlying trend strength but potential for volatility.
4. Volume:
· Analysis: The COT report is a form of volume analysis. The ** surge in open interest (+49,148 contracts)** from the 09/02 report, driven by new speculator longs, represents a massive influx of volume and commitment. However, this often marks climactic buying, not a sustainable pace. In the price charts, the consolidation near the highs on declining volume would be a bearish sign, indicating a lack of new buyers at these levels.
Synthesis of All Factors
Factor Analysis Implication
Fundamental (NFP) Very Bullish. Weak data = weak USD, dovish Fed. Long-term trend is UP.
COT (Speculative Sentiment) Extremely Bullish (Overheated). Record net long positioning. High short-term risk of a sharp pullback.
Price Trend Bullish but Stalling. Consolidating at all-time highs. Indecision; potential exhaustion.
RSI Overbought on higher timeframes. Suggests a correction is due.
MACD Bullish but potential for bearish divergence. Momentum may be waning.
Ichimoku Price extremely extended from Cloud. Suggests a pullback is likely.
Volume (via COT) Climactic buying. Often marks a short-term peak.
---
Trading Strategy for Today
Core Principle: The trend is still up, but the risk/reward for new long entries at the current price is very poor. The optimal strategy is to wait for a technical correction to buy into strength or prepare for a reversal signal.
Scenario 1: Wait for a Pullback to Buy (Highest Probability & Prudence)
· Idea: Use the overbought signals and Ichimoku analysis to anticipate a pullback to a stronger support zone.
· Entry Zone: $3,480 - $3,520. This area aligns with previous resistance (now support) and a potential pullback towards the rising Tenkan-sen or Kijun-sen on the 4H chart.
· Confirmation: Look for bullish reversal candlesticks (hammer, bullish engulfing) and an RSI pulling back towards 50 (but not oversold).
· Stop Loss: A daily close below $3,450.
· Target: A move back towards the highs at $3,580 - $3,600.
Scenario 2: Breakout Trade (Lower Probability, Higher Risk)
· Idea: If the bullish momentum ignores all overbought signals.
· Entry: A sustained 4H or daily close above $3,610.
· Confirmation: The MACD should make a new high (avoiding divergence) and volume should increase on the breakout.
· Stop Loss: Below $3,590.
· Target: $3,650 - $3,680. Use a trailing stop.
Scenario 3: Aggressive Fade (For Experienced Traders)
· Idea: Fade the extreme bullish sentiment using bearish divergence and overbought RSI.
· Entry: On a clear bearish divergence on the 4H MACD (price makes a new high, MACD makes a lower high) AND a rejection from the $3,590 - $3,600 resistance level.
· Stop Loss: A close above $3,610.
· Target: $3,520 - $3,540.
Key Risk Management Note:
· NFP Event Risk: The next NFP release is TODAY (Sep 09, 19:30 GMT). This will cause massive, unpredictable volatility.
· Action: DO NOT enter new positions before this release. The market's reaction to the news will dictate the next major direction. If you are in a position, strongly consider reducing size or hedging.
Summary Table for Action
Strategy Entry Stop Loss Target Confidence
Pullback Buy $3,480 - $3,520 < $3,450 $3,580 - $3,600 High
Breakout Buy $3,610 < $3,590 $3,650 - $3,680 Low
Aggressive Fade ~$3,595 + Divergence $3,610 $3,520 - $3,540 Medium
Final Conclusion: The technical indicators (RSI, MACD, Ichimoku) all align with the COT data to scream "Overbought!" The fundamental driver is strong, but the market needs to cool off. The best trade is no trade until after the NFP news or a pullback into support. Patience will be rewarded with a much better risk-to-reward entry.
buy buy buybuy natco pharma @ 852 for a target of 1100 within 3 months .For more calls like this kindly contact to the above number (paid service,,,100% accuracy)..I have many stocks which will reach a potential target upto 50 percent minimum....Contact number is 7411839705

USD/JPY(202509008Today's AnalysisMarket News:
Non-farm payroll growth fell significantly short of expectations, with June's data revised downward to negative territory, marking the first contraction since 2020. The unemployment rate hit a nearly four-year high.
Technical Analysis:
Today's buy/sell levels:
147.57
Support and resistance levels:
149.28
148.64
148.23
146.92
146.51
145.87
Trading Strategy:
On a breakout above 148.23, consider a buy entry, with the first target price being 148.64.
On a breakout below 147.57, consider a sell entry, with the first target price being 146.92

BSE Price ActionBSE Limited (Bombay Stock Exchange) is trading near ₹2,240 in early September 2025, showing strong upward momentum over the past year. The stock has benefited from surging trading volumes, higher listing activity, and overall expansion in the Indian capital markets, which have driven revenue and profit growth. Operating margins have widened, supported by rising technology investments and stable costs.
Valuations are elevated, with price-to-earnings and price-to-book ratios reflecting future growth expectations and premium market sentiment. BSE maintains a healthy balance sheet with low debt and strong cash reserves, enabling flexibility for further product innovation and operational scale. Technically, the stock is trading above key moving averages, with volume patterns supporting ongoing bullish sentiment. Periodic profit-taking may occur, but BSE’s robust fundamentals and sector leadership keep its outlook favorable for long-term investors.

Tanlathis is spot with good r:r . going long makes sense and pile up more quantity as it breaks above the falling diagonal line that started with top . buy back shows company has confidence in coming quarters for a healthy book.

Davangere Sugar Company LtdTrade Information
Traded Volume (Lakhs) 489.61
Traded Value (₹ Cr.) 19.24
Total Market Cap (₹ Cr.) 569.14
Free Float Market Cap (₹ Cr.) 271.36
Impact cost 0.38
% of Deliverable / Traded
Quantity 65.48 %
Applicable Margin Rate 21.13
Face Value 1.00
Price Information
52 Week High (18-Sep-2024) 7.50
52 Week Low (14-Aug-2025) 3.06
Upper Band 4.77
Lower Band 3.18
Price Band (%) 20
Daily Volatility 2.71
Annualised Volatility 51.77
Tick Size 0.01
Securities Information
Status Listed
Trading Status Active
Date of Listing 25-Jan-2024
Adjusted P/E 50.24
Symbol P/E 50.24
Index NA
Basic Industry Diversified FMCG

Titan Company Limited – Fundamentals Meet Elliott WavesTitan Company, a jewel in the Tata Group crown, is best known for its dominant jewellery business , contributing nearly 90% of its revenue through brands like Tanishq, Mia, Caratlane, and Zoya. Watches and eyewear remain smaller segments, though they strengthen Titan’s brand presence. The company remains India-centric, with ~96% of revenues generated domestically.
On the numbers side, Titan continues to deliver steady revenue growth — ₹637B (TTM) with net income at ₹37B and EPS near ₹42. Margins, however, are modest: net margin hovers around 6–7% , while returns on equity stay robust at ~30%. Despite these positives, Titan trades at premium valuations — P/E ~88×, P/S ~5×, and EV/EBITDA above 50×, levels that price in a lot of growth. Dividends are token (~0.3% yield, ₹11/share), as the company reinvests heavily to fuel expansion.
The Elliott Wave Picture
On the weekly chart, Titan appears to have completed a W–X–Y corrective Wave 4 near ₹2,925. From there, Wave 5 has started unfolding:
Subwave 1: ₹2,925 → ₹3,665
Subwave 2: pullback to ₹3,307
Price is now pressing against resistance around ₹3,665–₹3,886.
A clear breakout above this zone would likely confirm the onset of a powerful Wave 3 of 5 rally , projecting targets between ₹4,047 (1.0× extension) and ₹4,504 (1.618× extension) .
Stop-loss / Invalidation: Below ₹3,307.
Momentum indicators back the case: RSI shows a rising trendline, hinting at strengthening bullish energy.
Putting It Together
Fundamentals: Strong brand, steady growth, high ROE — but expensive and reliant on Indian jewellery demand.
Technicals: Structure supports the case for a Wave 3 rally, provided price breaks out convincingly.
Balance: Titan remains a growth stock priced at perfection . If the breakout sustains, technicals could offer near-term upside, but stretched valuations mean risks shouldn’t be ignored.
Disclaimer: This analysis is for educational purposes only and does not constitute investment advice. Please do your own research (DYOR) before making any trading decisions.

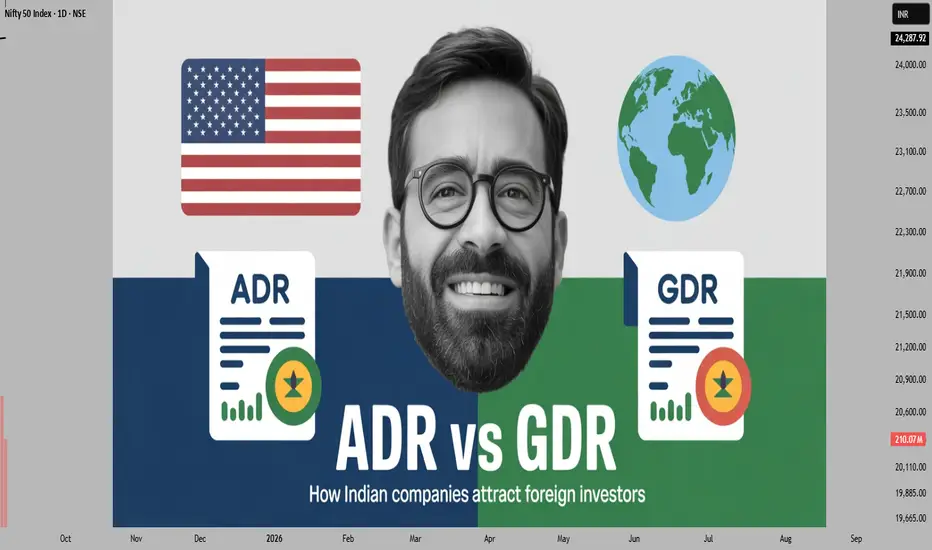
What is ADR/GDR – How Indian Companies Get Foreign Investors!Hello Traders!
You may have heard terms like ADR and GDR when companies talk about raising money abroad. These instruments allow Indian companies to get international investors without directly listing on foreign stock exchanges. Let’s understand them in simple words.
What is an ADR?
ADR stands for American Depository Receipt .
It is a certificate issued by a US bank that represents shares of a foreign company (like an Indian company). These ADRs trade on US stock exchanges just like normal US stocks.
Example: Infosys and Wipro have ADRs listed in the US.
Advantage: US investors can buy Indian companies without dealing with Indian exchanges.
What is a GDR?
GDR stands for Global Depository Receipt .
It works the same way as ADR, but instead of being limited to the US, GDRs are listed on global exchanges like London or Luxembourg.
Example: Many Indian companies raise funds through GDRs in Europe.
Advantage: Gives access to a larger pool of foreign investors.
Why Do Companies Issue ADR/GDR?
Access to Foreign Capital: Helps Indian companies raise funds from global investors.
Better Visibility: Being listed abroad increases global recognition of the company.
Diversified Investor Base: Attracts institutional investors who may not invest directly in Indian markets.
Liquidity: Allows more trading activity and easier buying/selling internationally.
Rahul’s Tip:
ADR/GDR listings are a sign that a company wants to expand globally and attract foreign capital. But as an investor, always check if the company is fundamentally strong before getting influenced by the “global listing” tag.
Conclusion:
ADR and GDR are simple tools that connect Indian companies with foreign investors.
While ADRs are limited to the US, GDRs open doors to global markets.
For long-term investors, these instruments show how Indian companies are scaling globally.
If this post made ADR/GDR clear for you, like it, share your thoughts in comments, and follow for more market education in simple language!
Stock Market is in Risk OnThe US market, as well as some assets, is in a risk-on mode.
Most assets have their own seasonality.
The chart above shows one of them:
In recent years, in the period July-September, a correction began on the US market.
A number of macro indicators also speak in favor of a correction and that it is overdue.
Risk appetite according to Morgan Stanley research has reached a historical maximum
Although seasonality does not guarantee a correction right here and now, but at least it gives reason to think about reducing long positions

We are not positive about TeslaThe impact of tariffs and expiring EV credits is expected to pressure future US deliveries and regulatory credit revenue in the near term
Elon Musk: Well, we're in this weird transition period where we will lose a lot of incentives in the US. Slab incentives actually in many other parts of the world. But we'll lose them in the US. Across all of it at the relatively early stages of autonomy. On the other hand, autonomy is most advanced and most available from a regulatory standpoint in the US. Does that mean we could have a few rough quarters? Yeah. We probably could have a few rough quarters. I'm not saying that we will, but we could. Q4, Q1, maybe Q2.
Revenue -12% y/y ( decline for the first time in 10 years)!!!
EPS 0,27 $ agj vs 0,39 $ estimated
FCF -89% y/y but still positive ( just 146 M$)
CAPEX for 2025 increased
EBITDA dropped by 7.8%.
Price to Sales 12,7
P/B 14
Expensive
We expect declining of the stock price to 210 $
And, yes, many still regard Tesla as a car manufacturer, but this is not a correct view of the company. Later in our blog we will touch on the question of how to correctly look at the brainchild of Elon Musk.

Bearish Trade Setup for SOLUSDOverview:
This is a short position on SOLUSD, entering on the 1-hour chart with a well-defined risk-to-reward ratio. The trade is based on a downward trend confirmed by the price action and EMAs, making this a high-probability bearish scenario.
Key Levels and Indicators:
Entry Point: 186.6736
The entry is triggered when the price moves below the resistance level. This confirms the continuation of the downtrend.
Stop Loss: 202.2042
The stop loss is set above the most recent swing high to protect from any sudden price reversals. This level is designed to avoid a whipsaw and ensures the trade is kept within a reasonable risk range.
Target: 155.5356
The target is calculated based on a projected price movement in line with the current trend. Given the current market structure, this target provides an optimal reward-to-risk ratio.
Why is this a Bearish Setup?
Trend Confirmation:
The price has been consistently moving lower, showing strong bearish momentum. The EMAs (9 and 20) are also sloping downwards, reinforcing the likelihood of further downside movement.
Price Action:
The recent price action has formed lower highs and lower lows, a key indication of a strong downtrend.
EMA Alignment:
The 9-period EMA (188.6387) is below the 20-period EMA (192.3233), a classic bearish crossover that confirms the downward bias of the market.
Risk-to-Reward Setup:
The trade offers an excellent risk-to-reward ratio of approximately 1:3, which ensures that potential profits outweigh the risk taken on the trade.
Trade Management:
Entry Criteria: Enter the position when the price breaks below the support zone, ideally near the entry point.
Exit Strategy: Target is set at 155.5356, but keep an eye on the price action in case a trend reversal occurs before hitting the target. Always adjust the stop loss to lock in profits as the price moves in your favor.
Final Thoughts:
This is a well-structured bearish trade idea based on both technical analysis and price action. Always ensure that you follow proper risk management rules and adjust your stop loss or take profit levels based on market conditions.

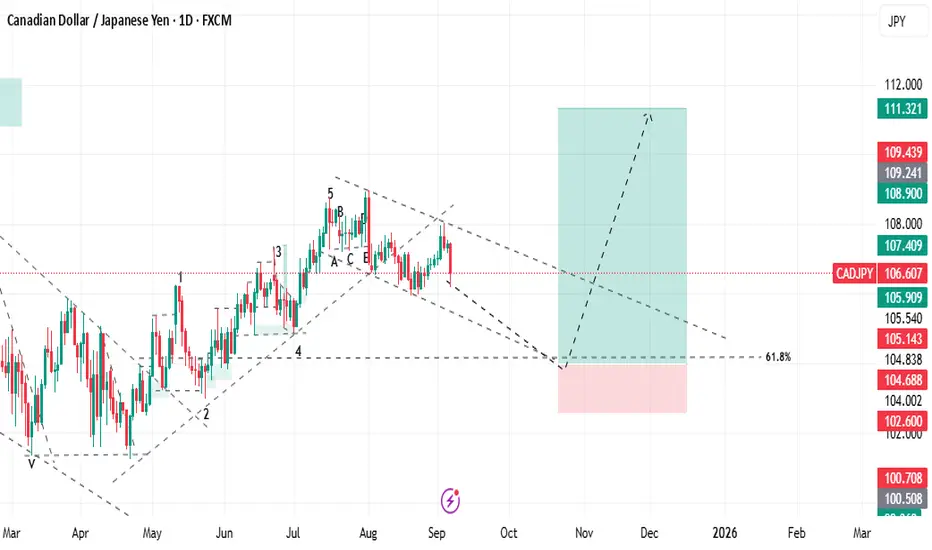
BUY CADJPY🚀 BUY CADJPY
Entry: 104.002
TP: 111.321 🎯
SL: 102.600 🛑
Bullish momentum in play — targeting higher levels! 📈
#CADJPY #ForexSignals #BuySignal #ForexTrading #PriceAction #ForexSetup #TradingSignal #ForexLife #Pips