Kajaria Ceramics Price ActionKajaria Ceramics is currently trading around ₹1,177, with a market capitalization close to ₹18,750 crore as of the end of July 2025. The stock has shown solid performance in recent months—up about 46% over the last quarter and nearly 19% in the past six months, although it experienced a mild 0.2% dip over the last week. Despite this rally, the stock is valued at a relatively high price-to-earnings (P/E) ratio of around 59 and a price-to-book (P/B) ratio of approximately 6.6, suggesting that it is trading at a premium to its asset base and compared to industry averages.
Profit growth has lagged sales growth, with annual sales increasing modestly but profit growth remaining subdued. The 52-week price range is quite wide, with a high of ₹1,579 and a low of ₹759, reflecting periods of both volatility and strong recoveries.
Analyst outlook remains moderately positive, with one-year price targets averaging near ₹1,259 but estimates ranging widely from ₹731 to ₹1,716. Near-term forecasts mostly see the price consolidating between ₹1,150–₹1,200, with oscillations rather than sustained moves upward or downward.
In summary, Kajaria Ceramics stands out for its recent price momentum and market strength. However, its stretched valuation multiples and only moderate earnings growth highlight the need for careful consideration if expecting further near-term appreciation. The company's premium valuation is reliant on continued improvement in industry demand and profitability. Its financial position and recent run-up make it a stable but potentially fully valued pick at present levels.
Fundamental Analysis

TIINDIA Price ActionTata Investment Corporation Ltd (TIINDIA) is mainly an investment holding company, and its share price reflects both its portfolio performance and market sentiment. At present, the company maintains a very strong financial position with almost no debt, providing security for shareholders. Its stock is trading at a valuation close to its book value, suggesting a fair price relative to its underlying assets.
However, the actual returns from TIINDIA’s own operations remain modest. Return on equity is low and profit growth has been muted in recent years, which indicates limited profitability from its core business. The company’s strong dividend history provides stable income to investors, but earnings growth remains subdued.
Despite a substantial rise in the stock price over the past several years, more recent performance has slowed, aligning with weaker earnings growth. The high price-to-earnings ratio, when compared to its limited profit generation, implies that the stock may be fully valued or even expensive at current levels. Future upside for TIINDIA is likely to depend heavily on a significant rebound in the market value or profits of its investment portfolio. Overall, TIINDIA offers stability and low financial risk, but prospects for sharp appreciation are currently limited unless there’s a meaningful turnaround in its earnings or portfolio companies.
Route Mobile Bottomed-out for Highest UpsideMy Stock View and Opinion:
Double-bottom pattern identified, Huge upside potential as enterprise communication continues to evolve globally.
Strategic Moves:
1) Successful integration with global CPaaS major Kaleyra, unlocking access to 100+ countries and Tier-1 enterprise clients.
2) Backed by Proximus Group (Belgium), enhancing global reach and enterprise credibility.
3) Collaboration with Nokia to deliver secure, carrier-grade CPaaS services to telecom operators globally.
Strong execution capabilities, strategic partnerships with global telecom leaders, scalable SaaS-driven model, and growing demand for digital engagement platforms position Route Mobile for sustained multi-year growth.

Zuari Price ActionAs of July 24, 2025, Zuari Agro Chemicals Ltd is trading around ₹215 to ₹218 per share. The stock has shown a recent slight decline of about 1.27% on that day. Its market capitalization is approximately ₹900 crore, placing it among the mid-sized chemical and fertilizer companies.
The 52-week price range for Zuari Agro Chemicals is between ₹169 and ₹268, reflecting moderate volatility over the past year. The stock is trading closer to the lower-middle part of this range, about 18–20% below its 52-week high.
Fundamentally, the company demonstrates reasonable valuation metrics, with a price-to-earnings (P/E) ratio near 5.5, which is quite attractive compared to the sector average, and a price-to-book (P/B) ratio below 0.5, indicating it is trading at a significant discount to book value. Recent earnings per share show solid growth, contributing to strong profitability metrics.
Operationally, Zuari Agro Chemicals continues to build stable revenues within the fertilizers segment, benefitting from sectoral demand and government policies supporting agriculture inputs. The company maintains average financial strength with ongoing measures to reduce debt and improve operational efficiency.
On the technical front, the stock has experienced some consolidation after modest gains over recent months but remains vulnerable to market sentiment shifts in the commodity and fertilizer sectors.
Overall, Zuari Agro Chemicals offers a fair valuation entry for investors seeking exposure to the fertilizer industry with moderate risk. The current price implies value relative to its historical range, supported by steady earnings, though the stock price is subject to volatility driven by agricultural commodity cycles and sector-specific factors.

Swiggy Ltd. Reserch ReportBuy/Sell/Hold Recommendation:
Given Swiggy’s strong revenue growth but continued losses and negative cash flows, the stock currently represents a high-risk, high-reward opportunity. Unless you have a high risk appetite and a long-term horizon, a "Hold" stance is appropriate—wait for visible margin improvement and positive cash flows before considering aggressive buying. For conservative investors, it’s best to avoid new buys until profitability and sustainable cash generation are in sight. Only enter or add if Swiggy shows concrete signs of turning profitable and scaling successfully.
HOld (Overvalued)
Swiggy Investment Report: Independent Strategic & Financial Outlook
Introduction
Swiggy, a leading player in India’s food delivery and quick commerce industry, continues to pursue aggressive growth and operational dominance, shaping its own strategic path amid sector challenges.
Financial Metrics
In FY25, Swiggy posted revenue of ₹15,227Cr but remained loss-making with a net deficit of ₹3,117Cr and negative EBITDA margins, reflecting heavy investment in technology, logistics, and expansion—especially in its Instamart quick commerce division. Capital expenditures and higher working capital are keeping free cash flows negative (-₹2,693Cr in FY25), underscoring the company’s high-growth, cash-consuming phase.
Strategic Progress & DCF Valuation
Swiggy’s management aims for positive cash flows and margin turnaround, with plans to steadily improve profitability by scaling operations and increasing efficiency. A detailed DCF analysis, based on realistic growth and margin improvement assumptions (cost of equity 11.79%, terminal growth 10%), implies an intrinsic value of around ₹143 per share—indicating the current market cap still prices in optimism about future execution.
Key Takeaways
Swiggy operates in a capital-intensive, competitive market, facing margin pressure but also strong revenue momentum.
Ongoing board and policy reforms reflect the company’s drive for operational maturity.
Long-term success hinges on rapid margin improvement, successful turnaround of Instamart, and conversion of scale into sustainable profits.
Conclusion
Swiggy’s independent outlook shows promise with its robust platform and growth potential, but significant risks remain until losses are narrowed and cash flows turn consistently positive. For investors, Swiggy presents a high-risk, high-reward bet—success will be determined by its pace of execution and ability to transition from investment-driven growth to profitable leadership in India’s booming delivery market.

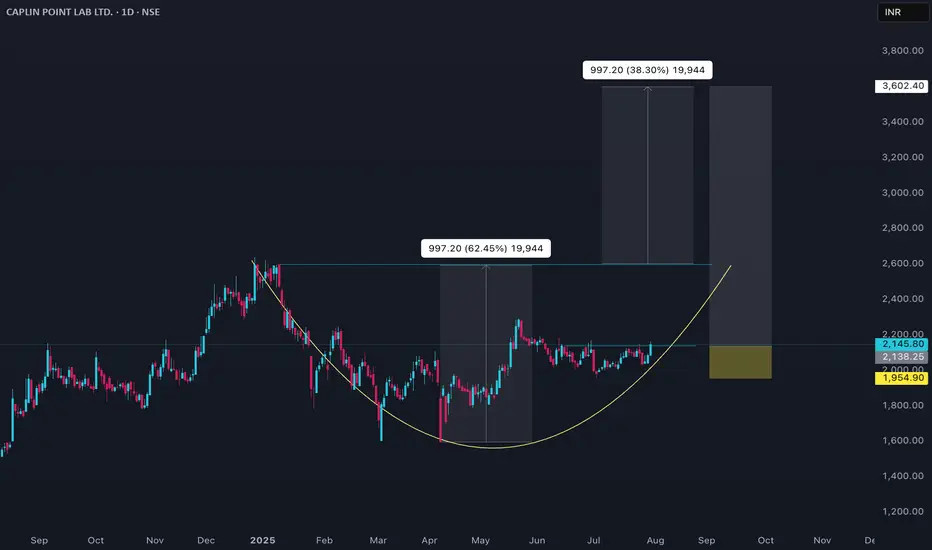
CAPLIPOINT Price ActionAs of July 31, 2025, Caplin Point Laboratories Ltd (CAPLIPOINT) is trading near ₹2,085, showing a mixed but steady performance with some recent price fluctuations around this level. The stock briefly touched intraday highs around ₹2,095 and lows near ₹2,030, maintaining support in the ₹2,030–₹2,055 range. Market capitalization stands broadly near ₹15,590 crore.
Caplin Point benefits from solid fundamentals in the pharmaceutical sector, supported by consistent revenue growth and operational efficiencies. The price-to-earnings ratio sits around 29, while the price-to-book ratio is approximately 5.5, indicating premium valuation relative to book but in line with sector expectations. Dividend yield is low at about 0.15%, reflecting the company’s focus on growth over payout.
Technically, the stock tends to hover above its medium-term moving averages like the 50-day and 200-day SMAs, showing cautious bullish momentum, although near-term volatility remains. Trading volumes are moderate, and the relative strength index is near mid-range levels, suggesting balanced momentum without overbought or oversold extremes.
Overall, Caplin Point Laboratories currently reflects steady fundamentals with a valuation premium typical of its pharma peer group, supported by stable trading ranges and positive medium-term technical signals. The near-term outlook remains cautiously optimistic, with key support near ₹2,030 and potential resistance around ₹2,100–₹2,120.
Jubilant Price ActionAs of July 31, 2025, Jubilant Pharmova Ltd is trading around ₹1,236, showing strong bullish momentum with gains of over 7% in recent sessions. The stock has recovered well from lower levels near ₹1,170 seen earlier, with sustained buyer interest and solid volume support. Technical indicators reveal that the price is above its short-term moving averages, reflecting positive market sentiment.
Fundamentally, Jubilant Pharmova maintains a robust position in the pharmaceutical and life sciences sector with steady revenue growth and improving profitability. The company benefits from a diversified business model and ongoing operational efficiencies, which have helped it sustain earnings growth amid industry challenges. Valuation metrics like the price-to-earnings ratio are moderate, reflecting reasonable investor confidence relative to sector peers.
The near-term outlook for Jubilant Pharmova appears constructive, with potential for further upside provided it holds above key support levels around ₹1,170–₹1,180. Momentum indicators and volume trends support the continuation of the uptrend, although investors should remain cautious of profit-booking risks after sharp rallies.
In summary, Jubilant Pharmova demonstrates solid fundamental strength and positive technical signs, making it an appealing choice for investors seeking exposure to the pharmaceutical sector with a growth orientation.

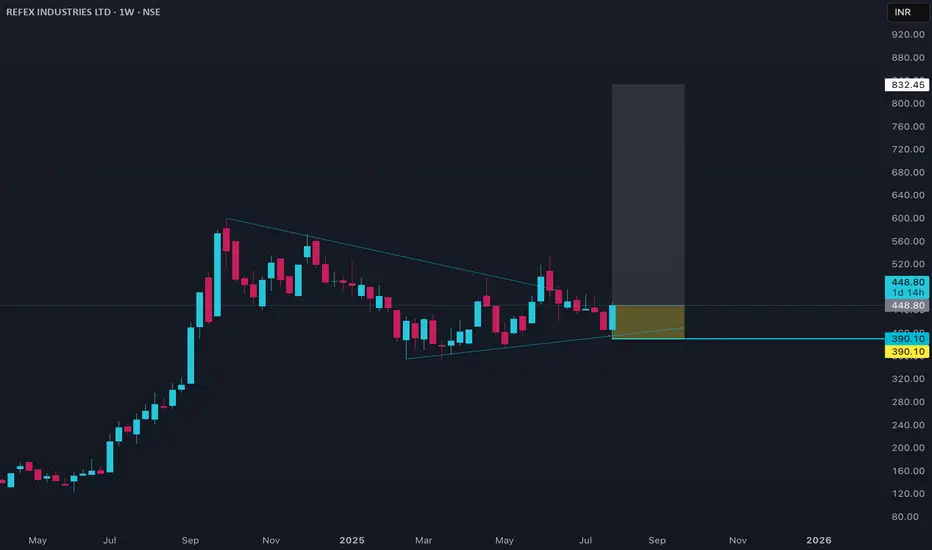
Refex Price ActionAs of July 31, 2025, Refex Industries is trading near ₹448, showing strong bullish momentum with recent gains of about 10% in the last day. The stock has held well above key support levels near ₹400–₹430, indicating solid buyer interest. It has a market capitalization close to ₹5,800 crore.
Fundamentally, Refex Industries carries a price-to-earnings ratio around 33 and a price-to-book ratio above 4, which suggests a premium valuation supported by solid profitability—the return on equity stands near 30%. Technically, the stock trades above short- and medium-term moving averages such as the 5-day, 10-day, and 20-day SMAs, with some resistance expected around ₹450–₹465. Breaking above this level could open further upside potential toward ₹480–₹500. Volume trends in recent sessions confirm the strength of the price move, and the relative strength index (RSI) indicates room for further upside before becoming overbought.
In summary, Refex Industries exhibits strong upward price action backed by healthy fundamentals and volume support. Key levels to watch include support near ₹400–₹430 and resistance at ₹450–₹465, with the near-term outlook remaining constructive on sustained momentum.
NIACL Price ActionAs of July 30, 2025, New India Assurance Company Ltd (NIACL) stock closed near ₹204, showing a strong recovery with a sharp rally of around 17% in a single day fueled by robust Q1 earnings and positive market sentiment. The stock bounced back from earlier volatility and support levels near ₹170, with technicals indicating bullish momentum supported by moving average crossovers.
NIACL’s recent financial performance has been impressive with an 80% surge in net profit year-on-year and a 13% growth in gross written premiums, reflecting strong industry position and operational gains. Its market capitalization stands near ₹33,676 crore with a price-to-earnings ratio around 32 and a price-to-book ratio about 1.2, suggesting valuation in line with sector averages but on the higher side.
While the stock has faced some volatility and a one-year decline near 27%, it has gained nearly 19% over the past three months, driven by improved underwriting efficiency and investment income stability. Analysts remain cautiously optimistic about its near-term upside potential, assuming continued operational improvements and support at key price levels.
In summary, NIACL currently presents a turnaround profile with renewed earnings strength, improving fundamentals, and constructive technical signals, making it an interesting candidate for medium-term investors willing to tolerate some volatility.

Enrin - Breakout.Incorporated in 2024, Siemens Energy India Ltd is a leading energy technology Provider, delivering integrated solutions across power generation and transmission systems.
Company's fundamentals are good and current valuation is also good.
It has a breakout with good volume and poll and flag pattern.

Greaves Cotton Ltd - Near breakoutGreaves Cotton is engaged in manufacturing of engines, engine applications and trading of power tillers, spares related to engines, electric vehicles and infrastructure equipment etc.
Stock is ready to give breakout and looks good to buy.

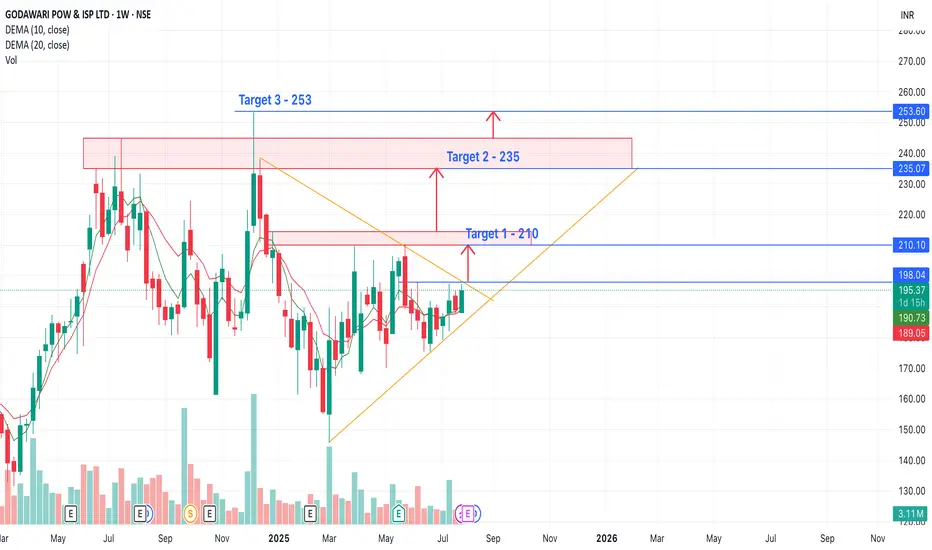
GPIL - Near BreakoutGodawari Power & Ispat is mainly engaged in the business of Mining of Iron Ore and Manufacturing of Iron Ore Pellets, Sponge Iron, Steel Billets, Wire Rods, H.B. Wire and Ferro Alloys with generation of Electricity.
Market Cap: ₹ 13,084 Cr.
Promoter holding: 63.5 %
FII holding: 6.51 %
DII holding: 2.67 %
Public holding: 27.3 %
Debt: ₹ 309 Cr.
Debt 3Years back: ₹ 428 Cr.
Stock near resistance, Above 198 look breakout and good to buy and hold.
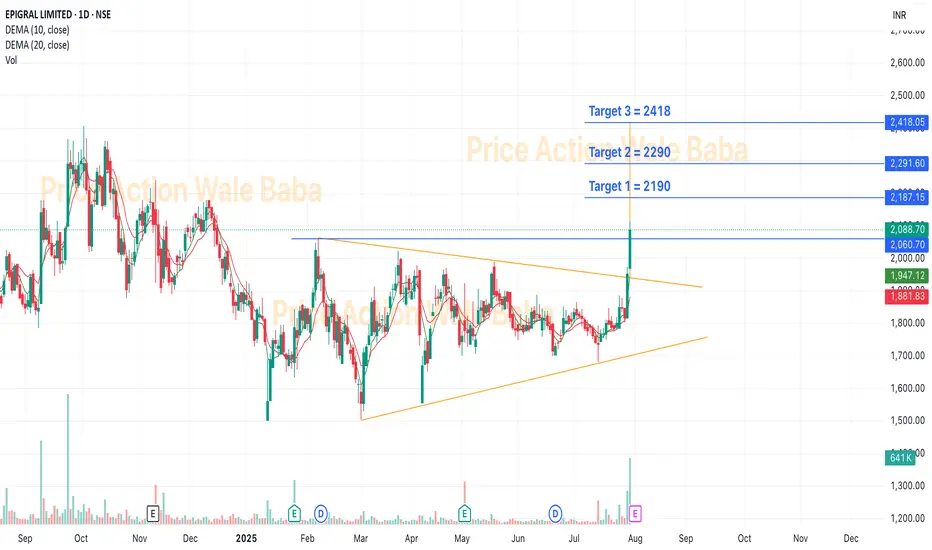
EPIGRAL - BreakoutEpigral Limited, formerly known as Meghmani Finechem Ltd, incorporated in 2007, is a leading integrated manufacturer of chemicals in India. Epigral’s Dahej facility is a backward and forward integrated and automated complex with a well-planned infrastructure.
In India, Epigral is the first to set up an Epichlorohydrin plant and largest capacity plant of CPVC Resin. Epigral is also a leading manufacturer of Caustic Soda, Caustic Potash, Chloromethanes, Hydrogen Peroxide, Chlorine and Hydrogen.
Breakout from the Triangle pattern
Market Cap: ₹ 8,996 Cr.
Promoter holding: 68.8 %
FII holding: 3.06 %
DII holding: 4.78 %
Public holding: 23.3 %
Debt: ₹ 593 Cr.
Debt 3Years back: ₹ 993 Cr.
GVT&D Price ActionGE Vernova T&D India Ltd (GVT&D) has experienced a significant surge, with its stock price around ₹2,597 as of July 30, 2025. Over the past year, the stock delivered an impressive return of about 61%. Over three years, the returns are even more dramatic, exceeding 2,100%. However, the broader financials reveal a company with mixed metrics.
The stock’s high price-to-earnings (P/E) ratio and price-to-book value suggest it is currently overvalued compared to peers and the market average. Analyst forecasts for the next 12 months range between ₹2,005 and ₹3,000, with a consensus target near ₹2,450. Most analysts continue to view the stock favorably and assign it a “strong buy” outlook, though with caution about its rich valuation.
GVT&D’s profitability stands out; it has shown robust growth in both operating profit and earnings per share recently. Return on equity has climbed above 40% in the past year, indicating efficiency in generating returns for shareholders. The company is also almost debt-free and maintains stable cash flows, which reduces financial risk.
Volatility for GVT&D is slightly higher than the market average, but price movement has been relatively stable, with no extreme swings in recent months. Still, investors should be aware that such high past returns may not be sustainable, especially with modest sales growth and valuation multiples well above industry norms.
In summary, GVT&D remains a high-performing and highly-valued stock in the Indian power equipment sector, with strong recent momentum, robust profitability, and a largely positive market outlook—albeit with potential risk due to elevated pricing and slower sales growth compared to its historic surge.

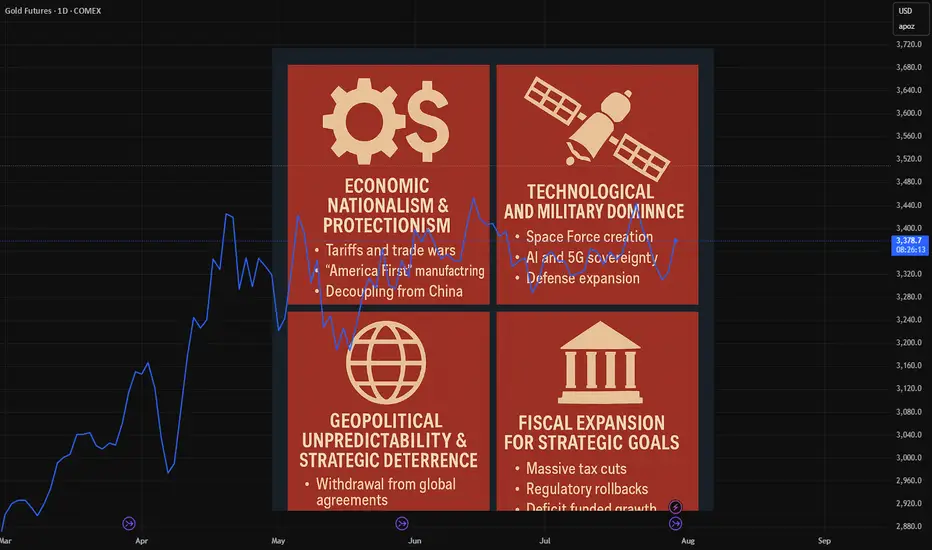
Trump's broad policies to secure America's hegemony.Hello trader and an investor,
Here, I am telling you about Trump's extensive policies that will secure America's dominance, but only in brief format. See below.
1. Unresolved Issues:
* Economic overheating impact on US Hegemony.
* Expansionary Fiscal policy sustained accumulation of Debt Burden.
* Instability of Dollar & US Treasuries status , rising Threat from China.
2. policy Responses:
* Fiscal policy: Tax cuts to stimulate economic growth and Expanded national defense spending.
* Monetary policy: Rate cuts, End of balance sheet reduction.
* Trade & External policy: Tariff revenue, Fiscal subsidies.
* Regulatory Measures: stabilize banking sector and maintain US Treasury market loosen Supplementary Leverage Ratio (SLR).
* Technological competition: Promote AI and infrastructure development, Revitalize nuclear energy.
3. Legislation & Government Actions:
* One Big Beautiful Bill Act.
* Nomination of new Fed chair.
* Reciprocal tariffs & industrial tariffs.
* GENIUS CLARITY.
* AI initiative & nuclear revival plan.
4. Beneficiary sectors:
* AI , Semiconductors, Defense.
* Broad- based ( Tech, Agriculture, Manufacturing).
* Blockchain & key technologies.
* AI, Nuclear Energy
H&S Breakout Timken IndiaH&S Breakout with confirmation candle.
Financials are strong & posted good results.
There should be a quick move to achieve the targets.
This is no any recommendation for trade. This is only for educational purpose.

BUY TODAY SELL TOMORROW for 5%DON’T HAVE TIME TO MANAGE YOUR TRADES?
- Take BTST trades at 3:25 pm every day
- Try to exit by taking 4-7% profit of each trade
- SL can also be maintained as closing below the low of the breakout candle
Now, why do I prefer BTST over swing trades? The primary reason is that I have observed that 90% of the stocks give most of the movement in just 1-2 days and the rest of the time they either consolidate or fall
Consolidation Breakout in MBAPL
BUY TODAY SELL TOMORROW for 5%

Craftsman Automation - Cup and handle breakout Craftsman Automation - Cup and handle breakout
Fundamentals
MCAP- 14000 Cr
PE - 48.7 > Industry PE of 36.91
PEG Ratio is 1.9
Debt to Equity is 1.06 and ICR is 5.19
ROE is 20%, ROCE is 20% ( 5yr ROCE is 17%)
Sales growth is 29%, 5yr Sales growth is 19%
Profit Growth is 6%, 5yr Profit growth is 25%
Promoter holding is 48% , down 6% in last quarter
FII AND DII Holding has gone up.
Latest results - Revenue beat, but earnings was negative surprise
Technicals
CMP - 5785
Bullish - Above EMA 9, 21,63, 200 on daily charts , RSI(14) is 70
Commentary
As seen in the charts , the stock has been trading in the parallel channel since its IPO in 2021.
It has also formed a cup and handle formation from Dec 2023 to till date.
The cup low is ~4000 and cup high is 5500.
As of today, 8/23, the stock has breached out of the cup and handle formation and touched 5800 levels.
Target :
T1 : As per the channel, the stock should march higher and reach channel highs around 6000-6200 by end of this year 2024
T2 : As per cup and handle , 7000 buy mid to late 2025
Disclosure 1 - Invested
Disclosure 2 - Not SEBI Registered
Disclosure 3 - This is Not investment advice. Treat it as educational

Kriti Nutrients Ltd
Kriti Nutrients Ltd. is currently trading at 110.85 INR, up 5.02% as of July 30, 2025, with a market cap of about 557 Crore INR.
The company seems financially stable, being almost debt-free, which may appeal to investors.
Recent Q3 2024 results show total income up 4.26% year-over-year at Rs 175.41 Crore, with a net profit of Rs 8.25 Crore, suggesting some positive momentum.
Management appears stable, led by Chairman Shiv Singh Mehta and a board including Purnima Mehta and others.
The stock has shown a likely upward trend since mid-2023, rising from around 40 INR to 110.85 INR, which could indicate growth potential.
Trading volume is relatively low at 18.97K shares, which might affect liquidity.
Historical sales growth has been slow at 7.13% over five years, but recent quarterly improvements suggest possible recovery.
The company focuses on soya seed extraction and cooking oil under the "KRITI" brand, serving retail and industrial markets.
Promoter holding is high at 66.7%, which may indicate strong control but also potential alignment with shareholder interests.
The evidence leans toward Kriti Nutrients being a potentially attractive investment in the agro-processing sector, given its debt-free status and recent performance, though investors should consider the slow historical sales growth.

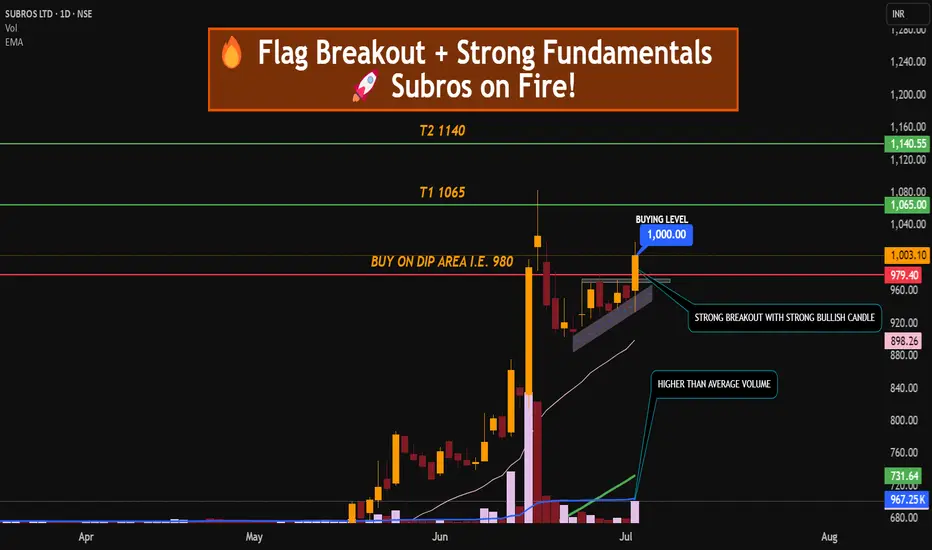
FLAG BREAKOUT + STRONG FUNDAMENTAL = AUTO STOCK ON THE MOVE SUBROS ON FIRE
Subros Ltd has formed and broken out of a bullish flag pattern on the daily chart, supported by strong volume, indicating continuation of its upward trend.
🔍 Technical Analysis:
Pattern: Bullish flag breakout
Breakout Confirmation: Strong bullish candle above consolidation (flag zone) with volume
Strong uptrend, supported by both EMA 20 and EMA 50
Support Zone: ₹950–₹960 (previous flag top)
Volume Spike: Confirms bullish momentum on breakout
QUIK FUNDAMENTAL KEYS WHICH CONFIRM ITS BULLISHNESS.
📈 Price Strength: Strong momentum with recent 52-week high
💰 ROCE: ~17.3% (efficient capital usage)
🏦 ROE: ~12.5% (shareholder return strength)
📉 Debt to Equity: ~0.2 (low debt = financially stable)
📊 Net Sales Growth: ~20% YoY (consistent top-line growth)
🔧 Sector: Auto Ancillary – strong demand recovery cycle
💡 Trade Rationale:
Subros is technically strong with a clean flag breakout and volume confirmation. Fundamentals support this move, with consistent revenue growth, efficient capital usage, and a low-debt structure.
TRADE PLAN :
Entry: Around ₹1000 (CMP) or on dip near ₹960–₹970 (retest)
Stop Loss: ₹940 (below consolidation)
Target 1: ₹1065
Target 2: ₹1120–₹1140
Risk-Reward: ~1:2.5+
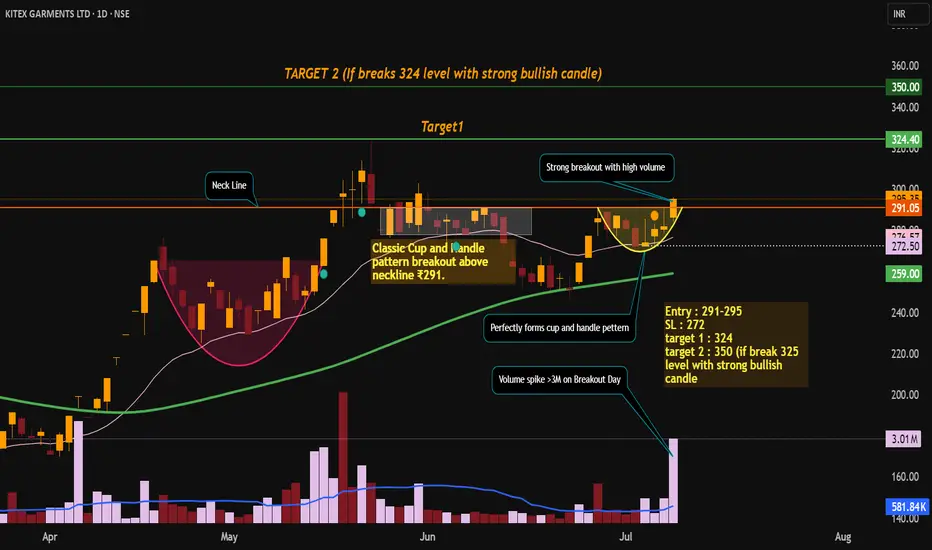
KITEX GARMENTS LTD – SWING TRADE PLANKITEX GARMENTS has delivered a volume-backed breakout from a bullish cup & handle pattern. The technicals are aligned with improving fundamentals, making this a high-probability swing trade setup.
✅ Cup & Handle Breakout 💥
📈 Entry: ₹291–₹295 | 🎯 Target: ₹324 / ₹350 | 🔐 SL: ₹272
🧠 Strong volume + solid fundamentals
Technical Analysis
Classic Cup and Handle pattern breakout above neckline ₹291.
Strong bullish close at ₹295.35 with high volume (3.01M vs avg 580K).
Price above 20(276) & 50 (259) EMA which confirms confirms bullish trend. Both the EMAs slopping upward which shows positive trend structure.
price can take support near ₹274–₹276 (handle + 20 EMA).
Resistance ₹324 (Target) (swing high), ₹350 (measured move target).
Volume spike confirms real breakout, not a fake breakout.
Demand zone breakout with institutional interest.
FUNDAMENTAL KEYS WHICH SUPPORT STOCK FOR BULLISH TREND.
KITEX is financially sound with low debt, stable returns, and improving growth. Fundamentals support bullish technical setup. High promoter confidence (>60%). Consistently company's sales growth is improving Q-o-Q.
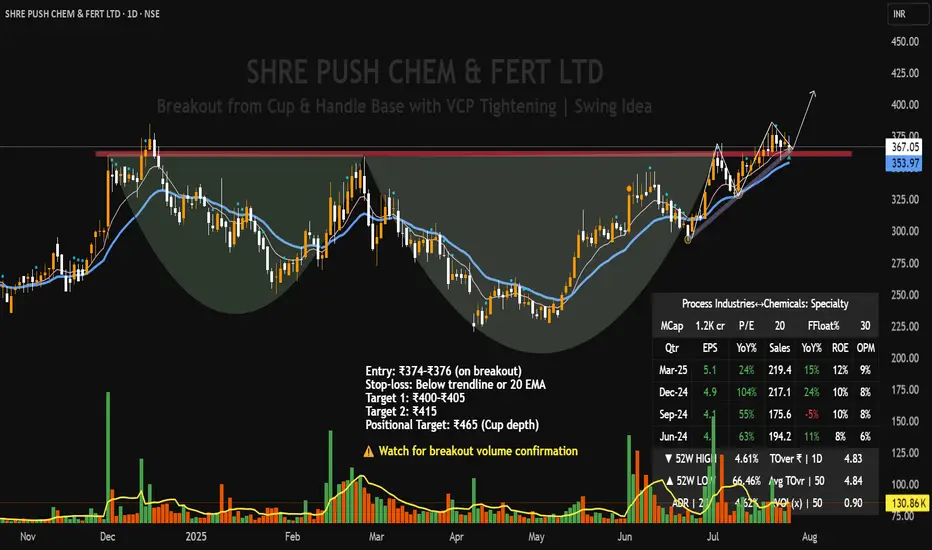
SHREE PUSHKAR CHEMICALS – Cup & Handle + VCP Breakout Setup |Technical Structure:
SHREE PUSHKAR CHEMICALS is forming a high-quality breakout setup on the daily chart, combining both a Cup & Handle pattern and a Volatility Contraction Pattern (VCP) within the handle zone.
Cup & Handle base formation extending from Nov 2023 to Jul 2025
Mini VCP within handle, showing tight range contraction, signaling institutional accumulation.
Ascending trendline support holding firm, along with the 9 EMA.
Volume contraction during each pullback
A confirmed breakout above ₹378 with volume can trigger a strong upside continuation.
Volume has steadily contracted across the handle, especially during pullbacks
Current price is tightening just under the breakout zone — ideal for a low-risk entry
A decisive breakout on volume >150K will act as a confirmation trigger.
Fundamentals
Market Cap : ₹1,200 Cr (Small-cap room for growth)
P/E Ratio: ~20x Reasonable for specialty chemicals
EPS Growth: 24% YoY Consistent profit improvement
Revenue Growth: 15% YoY Stable.
ROE: ~12% Healthy return metrics
Operating Margin: ~9% Sustainable profitability
This setup reflects strong technical discipline with a clean, low-risk structure. Ideal for swing traders looking for breakouts backed by volume and volatility contraction. Watch closely for confirmation with volume.
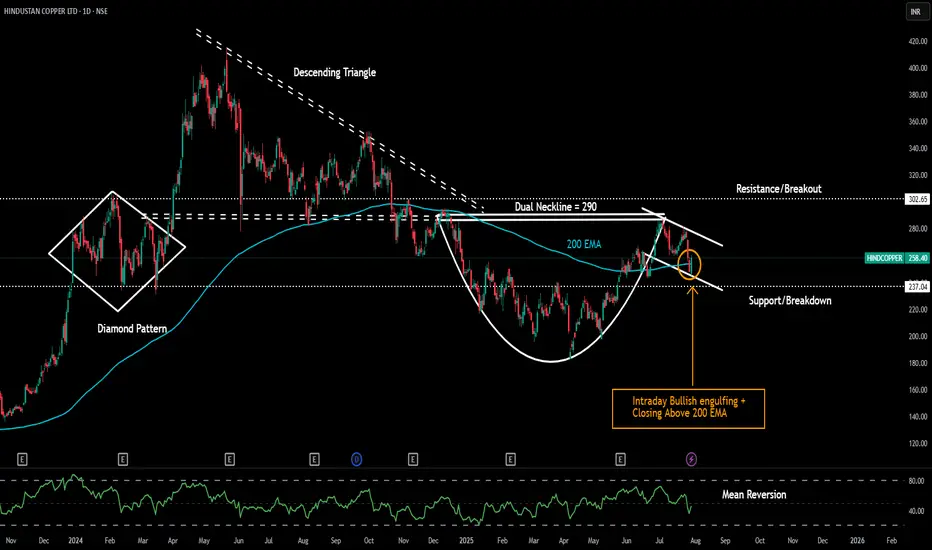
Hindustan Copper LtdDate 29.07.2025
Hindustan Copper Ltd
Timeframe : Day Chart
Technical Remarks :
1 Formed bullish engulfing on intraday closing basis
2 Closed above 200 exponential moving average
3 Took support from handle's bottom base
4 Dual neckline at 290 of descending triangle + cup & handle pattern
5 302 is another resistance after that high momentum journey
6 Keep todays low at 245 or 200 ema as strict stoploss on trailing basis
About The Company :
Main Products
1) Continous Cast Copper rod
2) Copper Cathode
3) Copper Concentrate
By-products
1)Copper Sulphate
2)Sulphuric acid
3) Anode Slime
4) Nickel hydroxide
5) Reverts
Plant Location
Taloja in Maharashtra
Jhagadia in Gujarat
Ghatsila in Jharkhand
Malankjand in Madhya Pradesh
Khetrinagar in Rajasthan
Revenue break up
Domestic sales - 43%
Export sales -57%
Exports sales - Product wise
Copper concentrates- 94%
Copper reverts- 2%
Anode slime - 4%
Valuations
Roce = 24%
Roe = 19%
Pe Ratio = 53
Book Value = 9X
Operating Profit Margins = 36%
Holding Pattern :
Promoter = 66.14%
DII = 3.71%
FII = 8.24%
Public = 21.90%
Regards,
Ankur