Marico: Post-Results Rally Tests Resistance Zone🔍 Technical Analysis
Marico Limited showcases an impressive wealth creation journey spanning two decades. The stock has delivered a super bullish rally from less than ₹12 to reaching ₹720 by 2024 - representing an extraordinary 60x growth over 20 years.
Since 2024, the ₹720-₹760 zone has acted as formidable resistance, tested multiple times without a decisive breakout. On November 14, 2025, the company announced its Q2 FY26 results. Responding to positive sales numbers showing 31% revenue growth, the stock shot up 2% and is now trading at ₹739.
Currently positioned near the upper end of the resistance zone, the stock is attempting another breakout. A decisive break above ₹760 with strong volume confirmation would signal the next major rally phase.
Entry Strategy: Wait for confirmed breakout above ₹760 with volume before initiating fresh positions.
Targets:
Target 1: ₹780
Target 2: ₹800
Target 3: ₹820
Risk Assessment:
No significant bullish expectations below the ₹720-₹760 resistance zone.
💰 Q2 FY26 Financial Highlights (vs Q1 FY26 & Q2 FY25)
Total Income: ₹3,482 Cr (↑ +7% QoQ from ₹3,259 Cr; ↑ +31% YoY from ₹2,664 Cr)
Total Expenses: ₹2,922 Cr (↑ +12% QoQ from ₹2,604 Cr; ↑ +36% YoY from ₹2,142 Cr)
Operating Profit: ₹560 Cr (↓ -15% QoQ from ₹655 Cr; ↑ +7% YoY from ₹522 Cr)
Profit Before Tax: ₹550 Cr (↓ -16% QoQ from ₹656 Cr; ↓ -0.4% YoY from ₹552 Cr)
Profit After Tax: ₹432 Cr (↓ -16% QoQ from ₹513 Cr; ↓ -0.2% YoY from ₹433 Cr)
Diluted EPS: ₹3.24 (↓ -17% QoQ from ₹3.89; ↓ -0.9% YoY from ₹3.27)
🧠 Fundamental Highlights
Marico delivered stellar Q2 FY26 performance with consolidated revenue soaring 31% YoY to ₹3,482 crore - the highest growth in 17 quarters. The company achieved underlying volume growth of 7% in India business and robust 20% constant currency growth in international markets, despite margin pressures from input cost inflation.
India business revenue jumped 35% YoY to ₹2,667 crore, aided by strategic price hikes in core portfolios. Digital-first premium personal care portfolio (Beardo, Just Herbs, Plix) crossed ₹1,000 crore annualized run rate, while foods portfolio grew 12% crossing ₹1,100 crore ARR with Saffola Oats retaining number one position.
Despite input cost pressures causing 810 bps gross margin contraction, the company increased brand investments with A&P spend rising 19% to ₹345 crore. EBITDA grew 7% to ₹560 crore with margins at 16.1%. Over 95% of portfolio gained or sustained market share while 75% strengthened penetration.
International business recorded 20% CCG with Bangladesh up 22%, MENA 27%, and newer countries/exports surging 53%. Rural demand outpaced urban 2x, with CEO Saugata Gupta confirming company is "on track for full-year aspirations" targeting revenue growth in thirties and 18%+ EBITDA margins in H2.
Avendus retained Buy rating with ₹832 target (raised from ₹810), while Motilal Oswal maintained Buy at ₹825 target. The stock gained 15% YTD outperforming Nifty FMCG's 10%. GST rate rationalization expected to benefit nearly 30% of portfolio, with strategic focus on digital acceleration (20% sales target by FY27) and sustainability initiatives.
✅ Conclusion
Marico's impressive 20-year journey from sub-₹12 to ₹720, backed by stellar Q2 FY26 showing highest revenue growth in 17 quarters at 31%, validates the FMCG leadership thesis despite flat PAT. Post-results 2% rally to ₹739 tests critical ₹720-₹760 resistance zone. Digital-first portfolio crossing ₹1,000 crore ARR, foods at ₹1,100 crore ARR, and 20% international CCG demonstrate diversified growth engines. Rural outpacing urban 2x and 95% portfolio gaining market share provide strong momentum. Breakout above ₹760 could trigger rally toward ₹820 levels with analyst targets at ₹825-₹832 supporting upside potential.
Disclaimer: This analysis is for educational purposes only. Please consult your financial advisor before making investment decisions. Stock markets are subject to risks.
Fundamental Analysis

GOLD (XAU/USD): 2 Crucial Orders Before the NFP Storm!📉 Technical Analysis (SMC - 2H)
Trend: Decline after a clear MSS/BOS.
Focus: Price is retracing to the Selling Zone (Premium) to fill the FVG.
⚔️ Detailed Trading Plan (R:R > 1:2)
1. Priority Strategy: SELL Limit (Trend Following)
Entry: 4,157.782 (FVG Peak - Supply Zone)
Stop Loss (SL): 4,206.895 (Safe SL above the nearest structural peak)
Take Profit 2 (TP2): 4,051.733 (Main structural target - Nearest bottom)
Objective: Participate in the ongoing price decline.
2. Counter-trend Strategy: BUY Limit (Technical Rebound)
Entry: 4,051.733 (Nearest structural bottom - Support)
Stop Loss (SL): 4,018.699 (SL below lower FVG)
Take Profit 2 (TP2): 4,126.333 (Rebound to the upper FVG bottom)
Objective: Capitalise on the technical rebound from strong support.
🚨 Basic Risk: This Week's Focus
Hawkish Fed: Officials like Schmid assert high inflation, unwilling to ease policy, maintaining high interest rates (Negative for Gold).
Major News: FOMC Minutes (Wednesday) and especially NFP (Thursday) will determine the short-term momentum of USD/Gold.
Risk Management: Gold will be highly volatile from Wednesday. Adhere to SL and manage capital under 2% per order.
#Gold #XAUUSD #Forex #TechnicalAnalysis #FVG #SmartMoney #Fed #NFP #TradingView

Muthoot Finance: Record 10% Surge After Stellar Q2🔍 Technical Analysis
Muthoot Finance Limited showcases one of the most impressive wealth creation stories spanning over a decade. The stock has delivered a super bullish rally from less than ₹100 to reaching ₹3,400 by November 13, 2025 - representing an extraordinary 34x growth in just over 10 years.
On the evening of November 13, 2025, the company announced its Q2 FY26 results which exceeded market expectations significantly. The market's immediate response was spectacular - the very next day on November 14, the stock shot up 10% and closed at ₹3,725, hitting an all-time high of ₹3,755 during intraday trading.
This powerful breakout from ₹3,400 to ₹3,725 demonstrates strong institutional and retail buying interest, fueled by robust fundamentals and exceptional financial performance. The stock has now entered uncharted territory with strong momentum.
Entry Strategy: Current levels offer opportunity with strong momentum. Consider accumulation on minor dips.
Targets:
Target 1: ₹3,800
Target 2: ₹3,900
Target 3: ₹4,000
Risk Assessment:
No expectations below ₹3,400 level, which now acts as strong support post-breakout.
💰 Q2 FY26 Financial Highlights (vs Q1 FY26 & Q2 FY25)
Total Income: ₹7,283 Cr (↑ +13% QoQ from ₹6,450 Cr; ↑ +48% YoY from ₹4,929 Cr)
Total Expenses: ₹2,571 Cr (↑ +9% QoQ from ₹2,355 Cr; ↑ +42% YoY from ₹1,807 Cr)
Operating Profit: ₹3,232 Cr (↑ +22% QoQ from ₹2,654 Cr; ↑ +80% YoY from ₹1,798 Cr)
Profit Before Tax: ₹3,244 Cr (↑ +22% QoQ from ₹2,654 Cr; ↑ +80% YoY from ₹1,802 Cr)
Profit After Tax: ₹2,412 Cr (↑ +22% QoQ from ₹1,974 Cr; ↑ +83% YoY from ₹1,321 Cr)
Diluted EPS: ₹60.29 (↑ +20% QoQ from ₹50.22; ↑ +90% YoY from ₹31.67)
🧠 Fundamental Highlights
Muthoot Finance delivered spectacular Q2 FY26 performance with standalone PAT surging 87% YoY to ₹2,345 crore and total income jumping 56.5% to ₹6,461 crore, driven by robust gold loan demand amid soaring gold prices. The company achieved highest-ever loan AUM of ₹1,47,673 crore (up 42% YoY) and gold loan AUM of ₹1,24,918 crore (up 45% YoY).
Net interest income (NII) rose impressive 58.5% YoY to ₹3,992 crore, driven by continued momentum in core gold loan segment and steady borrower activity. Net interest margin expanded significantly to 12.66% from 11.5% in Q2 FY25, indicating superior interest income growth and efficient capital deployment.
Gold loan AUM increased by ₹11,723 crore during Q2 FY26, registering 10% quarterly growth. Gold prices rallying over 40% in 2025 boosted customer confidence and loan demand. The board approved incremental fundraising up to ₹35,000 crore through NCDs and ₹500 crore equity infusion in subsidiary Muthoot Money Limited.
Asset quality showed remarkable improvement with Stage III loan assets declining to 2.25% from 4.3% YoY, while Stage II assets improved from ₹1,203 crore to ₹534 crore. Management upgraded AUM guidance to 30-35% growth, signaling high confidence in sustaining momentum through FY26.
Multiple brokerages turned bullish post-results: Nuvama raised target to ₹4,000 (from ₹2,993) maintaining Buy rating, Motilal Oswal increased target to ₹3,800 with Neutral rating, while Bernstein maintained Outperform at ₹3,400 citing 25% AUM CAGR potential over FY25-27E with 36% EPS CAGR and 24%+ ROE.
✅ Conclusion
Muthoot Finance's remarkable decade-long journey from sub-₹100 to ₹3,755 all-time high, backed by exceptional Q2 FY26 showing 83% PAT growth and 48% revenue surge, validates the gold loan leadership thesis. Post-results 10% surge to ₹3,725 demonstrates strong market confidence. Highest-ever AUM at ₹1,47,673 crore, NIM expansion to 12.66%, and asset quality improvement with 2.25% Stage III loans showcase operational excellence. Management's upgraded 30-35% AUM guidance and brokerage targets at ₹3,800-₹4,000 support bullish outlook. Gold price tailwinds and digital transformation initiatives provide sustained growth visibility toward ₹4,000 target.
Disclaimer: This analysis is for educational purposes only. Please consult your financial advisor before making investment decisions. Stock markets are subject to risks.

XAUUSD – UPDATE ON SCENARIO AFTER WEEKLY OPEN💛 XAUUSD – UPDATE ON SCENARIO AFTER WEEKLY OPEN 🎯
🌤 Overview
Hello everyone 💬
Gold prices at the start of the week are mostly unchanged, the price structure on H4 remains the same, so Lana continues to maintain the old trading strategy.
Currently, gold is weakly reacting around the medium-term resistance area, not strong enough to break through – but also no clear reversal signals.
💹 Technical Analysis
📉 Prices are moving within a narrow range between key liquidity zones:
Zone 4138–4140 is the near resistance, where the market has repeatedly reacted with declines.
Zone 4200 coincides with confluence fibo + descending trendline – strong resistance.
Zone 3990–3988 is important support, also a lower liquidity area, suitable for technical rebound Buy.
Market liquidity is weak, as shown by the pin bars and narrowing range.
🎯 Reference Trading Plan
💢 SELL (priority on correction rhythm)
4138–4140 | SL: 4146 | TP: 4120 → 4105 → 4089
4200 | SL: 4212 | TP: 4185 → 4160 → 4133
💖 BUY (strong support)
3990–3988 | SL: 3984 | TP: 4002 → 4032 → 4060
⚠️ Market Insight (Macro Insight)
Gold declines simultaneously with US stocks and Bitcoin, indicating a lack of liquidity across the market.
This behaviour is common during phases like:
Financial Crisis 2008
Early pandemic panic 2020
Investors are forced to sell even profitable assets to cover losses, causing gold – despite being a safe haven asset – to also decline. This reflects a strong increase in cash demand and widespread fear.
🌷 Conclusion with LanaM2
Gold is moving within a tight range and is heavily dependent on liquidity 💛
If you find this useful, please 💛 Like – 💬 Comment – 🔔 Follow LanaM2 for daily gold analysis ✨

Titan Company: Supply Zone Test After Strong Q2 🔍 Technical Analysis
Titan Company Limited showcases one of India's most spectacular wealth creation stories spanning over two decades. The stock has delivered a super bullish rally from less than ₹2 to reaching ₹3,886 in January 2024 - representing an extraordinary 1,900x+ growth over 20+ years.
The ₹3,886 level established in January 2024 has acted as formidable resistance multiple times. During the resistance phase, the stock corrected to ₹2,925 before regaining momentum. With strong Q2 FY26 performance providing fundamental support, the stock has climbed back to ₹3,877 and is now facing the resistance zone again.
The critical supply zone of ₹3,800-₹3,900 is being tested once more. A decisive breakout above this zone with strong volume confirmation would signal the next major leg of the rally. Currently trading near this resistance, the stock awaits the catalyst for a breakout.
Entry Strategy: Wait for confirmed breakout above ₹3,900 with strong volume before initiating positions.
Targets:
Target 1: ₹4,000
Target 2: ₹4,100
Target 3: ₹4,200
Risk Assessment:
Not expecting significant bullish moves below the ₹3,800-₹3,900 supply zone.
💰 Q2 FY26 Financial Highlights (vs Q1 FY26 & Q2 FY25)
Total Income: ₹18,725 Cr (↑ +13% QoQ from ₹16,523 Cr; ↑ +29% YoY from ₹14,534 Cr)
Total Expenses: ₹16,850 Cr (↑ +15% QoQ from ₹14,693 Cr; ↑ +27% YoY from ₹13,298 Cr)
Operating Profit: ₹1,875 Cr (↑ +2% QoQ from ₹1,830 Cr; ↑ +52% YoY from ₹1,236 Cr)
Profit Before Tax: ₹1,522 Cr (↑ +3% QoQ from ₹1,480 Cr; ↑ +61% YoY from ₹948 Cr)
Profit After Tax: ₹1,120 Cr (↑ +3% QoQ from ₹1,091 Cr; ↑ +59% YoY from ₹704 Cr)
Diluted EPS: ₹12.62 (↑ +3% QoQ from ₹12.29; ↑ +59% YoY from ₹7.93)
🧠 Fundamental Highlights
Titan Company delivered spectacular Q2 FY26 performance with consolidated PAT surging 59% YoY to ₹1,120 crore and revenue jumping 28.5% to ₹18,837 crore, driven by robust festive demand and strategic expansion. EBITDA rose 46.3% YoY to ₹1,987 crore with margins improving 209 bps to 12.1%.
Jewellery division remained the crown jewel with revenue growing 21% YoY to ₹14,092 crore. Domestic brands Tanishq, Mia, and Zoya grew 18% despite high gold prices, while CaratLane delivered exceptional 32% YoY growth. International jewellery business nearly doubled, surging 86% YoY to ₹561 crore, demonstrating successful global expansion.
The company expanded retail presence by adding 55 new stores in Q2, bringing total store count to 3,377 stores as of September 2025. Watches segment grew 12% with analogue watches up 17%, while emerging businesses including fragrances and bags surged 37% YoY.
Strategic initiatives included gold exchange campaigns, lower carat offerings, and retail expansion to combat high gold price challenges. Studded jewellery grew in mid-teens with double-digit like-for-like growth for both Tanishq and CaratLane, showing strength beyond store expansion.
Titan announced plans to acquire 67% stake in Dubai-based Damas Jewellery for international expansion across GCC countries. The company targets 40 new Tanishq store openings this year and maintains optimistic outlook for double-digit growth driven by festive momentum and premiumization strategy.
✅ Conclusion
Titan's remarkable 20+ year journey from sub-₹2 to ₹3,886, backed by exceptional Q2 FY26 showing 59% PAT growth and 29% revenue surge, validates the premium valuation thesis. The critical ₹3,800-₹3,900 supply zone breakout with volume confirmation could trigger rally toward ₹4,200 levels. Jewellery division's 21% growth despite high gold prices, CaratLane's 32% surge, and 86% international business growth demonstrate operational excellence. Damas acquisition and 3,377 store network provide strong growth visibility. Stock trading at ₹3,877 awaits breakout catalyst for next leg upward.
Disclaimer: This analysis is for educational purposes only. Please consult your financial advisor before making investment decisions. Stock markets are subject to risks.

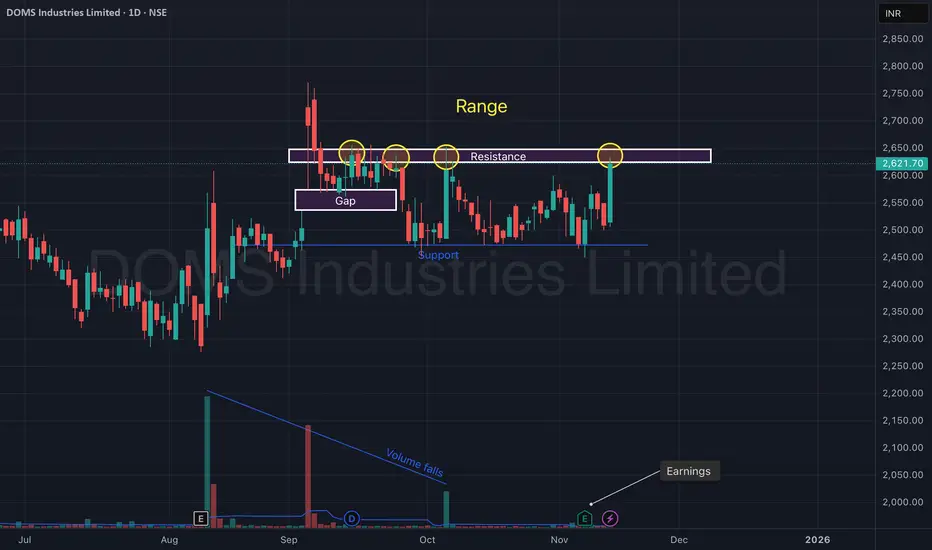
DOMS Industries Ltd – Range Breakout Attempt After Earnings.DOMS Industries continues to trade inside a well-defined range structure, with price repeatedly rejecting the ₹2,630–₹2,660 resistance zone. The recent strong bullish candle toward the upper boundary, combined with improving sentiment after earnings, signals a potential breakout attempt.
A clear gap zone retest around ₹2,520–₹2,550 provided a solid base. Support at ₹2,450 has held cleanly multiple times, validating the lower boundary of the range.
With volume slowly recovering from its multi-week decline and price pressing into resistance again, DOMS is approaching a decisive move.
🎯 Key Technical Levels
CMP: ₹2,621.70 (+4.49%)
Resistance Zone: ₹2,630 – ₹2,660 (Range high)
Gap Support: ₹2,520 – ₹2,550
Major Support: ₹2,450
Breakout Levels to Watch: Close above ₹2,660 with strong volume
📈 Technical View
Price is respecting a horizontal range for several weeks.
Repeated rejections highlighted by circles show strong supply near ₹2,650.
Gap zone acted as demand, helping price bounce back toward resistance.
Volume trend has been falling, suggesting participation has been subdued — a pickup in volume during any breakout would be critical.
Structure stays bullish above ₹2,520; bearish only if price closes below ₹2,450.
📊 Latest Earnings Snapshot
DOMS continues to deliver strong quarterly performance, supporting the technical setup:
Q2 FY26 (Sep 2025):
Net Profit: ~₹55.8 Cr
YoY Profit Growth: ~16%
Q1 FY26:
Revenue: ₹508.7 Cr (↑ ~26% YoY)
PAT: ~₹59.1 Cr (↑ ~8.8% YoY)
Consistent earnings growth strengthens the medium-term outlook and boosts confidence in a potential range breakout.
🧠 View
DOMS is back at its major resistance zone after a clean bounce from the gap support. A strong-volume breakout above ₹2,660 can trigger a momentum extension toward fresh highs, while ₹2,520 and ₹2,450 remain key demand zones to watch.
Nifty Opening Monday Upside - 26100 or Downside 25600 (approx.)Sir/Mam,
Tomorrow, Nifty will open in gap either up or down, if it opens UPSIDE that means we are not dependent on Global chaos or if it opens DOWNSIDE that means we are still in concern for Global or some internal tension, real test begins tomorrow. It does not mean that it will show momentum tomorrow itself it will create space to reverse for the coming expiry, for e.g. it wants to close above 26000 it will downfall tomorrow or vice versa.
The real panic for tomorrow is it does not open in FLAT that means 25850 - 25950, this range will be premium eating for both call and put buyers, better to stay out and observe for major single candle (70-80 points) for 15 mins chart pattern.
I hope you all have enjoyed weekends expect who have taken call or put on Friday (waiting to book profit) are nervous.
Let's hope for tomorrow for some big movements.
Asli maza tabh aayega jabh 250 - 300 points ka hulchul hoga :)

Automated AI Trading1. What is Automated AI Trading?
Automated AI trading is a system that uses machine-learning models to identify market patterns, predict price movements, and execute trades without human intervention. It operates on:
Data (price, volume, order flow, macro news, sentiment)
Logic (rules, model predictions, risk parameters)
Execution engines (API connectivity with brokers/exchanges)
Feedback loops (continuous learning and improvement)
Unlike traditional algo trading, which follows fixed mathematical rules (e.g., moving average crossover), AI-driven trading systems learn from data, recognize non-linear relationships, adapt to different market regimes, and evolve over time.
How AI differs from simple algos:
Traditional Algo Trading AI-Driven Trading
Follows fixed rules Learns from millions of data points
Struggles in changing markets Adapts to new volatility and structure
Limited to indicators Understands patterns, order flow, sentiment
No self-improvement Continuously improves via ML models
This shift is why the world’s biggest hedge funds—Citadel, Renaissance, Two Sigma—rely heavily on AI-powered trading.
2. Core Components of Automated AI Trading
**1. Data Collection Systems
AI learns from large amounts of data such as:
Historical price data (candles, ticks)
Volume profile and order-book data
News articles, macro releases
Social media sentiment
Company fundamentals
Global market correlations (Forex, commodities, indices)
The more accurate the data, the more powerful the AI.
2. Machine-Learning Models
AI trading uses models like:
Supervised learning → Predicting future prices from historical patterns
Unsupervised learning → Detecting hidden clusters and regimes
Reinforcement learning → Teaching models how to “reward” profitable actions
Deep learning → Working on complex and high-dimensional inputs (order flow, charts)
For example, a reinforcement learning model may learn to buy dips in a rising market and fade breakouts in a choppy market because it has “experienced” millions of simulated trades.
3. Strategy Engine
This links model predictions to market actions. It includes:
Entry signals
Exit signals
Stop-loss and target placement
Position sizing
Hedging decisions
Time-based rules
Even if the AI predicts a bullish move, the strategy engine decides:
how much capital to deploy,
how many trades to execute,
whether to trail SL or take partials,
whether to hedge via options.
4. Order Execution Engine
This is the part that actually executes trades through APIs. It handles:
Slippage control
Spread detection
Smart order routing
Latency optimization
High-frequency micro-decisions
Professional systems place orders in milliseconds to take advantage of liquidity pockets.
5. Feedback & Reinforcement System
AI trading bots track every action:
Did the model react correctly?
Was there unnecessary drawdown?
Did volatility shift?
Did correlations break?
These results feed back into the learning cycle, making the system smarter.
3. How Automated AI Trading Works Step-by-Step
Here’s a simplified version of how an AI system might trade Nifty or Bank Nifty:
Data Input:
The AI collects candlesticks, volume profile, India VIX, global cues (SGX/GIFT Nifty), news sentiment, and order-flow metrics.
Prediction:
The model predicts probabilities such as:
Market trending or ranging
Expected volatility
Direction bias (up/down/neutral)
Strength of buyers vs sellers
Signal Generation:
If the AI believes there is a 70% chance of an upside breakout based on VWAP deviation, delta imbalance, and global sentiment, it triggers a buy signal.
Risk Management:
The AI sets SL based on ATR or structure, adjusts position sizing based on volatility, and may hedge using options if needed.
Execution:
Orders are placed instantly at the best liquidity point, often slicing orders to reduce slippage.
Monitoring & Adaptation:
If volatility spikes due to news, the AI tightens stops or exits early.
Feedback Learning:
After the trade, the outcome is fed back into the model to refine future decisions.
This continuous loop is what makes AI trading so powerful.
4. Types of AI Trading Strategies
AI systems can run multiple strategy categories simultaneously:
1. Trend-Following AI Strategies
They identify trending markets using ML-based pattern recognition.
Useful for:
Indices
FX
Commodities
2. Mean Reversion AI Strategies
The AI detects overextensions or liquidity vacuum areas.
Excellent for:
Low-volatility equities
Options premium selling
3. High-Frequency Trading (HFT)
AI reads order-book microstructure and executes trades in milliseconds.
4. Arbitrage & Statistical Arbitrage
The system scans correlated assets (e.g., Nifty–BankNifty, Gold–USDINR) and identifies mispricing.
5. Option Trading AI Models
They use Greeks, IV crush patterns, gamma exposure, and flow data to:
Sell premium during low volatility
Buy options during breakout volatility expansions
Hedge positions dynamically
5. Advantages of Automated AI Trading
1. Eliminates Emotional Trading
Fear, greed, revenge trading, and FOMO are removed completely.
2. Faster Decision Making
AI can scan hundreds of markets in milliseconds.
3. High Accuracy in Pattern Recognition
It sees relationships invisible to human eyes.
4. Consistency
AI follows rules perfectly 24/7 with no fatigue.
5. Ability to Adapt
Markets shift from trending to ranging, from low to high volatility—AI systems detect these shifts early.
6. Better Risk Management
AI adjusts SL, TS, exposure, and hedging dynamically.
6. Limitations of Automated AI Trading
Despite its power, AI trading has practical challenges:
1. Overfitting Risk
Models may memorize old data and fail in live markets.
2. Regime Changes
AI trained on low-volatility years might struggle during black-swan events.
3. Technology Costs
High-quality data, GPUs, and low-latency infra are expensive.
4. Black-Box Nature
Many AI decisions lack transparency—difficult to interpret.
5. Dependency
Traders relying too much on bots may lose market intuition.
7. The Future of Automated AI Trading
The next era will combine:
AI + Market Structure
Using volume profile, liquidity zones, order-flow imbalance.
AI + Global Macro Intelligence
Models that read FOMC statements, inflation prints, and currency flows.
AI + Voice/Chat Interfaces
Traders will speak: “AI, manage my Nifty long, hedge with a put spread,” and the system will execute.
AI-Driven Portfolio Automation
Fully autonomous wealth-management engines.
We are entering a world where AI will not assist traders—it will act as a complete trading partner.
Conclusion
Automated AI trading is transforming financial markets by combining vast data processing, machine learning, and rule-based automation. It removes human emotion, enhances precision, adapts to market shifts, and executes strategies with high speed. While it comes with limitations like overfitting and model opacity, the benefits far outweigh the challenges. Whether you trade indices, equities, commodities, or options, AI will play a central role in future trading success.

Smart Options Strategies1. What Makes an Options Strategy “Smart”?
A strategy becomes smart when it has:
✔ Defined Risk
You must always know the maximum loss before entering a trade. Smart strategies use spreads, hedges, and risk caps.
✔ High Probability of Profit
Instead of chasing home runs, smart traders target high-probability setups using delta, implied volatility, and data-backed levels.
✔ Edge From Volatility
Most retail traders ignore implied volatility (IV). Smart traders sell options when IV is high, and buy options when IV is low.
✔ Time Decay Advantage
Smart strategies often sell premium so theta works in your favor.
✔ Directional but Hedged
Directional trades must include some level of risk protection.
✔ Market Structure Alignment
No strategy works alone; it must match:
Trend (up, down, sideways)
Volatility environment
Support/Resistance
Momentum levels
2. Smart Strategies for Trending Markets
A. Vertical Spreads (Bull Call / Bear Put)
Vertical spreads are smart because they lower the cost, define risk, and give directional exposure with far less stress than naked options.
1. Bull Call Spread (Uptrend Strategy)
Buy ATM call
Sell OTM call
Limited risk & limited reward
Best used in steady uptrends
Why smart?: Reduces premium cost by 40–60% and controls emotions.
2. Bear Put Spread (Downtrend Strategy)
Buy ATM put
Sell OTM put
Works in controlled downtrends
Why smart?: Cheaper than naked puts and gives clear risk-reward structure.
B. Covered Call
If you own stocks and expect slow upward movement, sell OTM calls and earn a consistent income.
Why smart?:
Generates passive premium
Reduces cost basis
Safer than naked options
Ideal for long-term investors who want side income.
C. Cash-Secured Put
Selling a put at a support level
You collect premium
If assigned, you buy stock at a discount
Why smart?:
High-probability income strategy
Great for undervalued stocks
Safer than buying at market price
3. Smart Strategies for Sideways Markets
Most markets are range-bound for 60–70% of the time. Professional traders make money even in flat markets using credit spreads and range strategies.
A. Iron Condor
This is one of the smartest non-directional strategies.
Structure:
Sell OTM call spread
Sell OTM put spread
Collect premium from both sides
Your view: Market stays inside a range.
Why smart?:
High probability (70%–85%)
Neutral strategy
Benefits from theta decay
Risk is defined
Smart traders use Iron Condors in:
Low-volatility phases
Consolidation zones
Before stable events (not before major announcements)
B. Iron Butterfly
A more aggressive version of condor.
Structure:
Sell ATM straddle (call + put)
Hedge with OTM wings
Why smart?:
High premium
Tight risk box
Ideal for strong consolidations
4. Smart Strategies for High-Volatility Markets
During events like Fed meetings, India budget, RBI policy, earnings, or global chaos, IV increases sharply. Smart traders sell expensive options to exploit this.
A. Straddle Sell (Advanced)
Sell ATM call & ATM put
Best used:
Only by skilled traders during extremely stable markets or right after volatility spikes.
Why smart:
Maximum theta advantage
Profits from volatility crush
But needs:
Strict risk management
Adjustment rules
Exit discipline
B. Strangle Sell
Sell OTM call
Sell OTM put
Less risky than a straddle. Suitable when you expect market to stay within a broader range.
Why smart:
Wider profit zone
Higher probability
Uses IV crush effectively
5. Smart Strategies for Low-IV Markets
When implied volatility is very low, option premiums are cheap. Smart traders buy options or debit spreads.
A. Long Straddle
Buy ATM call
Buy ATM put
Used when you expect a big move but uncertain direction.
B. Long Strangle
Buy OTM call
Buy OTM put
Lower cost than a straddle.
Why smart?:
Best for breakout traders
Profits from volatility expansion
6. Smart Adjustments (The Secret Behind Profitable Option Traders)
Strategies alone are not smart—adjustments make them powerful.
✔ Rolling
Move options to a later expiry or better strike if wrong direction.
✔ Converting spreads
Convert naked options → spreads
Convert condor → butterfly
Convert straddle → strangle
✔ Locking gains
When one side of the trade is fully profitable, close it and keep the other side running.
✔ Hedging with futures
Smart traders hedge using Nifty/BankNifty futures when market moves aggressively.
7. Smart Strategy Selection Based on Market Conditions
Market Condition Smart Strategy
Strong Uptrend Bull Call Spread · Covered Calls · Cash Puts
Strong Downtrend Bear Put Spread · Ratio Put Spread
Sideways Market Iron Condor · Calendar Spread · Short Strangle
Volatile Market Straddle/Strangle Sell · Iron Fly · Debit Spreads
Breakouts Long Straddle · Strangle · Vertical Spreads
This is the rulebook professional traders follow.
8. Smart Greeks-Based Trading
Smart traders analyze the Greeks before executing a trade:
✔ Delta – Directional risk
Use delta to position trades according to trend.
✔ Theta – Time decay
Sell premium when theta is in your favor.
✔ Vega – Volatility sensitivity
Sell options when IV is high
Buy options when IV is low
✔ Gamma – Sensitivity to big moves
High gamma helps in long straddle/strangle during breakout phases.
9. Smart Position Sizing
Even the best strategies fail without proper money management.
Smart rules:
Risk only 1–2% of capital per trade
Avoid naked options unless experienced
Prefer spreads for controlled risk
Avoid overtrading during volatile news days
10. Smart Psychology in Options Trading
Your strategy is only 30% of success; psychology is 70%.
Smart traders:
Avoid emotional entries
Don’t chase runaway options
Close losing trades early
Avoid revenge trades
Stick to predefined rules
They understand that options trading is not about prediction—it’s about probability + discipline.
Conclusion
Smart options strategies are structured, risk-defined, volatility-aware tactics used by professional traders to maximize profits while minimizing risk. Whether you are trading trending markets, sideways markets, breakout phases, or volatile conditions, selecting the right strategy gives you a huge edge over random directional betting.
By combining:
Proper strategy selection
Volatility analysis
Greeks
Market structure
Adjustments
Psychology
you transform from a guess-based trader to a smart, systematic options trader.

Macro Events and Their Impact on the Indian Market1. Global Monetary Policy and Interest Rates
One of the strongest macro forces is the US Federal Reserve’s policy, followed by decisions from the RBI. When global central banks hike interest rates, especially the Fed, foreign investors tend to move their capital towards the US because higher yields become attractive. This leads to:
FPI outflows from Indian equities and bonds
Rupee depreciation
Volatility spikes in Nifty and Bank Nifty
RBI intervention in forex markets
Conversely, when global rates fall or the Fed hints at dovishness, money flows into emerging markets, creating rallies. Indian stocks, particularly financials and large caps, benefit the most.
2. Inflation Trends and Price Stability
Inflation is a key macro indicator. Rising inflation reduces purchasing power, increases raw material costs, and compresses corporate margins. When inflation spikes:
RBI increases interest rates
Borrowing costs rise
Economic growth slows
Sectors like banks, autos, real estate face pressure
Moderate and stable inflation supports steady growth in GDP and corporate earnings. India’s CPI data and the US inflation numbers are therefore watched closely by traders, as they shape interest rate expectations.
3. Fiscal Policies: Budget, Taxation, Government Spending
Every February, the Union Budget is one of the most powerful macro events influencing Indian markets. Government spending on infrastructure, agriculture, manufacturing, and welfare programs affects sectoral performance:
Higher capex → bullish for construction, cement, metals, railways, infra
Lower corporate tax → boosts earnings → Nifty re-rating
Changes in import/export duties → impact autos, electronics, oil & gas
Fiscal deficit numbers also matter. A high deficit worries investors because it increases borrowing and inflation risk. A lower-than-expected deficit boosts bond prices and strengthens the rupee.
4. Global Commodity Prices (Crude Oil, Gold, Metals)
India is a major importer of crude oil, so oil prices significantly impact inflation, the rupee, and fiscal deficit.
Rising crude → higher fuel prices → inflation → rate hikes → market pressure
Falling crude → lower inflation → stronger rupee → corporate margin expansion
Metal prices (aluminium, copper, steel) affect manufacturing and infra companies, while gold movements influence currencies and interest rate dynamics.
5. Geopolitical Events and Global Tensions
Geopolitical events include wars, trade tensions, sanctions, border conflicts, and diplomatic breakdowns. These events increase uncertainty, which is the enemy of financial stability. Impacts include:
Supply chain disruptions
Rising commodity prices
Risk-off sentiment globally
FPI selling in emerging markets
Recent examples such as US-China tensions, Russia-Ukraine war, and Middle East conflicts all created volatility in Indian markets.
6. Currency Movements and Rupee Dynamics
The rupee’s performance is a barometer of macro health. A depreciating rupee:
Increases import costs
Worsens inflation
Reduces foreign investor confidence
However, exporters like IT, pharma, textiles, and chemicals benefit from a weaker rupee.
A stronger rupee generally signals macro strength, lower inflation, and high capital inflows.
7. GDP Growth Trends and Economic Cycles
GDP growth is the ultimate measure of economic performance. Strong GDP growth signals a healthy economy and supports:
Higher corporate profits
Strong labor market
Rising consumption
Rising credit demand
Weak GDP prints, on the other hand, lead to:
Lower earnings estimates
Reduced valuations
Bearish market sentiment
Traders look at quarterly GDP numbers, industrial production, and PMI data to gauge the direction of the market.
8. FPI/FII and DII Flow Trends
Foreign Institutional Investors (FIIs/FPI) and Domestic Institutional Investors (DIIs) play a major role in the Indian market. FIIs react heavily to global macro events, while DIIs respond to local economic trends.
FPI buying → Nifty surges
FPI selling → sharp corrections, rupee weakens
DII buying (mutual funds, LIC) → stabilizes markets during global volatility
Tracking FPI/DII trends is crucial for predicting short-term market direction.
9. Corporate Earnings Season
Though company-specific, earnings seasons reflect the macro environment. Strong earnings indicate:
Good demand
Better pricing power
Strong credit cycle
Weak earnings reflect macro issues like inflation, currency depreciation, or weak consumer spending.
Market-wide earnings downgrades often precede significant corrections.
10. Weather Patterns, Monsoons, and Climate Risks
India is heavily dependent on the monsoon. A strong monsoon leads to:
Higher rural consumption
Better crop output
Lower food inflation
Higher GDP growth
A weak monsoon disrupts agriculture, increases food prices, and leads to inflationary pressure, forcing RBI to tighten policy. Climate change events like heatwaves or floods also impact agriculture and supply chains.
11. Political Stability and Policy Reforms
Political stability is one of India’s biggest strengths. Stable governments encourage:
Long-term reforms
Foreign investments
Stronger capital markets
Reforms such as GST, PLI schemes, disinvestment, labor law changes, and digitalization have attracted global capital. Elections are major macro events, often creating pre-result volatility.
12. Banking Sector Health and Credit Cycle
The health of the banking sector influences the overall economic cycle. Low NPAs, strong credit growth, and stable interest rates support expansion. Banking crises—like those in certain global banks—can create panic even in Indian markets.
13. Global Market Movements (US, China, Europe)
Indian markets take cues from global indices:
S&P 500, Nasdaq → tech and IT stocks
Hang Seng, Nikkei, DAX → emerging market sentiment
Risk-on/risk-off cycles decide whether money flows to India or away from it.
The Indian market typically reacts immediately to overnight US market movements.
Conclusion
Macro events are the heartbeat of the Indian financial market. They influence liquidity, valuations, risk sentiment, and corporate earnings. From global interest rates to fiscal policy, from geopolitical tensions to domestic inflation, each macro factor leaves a distinct footprint on sectors, indices, and investor behavior.
A trader who understands the macro landscape gains a tremendous edge: the ability to anticipate market moves rather than just react to them. With India becoming a global economic powerhouse, macro analysis is no longer optional—it is a necessity for successful long-term investing and profitable short-term trading.

#TI can be Game changer tilaknagar industries can be game changer in liquor sector after Radico
price range 435 to 527
above this big blast these are support and ressistance

Part 2 Ride The Big MovesMoneyness of Options
Options are classified as:
In the Money (ITM) – already profitable if exercised
At the Money (ATM) – strike close to current price
Out of the Money (OTM) – not profitable yet
Traders choose strikes based on strategy, risk appetite, and market view.
Greeks: The DNA of Options
Options behave differently based on market conditions. The Greeks measure these sensitivities:
Delta – how much the option price changes with underlying movement
Gamma – how much delta changes
Theta – time decay
Vega – sensitivity to volatility
Rho – sensitivity to interest rates
Understanding Greeks helps traders manage risk and predict option behavior.

GOLD: The Bigger Picture is Finally Getting Clearer !Gold finally showed some clarity after weeks of structure, and now the bigger picture is lining up perfectly across the daily and multi-year weekly charts. The rejection from the 4250–4350 zone triggered the first meaningful retracement after a parabolic rally, and price is now hovering right above the 4030–4060 daily support the only level holding back a much deeper corrective cycle. This entire region is critical because it marks the last breakout base, the liquidity origin, and the midpoint of the 3600-4300 vertical leg. As long as this shelf holds, gold will continue to move in a compressed range, but once a clean daily close breaks below it, the market naturally opens up a fast move toward the 3500–3550 target zone. All confluences measured move, channel midline, point to this same cluster, making it a high-confidence retracement level inside a long-term bullish trend.
On the upside, the structure is very clean. Only a sustained breakout above 4300–4350 invalidates the entire correction and flips the bias back to full-bull mode, where gold can easily run toward 4600–4800 as the next discovery leg. Anything below that zone still falls under the extended correction category, not a bullish continuation. This is why the invalidation level is drawn exactly where it is to protect from guessing the reversal too early.
On the weekly chart, gold has slipped back inside the multi-year ascending channel after briefly wicking above it. That wick was nothing but a classic blow-off extension followed by a reversion to mean. Now price is sitting comfortably inside the same long-term structure . The upper red band remains the multi-year resistance, the green midline is the structural backbone of the trend, and the purple lower band is the deep cycle accumulation zone. As long as gold stays inside this channel, the macro remains strongly bullish and corrections within this structure are normal and healthy. The mid-channel region around 3500 also aligns perfectly with the expected daily correction, which adds even more confirmation that this retracement is simply part of the long-term trend and not a trend reversal.
Commodity index on both daily and weekly frames is cooling off from extreme levels, which supports a deeper pullback rather than an immediate rally. No new bullish divergence has appeared yet, meaning momentum still favors a downside sweep before any major upside continuation. Combine that with the lack of fresh macro drivers and a stabilization in rate-cut expectations, this cooling phase was overdue.
In simple below daily support, gold continues the correction toward 3500-3650 above 4350, the correction thesis dies and the bull trend resumes aggressively. Until then, this is a textbook retracement inside a long-term uptrend nothing broken, nothing unexpected, just a parabolic market taking a breath. Trade safe !

LiamTrading – XAUUSD H1 | Two scenarios for the new weekLiamTrading – XAUUSD H1 | Two scenarios for the new week: wait for reactions at 4100 & Fibonacci zone – prioritise bullish trades when the market recovers
Gold is completing a technical rebound after a sharp drop, and H1 is showing two clear scenarios for the new week. The medium-term trend remains a corrective decline, but on H1, the price is in a rebound phase, so bullish trades will be prioritised – as long as the lower liquidity zones are maintained.
The key this week lies at 4100, where FVG, Fibonacci, and liquidity converge – this is the decisive point to see if gold will bounce back or continue to decline deeply.
🔍 Technical Analysis (Fibonacci • Trendline • Liquidity • Volume Zone)
Fibonacci H1: The price may rebound to Fib 0.5 (~4140–4150) – a zone with high liquidity & likely to show a bearish reaction.
Fib 0.382 (~4120–4130) is currently the first short-term resistance.
Price Structure: The medium-term downtrend is still present, but H1 is forming a rebound wave → prioritise buying when the price pulls back at the support zone.
The descending trendline is still controlling the market. If it breaks the trendline + holds above 4130–4150 → the uptrend is confirmed stronger.
Important liquidity zones:
4100: liquidity confluence + previous bullish resistance → strong reaction zone.
4085 and 4060: liquidity bottoms – if breached, it will trigger a deep decline scenario.
4032: FVG + Fibonacci bottom – the "break or hold" zone for buyers.
Key resistance this week: 4161 – 4187 – 4138 – 4111
📈 TRADING SCENARIOS FOR THE NEW WEEK
Scenario 1 – Bullish trade (priority)
Logic: Gold is rebounding; if it holds 4100 and pulls back strongly → target is the upper Fibonacci zone.
Entry: 4100–4111
SL: 4090
TP: 4138 → 4161 → 4187
Suggestion: Wait for strong signals like pin bar or engulfing H1 to confirm the rebound bottom.
Scenario 2 – Bearish trade (when the market fails to hold the bottom)
Logic: If gold breaks the H1 bottom and retests 4100 without holding → the medium-term downtrend continues to activate.
Entry: 4100–4108 (retest after break)
SL: 4120
TP: 4085 → 4060 → 4032
Suggestion: Only enter when H1 closes below 4100.
🌍 Macro Analysis – Fed causes market noise
According to the latest data from CME Watch:
54.1% chance the Fed maintains rates at 375–400 bps
45.9% chance the Fed cuts rates
The ratio is almost balanced → the market is very indecisive, creating unpredictable volatility ahead of the 10/12 meeting.
In this environment, gold often reacts strongly to unexpected news, so prioritise trading at liquidity zones – wait for clear confirmation.
⚠️ Invalidation Conditions
Price closes below 4060 → fully prioritise bearish trades.
Price closes above 4161 → strong bullish trade activated, discard all sell setups.
What scenario are you preparing for the new week?
Please comment & hit Follow on LiamTrading channel to receive the earliest analysis every day!

Classic Case of Priced In Optimism & Intraday Liquidity TrapThe market’s behaviour on the Bihar election result day followed a pattern that repeats itself almost every time political outcomes are broadly expected. By the time counting began in the morning, the market had already made its real move. The rally from the 25,350 zone to the 26,000 area in the previous sessions had priced in the possibility of political continuity. Exit polls and early sentiment didn’t leave much room for a fresh surprise, and because of that, the result day itself turned out to be a range-bound session instead of a trend day.
The 5-minute chart shows exactly how the trap formed. The index opened firm, pushed towards 26,000, and immediately met selling pressure. Traders who entered on the assumption that a clear political mandate would trigger a one-way rally were trapped right at the open. Through the middle of the session, the market drifted back into a narrow band, forming lower highs and repeatedly slipping toward the 25,750 support. This is typical behaviour when a major event gets fully discounted before the actual announcement. Without fresh triggers, the market simply rotated around intraday liquidity.
Global cues didn’t help either. Asian markets were soft, risk sentiment was weak, and domestic buying lacked strength. Even with a favourable political outcome, the backdrop wasn’t strong enough to push the index beyond the 26,000 supply zone. This created a clean intraday squeeze: optimism at the open, hesitation through the day, and then a sharp reversal in the last half-hour.
The late spike—more than 100 points in a single 5-minute candle around 3 PM—was largely mechanical. It had the signature of short-covering, expiry-related adjustment, and institutional book-closing rather than genuine trend buying. Moves like this usually appear when intraday shorts square off and larger players rebalance their positions into the close.
The higher timeframe tells the same story. On the 1-hour chart, the index had already hit resistance earlier, and each attempt near 26,000 was met with supply. The trend remains intact on the broader scale, but momentum clearly slowed down once the market realised that the result did not introduce any new variable—it simply confirmed what was already anticipated.
Overall, this session was a textbook example of how markets behave when the news is entirely expected. The initial reaction pulls in emotional traders, the mid-day choppiness shakes out both sides, and the final burst is more about positioning than sentiment. Until Nifty closes decisively above 26,050 on strong breadth, the index is likely to stay in a sideways-to-cautious zone with support near 25,750.
In short, the market didn’t rally because there was nothing new to rally about. The optimism was already embedded in the previous move, and the result day turned into a classic liquidity trap rather than a directional breakout.

GRMOVER Price ActionGRM Overseas Ltd is trading around ₹366 as of September 9, 2025, following a mild intraday uptrend after opening at ₹362 and reaching a high of ₹366.95. The market capitalization is close to ₹2,200 crore, with the share price well supported in the upper range of its yearly performance, having moved from a 52-week low of ₹175.90 to a high of ₹397.65.
The company’s core business in branded and non-branded basmati rice exports and domestic sales has delivered robust annual revenues of over ₹1,300 crore. Profitability metrics remain stable, with a price-to-earnings ratio of 35.5, slightly higher than the sector average, reflecting market optimism for growth. Operational leverage is evident from the healthy asset turnover ratio above 2, while debt levels remain negligible, supporting a strong balance sheet.
Shareholding patterns show promoter ownership at 70.8%, foreign institution participation rising over recent quarters, and retail holding close to 27%. Trading volumes and delivery percentages indicate active investor interest. Despite somewhat muted profit growth, GRM Overseas continues to invest in capacity and product expansion, positioning itself for steady sectoral growth. Technical indicators suggest support near current levels; however, volatility remains possible in the event of broader market swings.

BUY TODAY SELL TOMORROW for 5%DON’T HAVE TIME TO MANAGE YOUR TRADES?
- Take BTST trades at 3:25 pm every day
- Try to exit by taking 4-7% profit of each trade
- SL can also be maintained as closing below the low of the breakout candle
Now, why do I prefer BTST over swing trades? The primary reason is that I have observed that 90% of the stocks give most of the movement in just 1-2 days and the rest of the time they either consolidate or fall
Cup & Handle Breakout in IFBAGRO
BUY TODAY SELL TOMORROW for 5%

XAU/USD – Gold Slightly Adjusts, Monitoring Pullback to Support Hook: XAU/USD – Gold Slightly Adjusts, Monitoring Pullback to Support 4,151 USD
Body: 📊 Market Structure
After the Break of Structure (BoS) at the 4,208 USD region, gold confirms the continuation of the upward trend and is forming a technical adjustment.
The price has touched the Resistance Zone 4,208 – 4,237 USD and is currently adjusting as expected, heading towards the Support Zone 4,151 USD – which previously created an impulsive move.
Below Support 4,151, there is a strong OB at 4,104 USD.
As long as the price does not break deeply below 4,104 USD, the bullish structure remains intact.
💎 Key Technical Zones
• Resistance Zone: 4,208 – 4,237 USD → supply area + where a downward reaction occurs
• Support Zone: 4,151 USD → area awaiting upward reaction
• Strong OB + Support: 4,104 – 4,110 USD → base of the upward structure
• Liquidity Zone (Target): 4,260+ USD → next wave expansion area
🎯 Trading Plan
1️⃣ BUY Setup – Trend-following priority
If the price adjusts correctly to discount areas:
• Entry 1: 4,151 USD
• Entry 2: 4,104 USD (best area – confluence OB)
SL: below 4,090 USD
TP1: 4,208
TP2: 4,237
TP3: 4,260
→ Main strategy: wait for pullback → re-enter the upward wave → follow the strong trend.
2️⃣ SELL Scalp – Reaction at Resistance (counter-trend)
If the price retests the 4,208 – 4,237 area and creates a clear rejection:
Entry: 4,218 – 4,230
SL: 4,245
TP1: 4,180
TP2: 4,151
→ Setup only for flexible traders, short trades, no holding positions.
🧠 Vincent’s View
The current structure is very precise:
Impulsive Move → Short-term Distribution → Pullback to Support → Continue upward wave.
The 4,151 USD area is the focal point to observe.
The 4,104 USD area is the best BUY area if the market wants to hunt deeper liquidity.
As long as the price does not break 4,104 USD, buyers still hold the entire advantage.

LiamTrading –XAUUSD H1|Gold approaches trendline – ready to...LiamTrading –XAUUSD H1|Gold approaches trendline – ready to explode, waiting for a breakout to choose direction!
Gold is moving close to the lower trendline of the upward channel, indicating an accumulation state – waiting to choose direction. The price hasn't broken the 4210 resistance zone, but neither has it breached the trendline, so today's fluctuation will revolve around this structure.
If the buying force is strong enough and closes the H1 candle above 4210, the upward trend will be reactivated with a broader target. Conversely, if the price breaks below the trendline, gold may decline to the POC area according to Volume Profile/Fibonacci around 4126–4130, where signals to buy again according to the main trend will be prioritized.
🔍 Technical Analysis (Volume Profile • Trendline • S/R • Fibonacci)
H1 Upward Channel: Price is testing the trendline for the second time → a pullback bounce may appear if the selling force is weak.
Strong Resistance:
4210: hard resistance – needs to break to confirm the rise.
4230: extended area, coinciding with the channel peak – likely to have a strong reaction.
Important Support:
4174: intermediate support; breaking this level will trigger a short-term decline.
4126–4130: POC + large liquidity according to Volume Profile – the best buying area if a deep correction occurs.
Market Sign: Weak candle force in the 4180–4190 area indicates gold is waiting for USD information before breaking direction.
📈 Daily Trading Scenarios
Scenario 1 – Buy according to trend (priority)
Entry: 4126–4128 (POC + Volume Profile support)
SL: 4120
TP: 4140 → 4156 → 4180 → 4198
Suggestion: Wait for a rejection candle or reversal pattern at 412x.
Scenario 2 – Sell when breaking trendline (counter-trend)
Condition: H1 breaks below trendline + failed retest
Entry: 4174–4176
SL: 4182
TP: 4150 → 4135 → 4110
Note: Only sell when there is a confirmation candle; this is a short-term surfing order.
Scenario 3 – Buy when breaking and holding above 4210 (Break & Retest)
Entry: 4212–4216
SL: 4202
TP: 4230 → 4260 → 4285
🌍 Macro Analysis – USD under pressure from new tariff plans
President Trump is preparing to cut tariffs on goods from many Latin American countries (beef, bananas, coffee…).
Objective: reduce domestic food prices, lower import costs.
This could weaken the USD when officially announced → gold benefits in the medium term.
⚠️ Invalidation Condition
H1 closes below 4120 → losing upward structure, may slide to 4090–4100.
H1 closes above 4230 → cancel all sell orders, prioritize buying according to breakout.
Which price area are you observing?
Please comment below & hit Follow on LiamTrading channel to receive the earliest analysis every day!

Will gold continue to rise? XAUUSD forecast 14/10/251. Fundamental Analysis
Yesterday, gold dropped ~100 points from 4248 → 4145 due to information that after the US Government reopened, some important economic data (CPI, employment) might not be released on schedule.
This has lowered the expectation of a December rate cut to <50%, causing a technical adjustment.
➡ The major trend is still upward – today, prioritise BUY.
Key level: 4208–4213
Above 421x: adjustment ends → prioritise BUY.
Below 421x: the price may retest the lower BUY zone.
2. BUY Zone (priority) – SL 10 points, TP 10–20 points (RR 1:1 → 1:2)
zone 1 : 4140–4143
Zone 2: 4134–4130
zone 3: 4120–4112
3. SELL Reaction Zone – SL 10 points, TP 10 points (RR 1:1)
zone 1: 4245–4248
zone 2: 4280–4285
zone 3: 4300–4305
4. Notes
Today is Friday → trade safely, quick TP.
Do not chase orders, only enter when the price hits the zone.

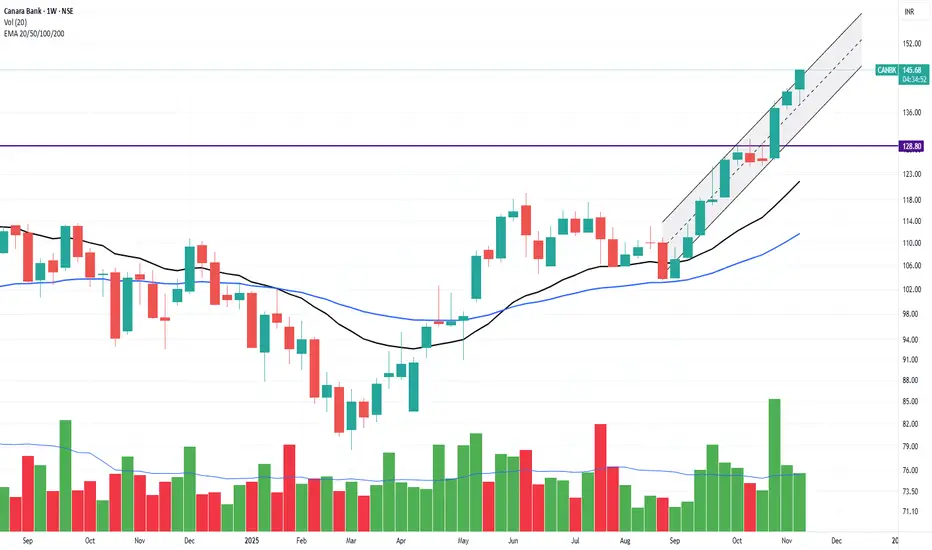
PSU BANK AVAILABLE AT FAIR VALUATION NOW: BREAKOUT IN CANARABANkAmong Indian PSU banks, Canara Bank currently stands out as available at a fair valuation, with a low price-to-earnings (P/E) ratio of around 6.6 and a price-to-book (P/B) value near 1.1, which makes it attractive compared to peers. Bank of India and Union Bank of India also screen as fairly valued, both hovering around P/E ratios of 6.3–6.9 and similar P/B multiples.
Notable PSU Banks for Fair Valuation
* Canara Bank: P/E 6.6, P/B 1.1, with strong return on equity (ROE) and return on assets (ROA), making it a value pick in current market conditions.
* Bank of India: P/E 6.9, P/B close to 1, and intrinsic value estimates within reasonable bounds for current prices.
* Union Bank of India: P/E 6.3, P/B 1.1, delivering consistent profit growth and maintaining attractive valuations.
Market Sentiment
With PSU banks reporting strong profit growth in recent quarters, the sector overall offers valuation support, but bottom-up stock selection remains vital. Canara Bank and Bank of India are currently among the most fairly valued, making them stand out for investors seeking value in the PSU banking segment.
For a long-term perspective, review each bank's NPA ratios, consistent profitability, and any recent regulatory changes that could impact valuations.
XAUUSD – H1: PRIORITISE BUY ACCORDING TO PRICE CHANNEL...💛 XAUUSD – H1: PRIORITISE BUY ACCORDING TO PRICE CHANNEL, WATCH FOR ADJUSTMENT MOVES 🎯
🌤 Overview
Gold is maintaining its upward channel on H1 → main mindset: hold Buy longer than Sell.
Asian–European sessions present multiple liquidity clusters suitable for scalping and optimising entry points.
Fundamentals: DXY retreats around 99.15, market reduces expectations of Fed rate cut in December; Fed's Collins hints rates may remain unchanged longer → gold's range may experience short-term fluctuations.
💹 Technical (ICT view)
H1 upward channel maintains a structure of higher lows; the lower trendline is the main support.
4163–4165: confluence of trendline + liquidity (ideal Buy entry point).
4130–4133: deeper support; below that is the 4100–4080 zone (medium-term support; around Fibo ext 1.618 ≈ 4114 and 2.618 ≈ 4054).
Nearby resistance: 4215–4225; a decisive break opens up to 4260.
🎯 Trading Plan Reference
Buy #1 (priority): 4163–4165 │ SL 4157 │ TP 4180 → 4195 → 4220 → 4260
Buy #2 (deeper support): 4130–4133 │ SL 4125 │ TP 4150 → 4175 → 4190 → 4220
Sell (only with confirmation):
Scenario A: M15/M30 gives strong rejection signal at 4215–4225 → SL 4230 │ TP 4200 → 4188 → 4165.
Scenario B: H1 closes below 4157 (breaks structure) then fails retest → target 4135 → 4115 → 4100.
⚠️ Risk Management Notes
Prioritise Buy according to trend; Sell orders are only short-term reactions.
Use M15/M5 to time entries at the specified zones.
If H1 closes below 4125, consider narrowing buy positions, wait for the 4100–4080 zone.
🌷 Conclusion
H1 upward channel still guides the flow 💛. Patiently wait for adjustments to 4163–4165 or 4130–4133 to buy according to trend, manage orders tightly as price approaches 4215–4225.
If useful, please 💛 like – 💬 comment – 🔔 follow LanaM2 for daily gold updates ✨

ambuja is looking superb for long term buying ambuja is taking support on trendline and creating good demand and company is also giving good discount for investor go for buying side good move will be seen in long term basis
