Cipla - Positional LongCMP 1342 on 11.02.26
All important levels are marked on the chart.
The range between 1280 and 1330 appears to be a support level. The price is sustaining and consolidating here. If it goes up. may go to the levels of 1425/1480/1550.
The setup fails if the price sustains below 1280-1270.
The above illustration is only for learning and sharing purposes, not a buy or sell recommendation.
All the best.
Futures

BTCUSDT Technical Analysis (1H Timeframe)BTCUSDT is showing a bearish structure on the 1H timeframe, with price rejecting strongly from the 71,300–71,800 supply zone and forming lower highs. The recent upside move looks corrective, and price is failing to hold above previous demand, signaling weak bullish momentum.
The key area to watch is 68,888. A breakdown below this level confirms continuation to the downside, with liquidity resting below recent lows. The next major demand zone sits between 68,000 and 67,200, aligning with prior reactions and imbalance.
Trade Setup:
Sell below 68,888 | TP1: 68,000 | TP2: 67,222 | SL: 70,222
Bias remains bearish below 70,200; bullish control only above 71,800.
Disclaimer:
This analysis is for educational purposes only and does not constitute financial advice. Cryptocurrency trading involves significant risk, and losses may exceed your investment. Always do your own research and manage risk properly before entering any trade.

Economy Future at Risk: A Comprehensive Analysis1. Mounting Global Debt and Fiscal Fragility
One of the most serious threats to the future economy is the explosion of global debt. Governments, corporations, and households have borrowed aggressively, especially after the 2008 financial crisis and the COVID-19 pandemic. Ultra-low interest rates encouraged debt-fuelled growth, but rising rates have now turned that debt into a burden.
Many governments are trapped in a cycle where higher interest payments consume public finances, limiting spending on infrastructure, healthcare, and education. Developing economies face even greater risk as currency depreciation and capital outflows increase the cost of servicing foreign debt. If debt sustainability weakens further, sovereign defaults or forced austerity could slow global growth for years.
2. Inflation, Monetary Tightening, and Growth Slowdown
The resurgence of inflation has altered the economic landscape. After years of price stability, supply chain disruptions, energy shocks, and expansive fiscal policies triggered sharp inflation across major economies. Central banks responded with aggressive interest rate hikes to restore credibility.
While necessary, tight monetary policy carries risks. High interest rates slow consumption, reduce corporate investment, and weaken housing and credit markets. If tightening continues too long, economies may slide into prolonged stagnation or recession. On the other hand, easing too early risks reigniting inflation. This delicate balance makes future economic stability uncertain.
3. Geopolitical Fragmentation and Trade Disruptions
Globalization once acted as a stabilizing force, improving efficiency and reducing costs. Today, geopolitical fragmentation threatens those gains. Trade wars, sanctions, regional conflicts, and strategic decoupling between major powers have disrupted global supply chains.
Economic blocs are increasingly prioritizing national security over economic efficiency. This shift raises costs, reduces productivity, and increases volatility. Energy markets, semiconductor supply chains, and critical minerals have become geopolitical tools, making economies more vulnerable to external shocks.
4. Climate Change and Environmental Stress
Climate change is no longer a future risk—it is an economic reality. Extreme weather events damage infrastructure, disrupt agriculture, and strain public finances. Rising sea levels threaten coastal cities and trade hubs, while water scarcity impacts food security and industrial production.
The transition to a low-carbon economy also presents challenges. While green investment creates opportunities, poorly managed transitions can destroy jobs, destabilize energy markets, and widen inequality. Economies that fail to adapt face declining competitiveness and rising long-term costs.
5. Technological Disruption and Labor Market Uncertainty
Technology is both a driver of growth and a source of risk. Artificial intelligence, automation, and digital platforms are reshaping industries at unprecedented speed. While productivity gains are possible, job displacement remains a serious concern.
Many economies lack the education systems and reskilling frameworks needed to absorb displaced workers. This mismatch could increase unemployment, wage inequality, and social unrest. If the benefits of technological progress remain concentrated among a small segment of society, economic stability may erode.
6. Rising Inequality and Social Instability
Economic inequality has widened across and within countries. Wealth concentration, stagnant wages, and limited upward mobility weaken consumer demand and social cohesion. When large segments of the population feel excluded from growth, political polarization increases.
Social unrest, populism, and policy unpredictability follow economic inequality. These dynamics discourage investment, weaken institutions, and reduce long-term growth potential. A future economy built on unstable social foundations is inherently fragile.
7. Financial Market Excesses and Systemic Risk
Financial markets have become increasingly complex and interconnected. The growth of derivatives, shadow banking, high-frequency trading, and leveraged products has amplified systemic risk. Asset bubbles fueled by liquidity and speculation pose a constant threat.
When markets disconnect from real economic fundamentals, corrections become more severe. Sudden liquidity shortages or institutional failures can spread rapidly across borders, as seen in past crises. Without strong regulation and transparency, financial instability remains a persistent risk to economic futures.
8. Demographic Shifts and Productivity Challenges
Many advanced economies face aging populations and declining birth rates. A shrinking workforce places pressure on pension systems, healthcare spending, and productivity growth. At the same time, younger populations in developing economies often lack sufficient employment opportunities.
Without policies that encourage productivity, innovation, and labor participation, demographic imbalances could drag down global growth for decades. Immigration, education reform, and workforce flexibility will be crucial in managing this transition.
9. Policy Coordination Failures
Global challenges require global solutions, yet international coordination is weakening. Divergent monetary policies, inconsistent climate strategies, and fragmented trade rules reduce effectiveness. When countries act in isolation, spillover effects amplify instability.
Lack of trust between nations limits crisis response capacity. The future economy depends heavily on cooperation in finance, trade, health, and climate—areas where coordination is currently strained.
10. Is the Future Economy Doomed?
Despite these risks, the future is not predetermined. Economies have demonstrated resilience throughout history. Innovation, institutional reform, and adaptive policymaking can mitigate many of these threats.
Sustainable growth requires a shift from debt-driven expansion to productivity-led development. Investment in education, green technology, digital infrastructure, and inclusive growth models can restore long-term stability. Strong institutions, transparent governance, and prudent risk management remain key pillars.
Conclusion
The future of the economy is undeniably at risk—but not beyond repair. Structural weaknesses, global imbalances, and systemic shocks have exposed vulnerabilities that can no longer be ignored. Whether the coming decades bring stagnation or sustainable prosperity depends on choices made today.
Addressing debt, inequality, climate risk, and technological disruption with coordinated, forward-looking policies can transform current challenges into opportunities. The real danger lies not in the risks themselves, but in complacency and delayed action. The future economy will be shaped by how effectively the world responds to this defining moment.

Budget 2026 Highlights: Nifty - 400 Points During Budget 2026🇮🇳 Union Budget 2026 Highlights – Key Takeaways for India’s Growth Story
The Union Budget 2026 sets the tone for India’s next phase of growth, balancing infrastructure push, manufacturing, healthcare, and fiscal discipline. Here are the top highlights you should know 👇
🏥 Healthcare Gets a Historic Boost
✨ ₹1.05 lakh crore allocated to healthcare — crossing ₹1 lakh crore for the first time ever!
🌍 Plan to develop 5 medical tourism hubs with major private hospital chains like Apollo, Fortis, Max, Dr Lal Pathlabs, and Metropolis.
👉 Signals India’s ambition to become a global medical hub.
💰 Income Tax – No Changes
📌 No change in income tax slabs
📌 Existing structure continues for AY 2026–27
📌 Tax-free income up to ₹12 lakh (via rebates) remains
👉 Stable tax regime = predictability for taxpayers.
📈 Capital Expenditure Push
🚧 Capex increased 9% to ₹12.2 lakh crore
⚙️ Focus on heavy machinery, mining, and manufacturing equipment
📦 Goal: Reduce import dependence
👉 Strong long-term growth signal.
🛡️ Defence Allocation
💣 ₹5.95 lakh crore for defence
🔬 Focus on research, land, and equipment
👉 Boost for defence manufacturing & technology.
☀️ Renewable Energy Focus
🌞 ₹1,775 crore for solar power (grid)
📈 Up from ₹1,500 crore last year
👉 Reinforces India’s green energy transition.
💻 IT Sector Relief
🧾 Safe Harbour threshold raised from ₹300 crore to ₹2,000 crore
📉 Lower tax disputes & simplified compliance
👉 Big positive for mid-to-large IT firms.
🧪 Biopharma Push
💊 ₹10,000 crore under Biopharma Shakti (5 years)
🧬 Focus on biologics & biosimilars
👉 Boost for pharma innovation and domestic production.
🏭 Manufacturing & Semiconductors
🔌 Semiconductor Mission 2.0 announced
📦 Electronics component scheme scaled to ₹40,000 crore
🧠 Focus on R&D, IP, and skilled workforce
👉 Strengthening India’s tech ecosystem.
🧵 Textile & Rural Industry Boost
👕 Mega Textile Parks announced
🧶 Gram Swaraj Initiative for khadi, handloom & handicrafts
🌍 Push for exports and branding
👉 Support for rural employment and MSMEs.
🚢 Logistics & Infrastructure
🚂 Dankuni–Surat freight corridor proposed
🚤 20 new national waterways in 5 years
👉 Cheaper, eco-friendly cargo movement.
🪨 Rare Earth Strategy
🌍 Rare earth corridors in Odisha, Kerala, AP, Tamil Nadu
🔋 Reducing dependence on China
👉 Strategic for EVs & electronics.
📊 Fiscal Health
📉 Fiscal deficit target: 4.3% of GDP
🏦 Debt-to-GDP: 55.6% (improving)
👉 Shows fiscal discipline.
💵 Market Borrowing
📈 Record ₹17.2 lakh crore gross borrowing in FY27
👉 Important for bond markets & liquidity watchers.
📉 Stock Market Impact
📌 STT on Futures increased from 0.02% → 0.05%
📌 STT on Options increased from 0.1% → 0.15%
📌 Higher cost for derivatives traders
👉 Active traders should factor this in.
🌎 Foreign Investment Relaxation
📊 PROI investment limit raised:
• Individual: 5% → 10%
• Overall cap: 10% → 24%
👉 Encourages foreign participation.
🔎 Overall Budget Mood
✅ Strong on healthcare, manufacturing, defence & infrastructure
✅ Focus on self-reliance & supply chains
⚖️ Balanced fiscal discipline
⚠️ Slight pressure on traders due to STT hike
Futures & Options (F&O) Trading – Complete Explanation1. What Are Derivatives?
Derivatives are financial contracts whose value depends on the price of another asset (called the underlying). In the Indian stock market, the most common derivatives are:
Stock Futures & Options (e.g., Reliance, TCS)
Index Futures & Options (e.g., NIFTY, BANK NIFTY, FINNIFTY)
F&O contracts are standardized and traded on exchanges like NSE and BSE, ensuring transparency and safety.
2. Futures Trading Explained
Definition of Futures
A futures contract is a legally binding agreement to buy or sell an underlying asset at a predetermined price on a specified future date.
Key Features of Futures
Fixed contract size (lot size)
Fixed expiry date (weekly or monthly)
Requires margin, not full payment
Both buyer and seller are obligated to fulfill the contract
Example
Suppose NIFTY is trading at 22,000. You expect it to rise.
You buy NIFTY Futures at 22,000
If NIFTY moves to 22,200, you gain 200 points
If it falls to 21,800, you lose 200 points
Profit or loss = Price difference × Lot size
Advantages of Futures
High leverage
Suitable for trend trading
Easy to understand
Good liquidity in index futures
Risks in Futures
Unlimited losses
High volatility impact
Margin calls during adverse movement
3. Options Trading Explained
Definition of Options
An option is a contract that gives the buyer the right, but not the obligation, to buy or sell the underlying asset at a specific price on or before expiry.
Options are safer than futures for buyers because loss is limited to the premium paid.
4. Types of Options
Call Option (CE)
Gives the right to buy
Used when you expect the price to rise
Put Option (PE)
Gives the right to sell
Used when you expect the price to fall
5. Option Buyers vs Option Sellers
Option Buyer
Pays premium
Limited risk (premium paid)
Unlimited profit potential (theoretically)
Needs strong price movement
Option Seller (Writer)
Receives premium
Limited profit (premium received)
Unlimited risk
Higher probability of profit
Requires high margin
6. Key Option Terminologies
Strike Price
The price at which the option can be exercised.
Premium
The price paid to buy the option.
Expiry
Date on which the option contract expires.
Intrinsic Value
Actual value of the option if exercised immediately.
Time Value
Extra value due to time remaining until expiry.
7. Option Moneyness
ITM (In The Money) – Has intrinsic value
ATM (At The Money) – Strike ≈ Market price
OTM (Out Of The Money) – No intrinsic value
8. Option Greeks
Greeks measure how option prices change with market factors.
Delta – Sensitivity to price movement
Theta – Time decay (loss of value over time)
Vega – Sensitivity to volatility
Gamma – Rate of change of delta
Rho – Sensitivity to interest rates
Understanding Greeks is crucial for risk management in options trading.
9. Hedging Using F&O
F&O is widely used for risk protection.
Example: Portfolio Hedging
If you own stocks worth ₹10 lakh, you can:
Buy NIFTY Put Options
Loss in portfolio is offset by gains in puts during market fall
Hedging reduces downside risk but also limits profit.
10. Speculation in F&O
Most retail traders use F&O for short-term speculation due to leverage.
Common strategies:
Buying calls in bullish markets
Buying puts in bearish markets
Selling options in range-bound markets
Speculation requires discipline, risk control, and experience.
11. Common Option Strategies
Basic Strategies
Long Call
Long Put
Covered Call
Protective Put
Advanced Strategies
Bull Call Spread
Bear Put Spread
Iron Condor
Straddle & Strangle
Strategies help manage risk and improve probability.
12. Margin System in F&O
Futures require SPAN + Exposure Margin
Option selling requires high margin
Option buying needs only premium
Margins change with volatility and market conditions.
13. Expiry and Settlement
Index F&O: Cash-settled
Stock F&O: Mostly cash-settled
Weekly and monthly expiries available
On expiry day, time value becomes zero.
14. Advantages of F&O Trading
High leverage
Profit in rising, falling, and sideways markets
Portfolio protection
Advanced trading strategies
15. Risks of F&O Trading
High volatility
Emotional trading
Over-leverage
Rapid capital erosion
According to exchange data, most retail traders lose money in F&O due to lack of discipline and risk management.
16. Risk Management in F&O
Essential rules:
Always use stop-loss
Risk only 1–2% of capital per trade
Avoid overtrading
Trade with a plan
Understand product fully
17. Who Should Trade F&O?
F&O is suitable for:
Experienced traders
Disciplined investors
Hedgers
Not ideal for:
Beginners without market knowledge
Emotion-driven traders
Those seeking guaranteed income
Conclusion
Futures and Options trading is a powerful financial tool that offers opportunities for profit, hedging, and strategic trading. However, it also carries significant risk due to leverage and volatility. Success in F&O depends not on prediction, but on risk management, strategy selection, discipline, and continuous learning. Traders who treat F&O as a professional business rather than gambling stand a better chance of long-term survival and profitability.

Kalyan Jewellers Bullish SetupKalyan Jewellers
F&O Segment Stock
The stock fell almost 50% from its high of about ₹783 in September 2024. But now it's finding good support, building a base, and moving inside a parallel channel. For the past year, it's been stuck in a range—which usually means a bigger move is getting ready (could be a channel, triangle, or some other pattern).
Here's why I'm positive about it:
It's holding strong at the channel's lower support line.
It's sitting right on key moving averages (EMA support).
There was a big jump in trading volume near the support zone, which shows real buyers stepping in.
The chart shows a few resistance levels above—these can become price targets if the stock breaks out.
For safety, keep your stop loss at the previous major low for capital protection.
Trade wisely.

Possible Decline Toward 113 on T-Bond FuturesAccording to my analysis on the daily chart of T-Bond futures, there is a high probability of a decline toward the 113 level in the coming days.
This bearish outlook is supported by two main technical elements:
-A clear Head and Shoulders reversal pattern, indicating a potential trend change.
-A confirmed breakout, as highlighted on the chart, which strengthens the likelihood of further downward movement.

What BTC has to offer now - Swing Trade opportunityBINANCE:BTCUSDT.P
DELTAIN:BTCUSD.P
BYBIT:BTCUSDT.P
BTC played our level perfectly giving about 8.5% return in three days
Now what can be done next - LETS DISCUSS
After touching our level 94000 which was a 0.5 retracement zone BTC is down 1500 points
I am expecting bearish momentum in the upcoming days
LOGIC - To sustain the upwards trend in the long term BTC has to test its 0.6 retracement zone in 1 month tf which is around 74700 level, I could be 100% wrong but the global environment is not so good which might act as a catalyst for the downwards momentum.
Leverage recommended 5x or below (Level based on Delta Exchange Chart)
Short at Current market price = 92600
Stop loss = 97600
Target 1 = 87500 (RR 1:1)
Target 2 = 80608 (RR 1:2.4)
Target 3 = 74700 (RR 1:3.6)
RR ratio = 1:3.6
Total point to capture = 17850
Stop loss point = 5050
Disclaimer: The content is for educational purposes and should not be considered a recommendation to buy or sell any security.

Silver - CorrectionSeveral signals indicate that a correction is possible around the 60k level (slightly below or above). There’s also an interesting setup in gold, but more on that later in the next chart/idea.”

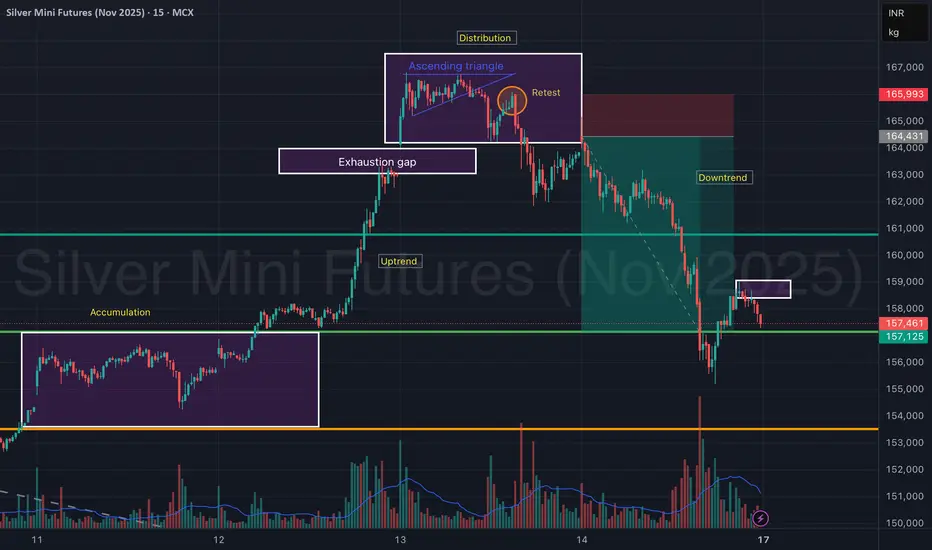
Silver Mini Futures (Nov 2025) – Accumulation to Distribution Silver Mini Futures on the 15-min chart clearly showcases a complete market cycle structure — transitioning from accumulation → uptrend → distribution → downtrend, providing an excellent study in price behavior and volume confirmation.
The move began with accumulation around ₹1,55,000, followed by a strong uptrend breakout, leading to a sharp rally. However, as price entered the ascending triangle near the ₹1,66,000 zone, momentum weakened, signaling distribution.
An exhaustion gap and a failed retest confirmed a reversal, leading to a steep downtrend, which remains active after a minor pullback.
📊 Phase Breakdown:
Accumulation Phase: ₹1,54,800 – ₹1,55,800
Sideways base formation with increasing volume at lows.
Uptrend Phase: Breakout above ₹1,56,000 triggered momentum.
Distribution Phase: Formed an ascending triangle with weak breakout follow-through.
Retest failure at ₹1,65,000 signaled exhaustion.
Downtrend Phase: Sharp decline with heavy volume, currently finding support near ₹1,57,000.
🎯 Key Technical Zones:
Resistance: ₹1,64,400 – ₹1,66,000 (supply zone)
Immediate Resistance (Retest Box): ₹1,58,200 – ₹1,58,800
Support Zone: ₹1,56,800 – ₹1,57,100
Major Support: ₹1,54,500
🧠 View:
Silver Mini Futures is currently in a downtrend continuation phase after a distribution top. A minor retest near ₹1,58,800 could invite short opportunities, while only a sustained move above ₹1,60,000 may signal trend reversal strength.
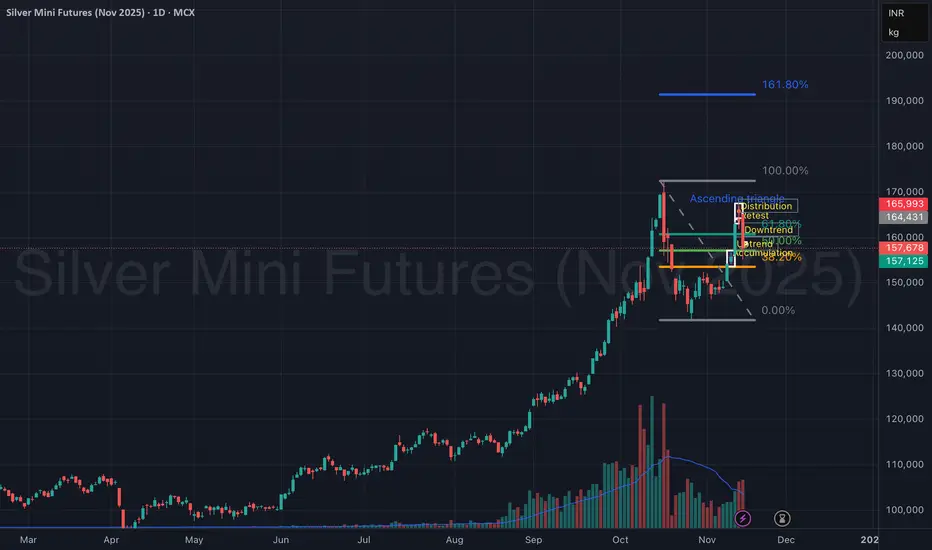
Silver Mini Futures (Nov 2025) – Accumulation to DistributionSilver Mini Futures on the 15-min chart clearly showcases a complete market cycle structure — transitioning from accumulation → uptrend → distribution → downtrend, providing an excellent study in price behavior and volume confirmation.
The move began with accumulation around ₹1,55,000, followed by a strong uptrend breakout, leading to a sharp rally. However, as price entered the ascending triangle near the ₹1,66,000 zone, momentum weakened, signaling distribution.
An exhaustion gap and a failed retest confirmed a reversal, leading to a steep downtrend, which remains active after a minor pullback.
📊 Phase Breakdown:
Accumulation Phase: ₹1,54,800 – ₹1,55,800
Sideways base formation with increasing volume at lows.
Uptrend Phase: Breakout above ₹1,56,000 triggered momentum.
Distribution Phase: Formed an ascending triangle with weak breakout follow-through.
Retest failure at ₹1,65,000 signaled exhaustion.
Downtrend Phase: Sharp decline with heavy volume, currently finding support near ₹1,57,000.
🎯 Key Technical Zones:
Resistance: ₹1,64,400 – ₹1,66,000 (supply zone)
Immediate Resistance (Retest Box): ₹1,58,200 – ₹1,58,800
Support Zone: ₹1,56,800 – ₹1,57,100
Major Support: ₹1,54,500
🧠 View:
Silver Mini Futures is currently in a downtrend continuation phase after a distribution top. A minor retest near ₹1,58,800 could invite short opportunities, while only a sustained move above ₹1,60,000 may signal trend reversal strength.
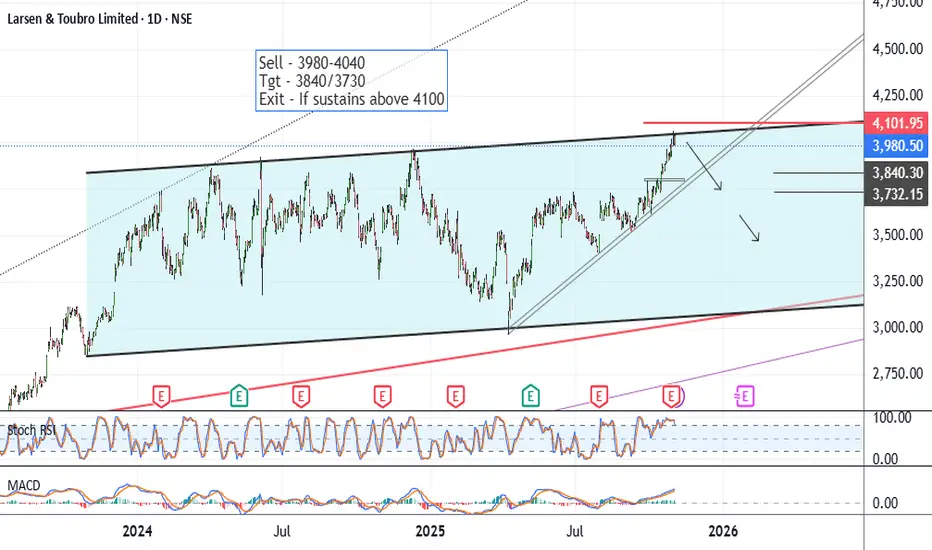
LT - Positional Short SetupCMP 3980 on 04.11.25
In the last 2 years, the stock has been traveling in a rising wedge pattern. At present, it has reached higher levels. If it reverses from these levels, there could be a short opportunity.
All important levels are marked on the chart.
Possible targets may be 3840/3730 or even more downside, depending upon the scenario.
If it sustains above 4100, the exit plan should be exercised.
All the above illustrations and descriptions are for educational and observation purposes only. It is not a buying or selling recommendation.
All the best.
Nasdaq 100 E-mini Futures is declining According to my analysis on the 4-hour timeframe, there is a high probability of a decline in NASDAQ 100 futures toward $250.500 after a breakout from the triangle highlighted on the chart

Resistance Breakout in BPCLBPCL has exhibited a notable resistance breakout on the daily chart, closing above ₹348 and marking a positive uptrend. This move is accompanied by a significant surge in the 350 November call option, up over 50%, confirming bullish sentiment. The breakout is supported by strong candle structure and aligns both spot and option price action, suggesting momentum continuation. Traders may consider BPCL for momentum-based strategies, monitoring for a move towards the next resistance. As always, disciplined risk management is advised when entering trades after key breakouts. This setup strengthens the bullish outlook for BPCL short-term.
B

BTC Levels. Bull Case. 2026Look out for ATH after over 78k range in the long run.
The Red levels are mostly as SL in Bull case scenarios and the light ones are (confidence level colored) targets. Green are entry. If I can I'll update later.
Thank you.
You are encouraged to comment your opinions as well :)

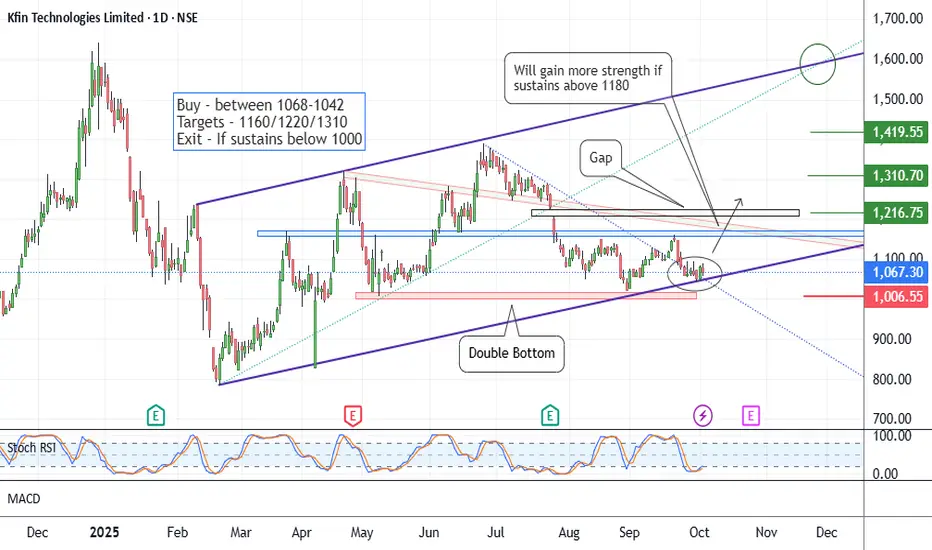
Kfin Tech - Low Risk Long SetupCMP 1067 on 04.10.25
All important levels are marked on the chart.
The price has been traveling in a parallel channel and presently resting at the lower edge of the channel.
Also, a double bottom pattern was formed, with a bottom of around 1000.
First target is 1160, considering the stop loss of 1000.
If it crosses 1180 and sustains above, it will gain more strength.
If it sustains below 1000 levels, the setup will go weak.
One should keep the position size in accordance with the risk capacity.
All these illustrations are only for learning and observation purposes; they should not be considered as trading recommendations.
All the best.
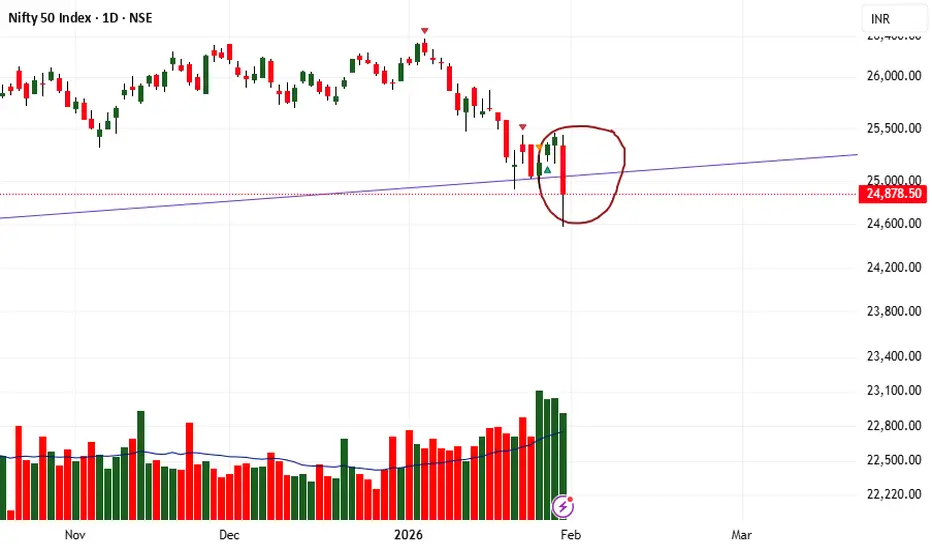
“Nifty 50 Intraday Key Levels | Buy & Sell Zones 9th Oct 2025”“Want to learn more? Like this post and follow me!”
25278🔴 Above 10m closing Shot Cover Level
Strong resistance — short covering likely above this.
25178🟠 Below 10m hold PE By level /
Above 10m hold CE by level
25078🟣 Above 10M hold positive trade view
Below 10M hold negative trade view
Sentiment deciding level — crucial for trend direction.
24980⚫ Above Opening S1 10m Hold CE By level
Bullish entry level — CE hold area.
24890🟠 Below Opening R1 10m Hold PE By level
Below 10m hold PE By Risky Zone Weak zone — PE may strengthen below this.
24780🟢 Above 10M hold CE By Safe Zone level
Safe bullish zone — CE can be held confidently above.
24,770 🔵 BELOW 10M hold UNWINDING level
Breakdown zone — unwinding or heavy selling possible below.

Will crude drop to $61.70?hello,
according to my analysis on 2h time frame there is high probability that crude oil futures could drop to 61.7 IN FEW HOURS,

Zyduslife - Near Breakout LevelsCMP 1013.85 on 07.09.25
All important levels are mentioned on the chart.
For a year, the level of 1030 has been acting as a resistance zone.
The price has formed a Cup & handle pattern. Presently nearing the level of breakout.
If it sustains above 1030, it will gain strength.
If it sustains below 980-970, the setup will weaken, and the exit plan should be exercised.
Possible targets are 1120/1170+.
All these illustrations are only for educational and sharing purposes. It should not be considered as a buy or sell recommendation.
All the best.

Bajaj Finance - Seems to be on SupportCMP 853 on 12.08.25
In the last 15-20 days, the stock price has come down to 853 from 970. Present level may act as support again, as can be seen on the chart.
If it bounces back, it will form a Double bottom pattern.
Stochastic RSI is showing a reversal sign too.
Targets may be 885/915+.
If it sustains below 840-835 levels, the setup will go weak.
The risk-reward ratio is good at this point.
This illustration is for educational and sharing purposes; this should not be taken as a buying or selling recommendation.
All the best.

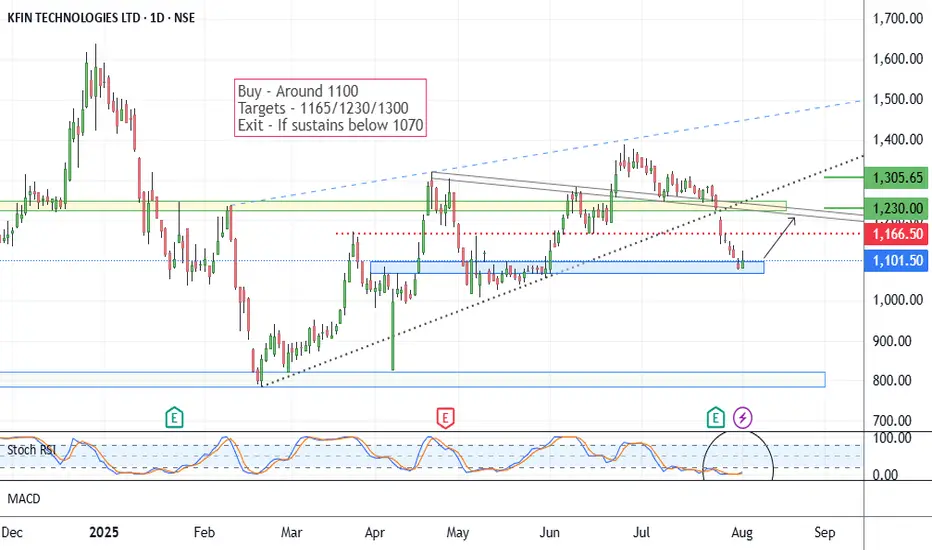
Kfintech - Positional Long SetupIn the last month of July, the stock price fell from 1380 to 1100. Presently seems on a support area. As you may see on the chart. This setup is based on a reversal possibility from the support range around 1080.
Stochastic RSI shows a reversal sign.
Possible targets may be 1165/1230 and 1305.
If it sustains below 1070-1050 levels, the setup will go weak. Below 1070, the exit plan should be considered.
One has to keep the position size according to the risk management.
All these illustrations are my personal view, only for learning and observation purposes; this is not buying or selling advice.
All the best.
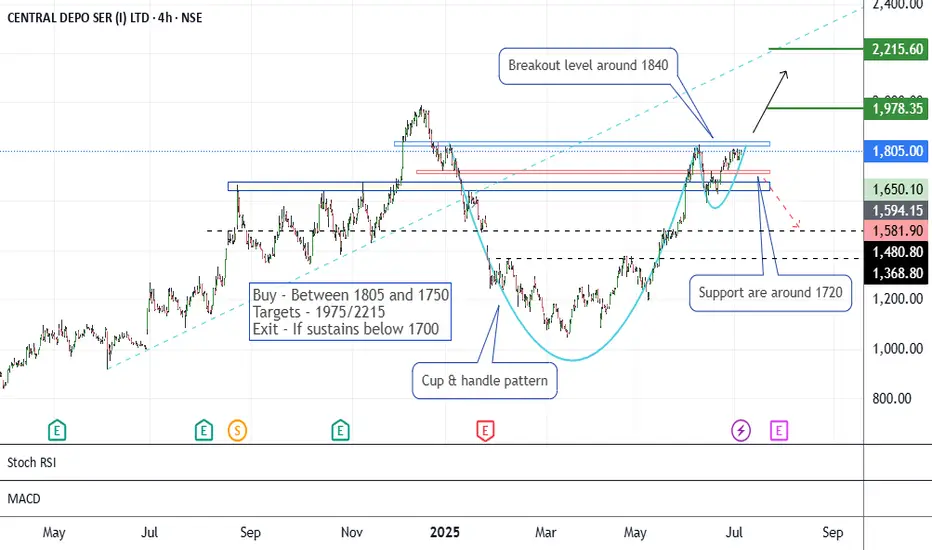
CDSL - An AnalysisThe stock price has formed a Cup & Handle-like pattern since January 2025. This moment is reaching near the breakout levels of 1820-1840.
If it sustains above 1840, it may go bullish to see the levels of 1975/2215.
Support levels are around 1710.
One has to maintain risk management according to the exit levels below 1700.
Second view -
If it does not sustain above the levels of 1840-1860, and slips down below 1700, the setup will show weakness and a bearish view. Then it may go lower to the levels of 1480 and 1365.
All these illustrations are for learning and knowledge-sharing purposes. It should not be considered as a buying or selling recommendation.
All the best.
Nifty 50 Intraday Plan for July 23, 2025📌 For more insights & live explanations,
👉 Visit my YouTube channel – Click the icon above ☝️
🔺 Bullish Zones (Call Side - CE):
25,138 – Positive Trade View Start
If the market sustains above this level for 10 minutes, the sentiment turns positive.
Possible intraday up-move.
Look for CE entries.
25,260 – CE Entry Level
Strong confirmation of bullish breakout.
Entry point for aggressive CE buyers.
25,380 – Short Covering Zone
If price closes above this, short-sellers may exit in panic.
Expect a sharp up-move / breakout.
24,960 & 25,040 – CE Hold Zones
If holding CE positions, monitor these levels.
Supportive price areas where bulls may defend.
24,760 – Safe CE Zone
A very strong support zone.
If price bounces from here, good for fresh CE trades.
🔻 Bearish Zones (Put Side - PE):
25,120 – Negative Trade View
If price breaks this level and stays below 10 mins, bias turns bearish.
25,018 – Opening R1 PE Hold
Below this, market may gain bearish strength.
Short trades may get active.
24,938 – PE Hold Level
Important support zone.
Break here can give aggressive PE momentum.
24,700 – Unwinding Level
If price sustains below this, it can trigger long unwinding.
Strong bearish continuation expected.
