Nifty 50 – Intraday Plan for July 16, 2025📊 Intraday Key Levels & Strategy:
🔺 Upside Zones (CE Bias):
25,270 – Above 10M hold = Positive Trade View
25,390 – Above 10m hold CE by entry level
25,478 – Above 10m closing = Shot Cover Level
⚠️ Neutral to Mixed Zones:
25,120 – Above Opening S1: 10m Hold CE Buy Level
25,100 – Below Opening R1: 10m Hold PE Buy Level
25,070 – Below 10M = Negative Trade View
🔻 Downside Zones (PE Bias):
24,990 – Below 10m hold PE by level
24,920 – Below 10m hold PE = Risky Zone
24,880 – Above 10M = CE Safe Zone
24,860 – BELOW 10M = UNWINDING zone.
✅ Suggested Intraday Plan:
Bullish Scenario (CE Trades):
Buy CE above 25,120 (Only if 10 min candle holds).
Add on breakout & hold above 25,270.
Target zone: 25,390–25,478.
SL: Below 25,070.
Bearish Scenario (PE Trades):
Sell/Buy PE below 25,100 (Only if 10 min candle sustains).
Confirm further weakness if below 24,990 or 24,920.
Target zone: 24,880–24,860.
SL: Above 25,120.
Futures

ASIANPAINT – Strong Bounce from Demand Zone________________________________________________________________________________📈 ASIANPAINT – Strong Bounce from Demand Zone | Option Chain + Price Action Breakdown
🕒 Chart Type: 15-Minute
📆 Date: July 3, 2025
________________________________________________________________________________
🔍 What’s Catching Our Eye:
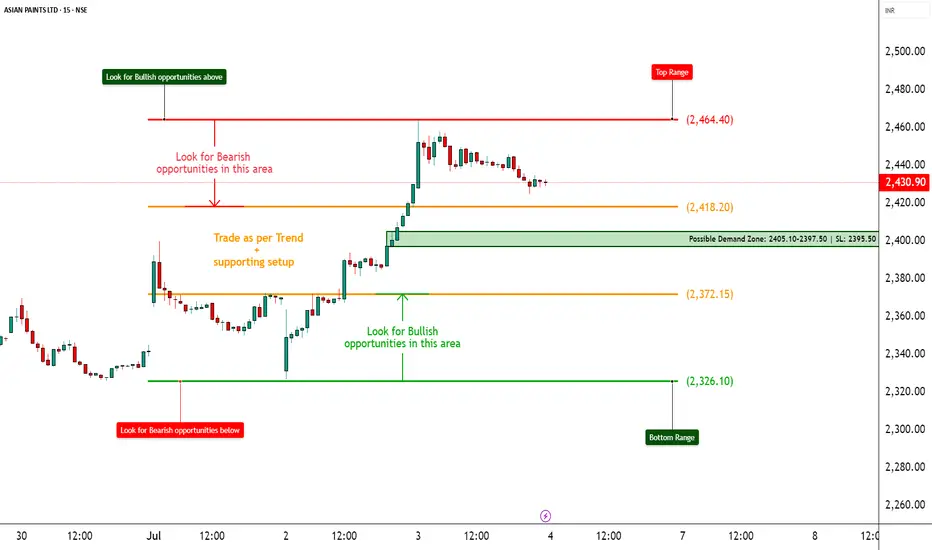
ASIANPAINT saw a sharp intraday rebound from its marked demand zone at ₹2405–₹2397.50, with price closing near ₹2,430.90. The reversal occurred on higher volume and in the presence of long build-ups across multiple Call strikes. This suggests institutional interest and a potential shift in short-term sentiment.
________________________________________________________________________________
📌 What We’re Watching For:
The key observation is that ASIANPAINT respected its demand zone and bounced with strength. If the price sustains above ₹2,440, it could trigger continuation toward the top range of ₹2,464.40. On the downside, any failure to hold the demand zone may bring back pressure toward ₹2,400. Option chain data supports the bullish bias, with fresh long positions across ATM and OTM calls.
________________________________________________________________________________
📊 Volume Footprint:
Today’s volume was 1.55M, higher than the previous 1.36M, signaling strong participation during the bounce. A continuation move with volume > 1.5M may validate breakout setups.
________________________________________________________________________________
📈 Option Chain Highlights:
The 2,500 CE, 2,460 CE, and 2,440 CE all witnessed strong long build-ups, confirming bullish positioning. Even the deep OTM 2,600 CE showed healthy open interest increase. Meanwhile, 2,400 PE showed short build-up, suggesting put writers are confident that the ₹2,400 level will hold. Notably, 2,400 CE also saw short covering, adding further weight to the bullish narrative.
________________________________________________________________________________
🔁 Trend Bias:
🟢 Bullish above ₹2,440, especially if volume confirms a clean move
________________________________________
🧠 Trade Logic / Reasoning:
The bounce from demand was technical and backed by derivatives activity. The presence of long build-ups across multiple Calls and the short covering at 2400 CE suggests strength. Since price closed above key EMA zones and respected the lower boundary, it builds a solid case for an upward move, unless volume suddenly drops or a fresh supply emerges.
________________________________________________________________________________
📍 Important Levels to Mark:
🔺 Top Range Resistance: ₹2,464.40 – Watch for bullish breakout or reversal candlestick
🔻 Bottom Range Support: ₹2,326.10 – Deeper support; unlikely to come into play unless 2400 breaks
________________________________________________________________________________
🎯 Trade Plan (Educational Purpose Only):
✅ Best Buy (Cash/Futures):
Buy above ₹2,440 with bullish price action and volume confirmation. Reversal from the demand zone is valid as long as price holds above ₹2,405.
✅ Best Sell (Cash/Futures):
Sell only below ₹2,405 if the price breaks the demand zone with high volume and bearish structure. Downside may open toward ₹2,380–₹2,360.
💼 Best CE to Long:
2,440 CE or 2,460 CE – Both strikes show strong Long Build-Up; ideal for directional continuation above ₹2,440.
📉 Best PE to Long:
2,400 PE – Consider only if price breaks and sustains below ₹2,405 with heavy volume and weak candle close. Risk-reward turns favourable for downside hedging.
🟢 Demand Zone: ₹2405.10 – ₹2397.50 | SL: ₹2395.50
🔴 Supply Zone: Not clearly visible yet (watch ₹2464+ for fresh seller emergence)
⚠️ Invalidation Below:
Bullish bias invalid if price closes below ₹2,395 with strong volume and momentum.
________________________________________________________________________________
⚠️ Disclaimer:
This post is for educational purposes only.
STWP is not a SEBI-registered advisor.
This is not a buy/sell recommendation.
Please consult your financial advisor before trading.
STWP is not responsible for any trading outcomes.
________________________________________________________________________________
💬 Found this helpful?
Drop your thoughts in the comments ⬇️
🔁 Share this with fellow traders
✅ Follow STWP for zone-based price action & option chain insights
🚀 Let’s grow awareness for structured & patient trading!
________________________________________________________________________________
Titan - Keep On WatchCMP 3652 on 26.06.25
The chart itself is self-explanatory. The price has formed a Cup & Handle-like pattern since February 2025. This time, it is reaching the breakout levels.
MACD shows a likely reversal, too.
If it breaks out, it may go bullish to reach the levels of 3850, 4050, and potentially higher, depending on the market conditions.
In case of any correction, support levels are around 3510.
One may plan entry on different levels while considering risk management and position size.
All these illustrations are only for learning and sharing purposes; it is not buy or sell advice. Please do your research before taking any trade.
All the best.

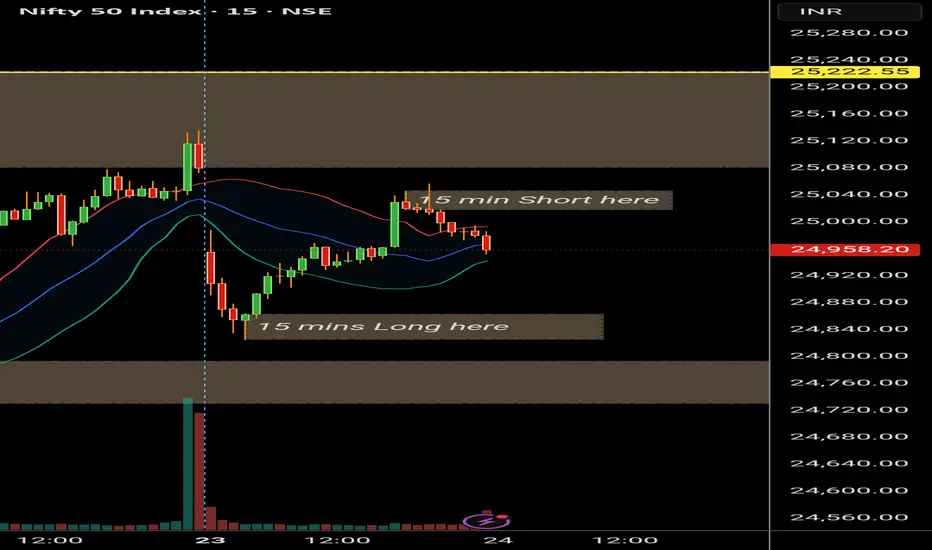
NIFTY: Don't fiddle in the middleAs shown in the chart, Long and short zones are identified. Outside box are SL.
Box to box movement is what we really want, but 1:2, 1:3 profits can be collected
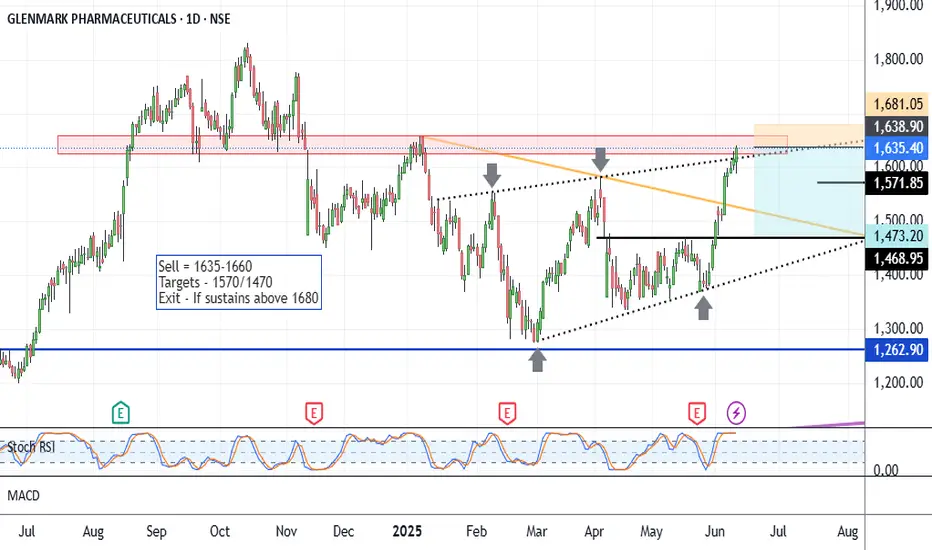
Glenmark - Short SetupCMP 1635 on 12.06.25
The chart is self-explanatory. The stock price has increased by approximately 20% over the past month. This time, reaching the confluence area around 1640-1650.
If the area around 1650 reacts as resistance again, a correction period will then ensue.
Targets may be 1570/1470.
The setup will lose significance if it sustains above 1680.
The above illustration and analysis are only for learning and sharing purposes; it is not buy or sell recommendations.
All the best.
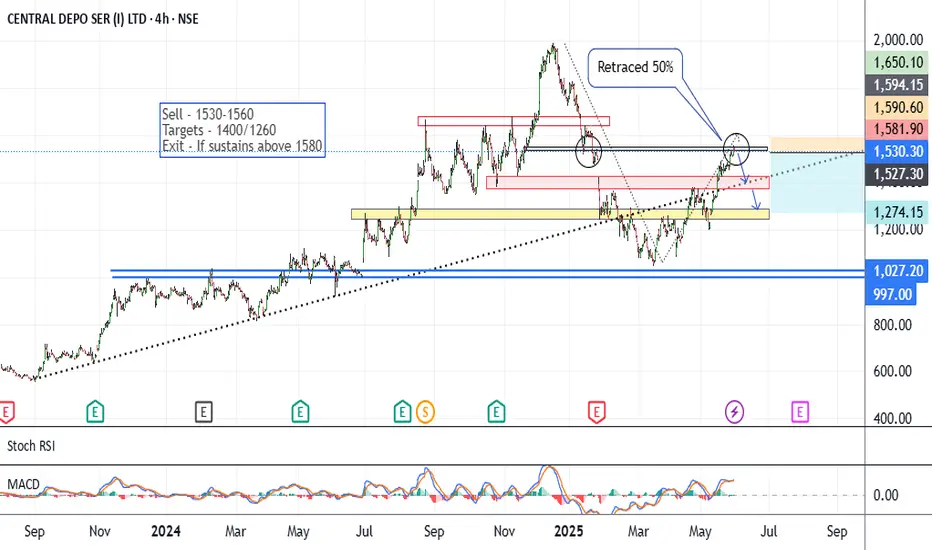
CDSL - Short SetupCMP around 1530 on 01.06.25
The chart is almost self-explanatory. Since March 25, the price has risen by around 50%. This time trading on a likely resistance area.
If price rejects these levels of 1530-1560, it may go into a correction ahead.
Lower targets may be 1400/1260.
The setup weakens if it sustains above 1580 levels.
One should keep the position size according to the risk management.
All these illustrations are provided for learning and sharing purposes only; they do not constitute buy or sell advice. Please do your research before taking any position.
All the best.
Bank nifty Futures 08.05.25Expecting a gap up to flat opening. May get a morning move on the upside. However overall, we have a bearish structure on higher TF. My strategy for the day will be to sell on rise. Incase I do not get a downward move will prefer to stay out of the markets.

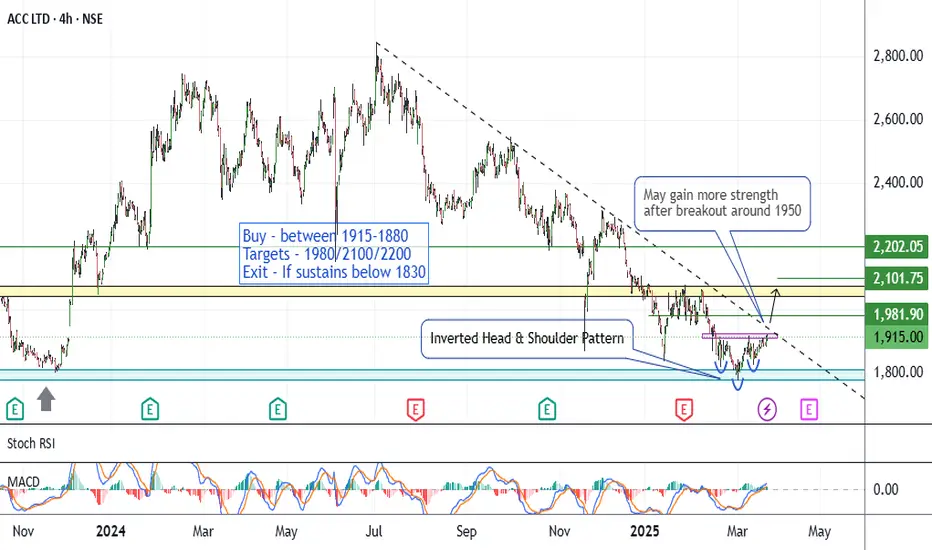
ACC - Long SetupCMP 1915 On 24.03.25
Since July 24, the stock price has dropped around 40%. According to the chart setup, it seems to be getting ready for a breakout now.
Has been consolidating into a small range in recent sessions. Now formed an inverted Head & Shoulder pattern. Also, there will be a breakout of the dotted line, joining the tops of wicks of the last 8 months.
If gives a breakout around 1950, there may be a bullish phase ahead. Targets may be 1980/2100 and 2200.
The setup will lose significance if sustains below 1830.
The strategy should be coupled with some hedging tool for better risk coverage, if possible. Or keep your position size according to the risk capacity.
All these illustrations are only for learning and sharing purposes, only for paper trading. It is not a buy or sell recommendation.
All the best.
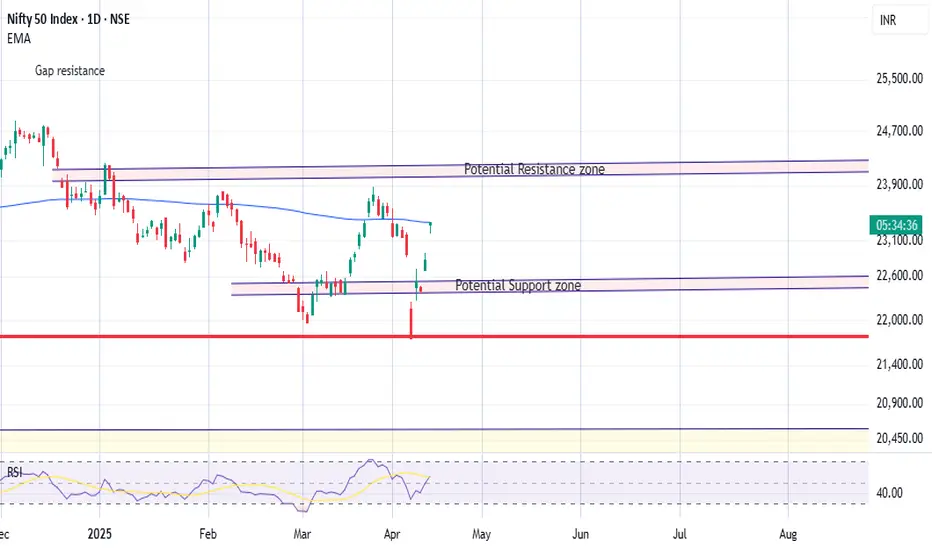
Nifty: Whats in storeNifty
With Trump Tariffs taking a pause for 90 days, we might see some consolidation in the market.
Nifty Options strategy example for learning purpose
Short Strangle for 29 May 2025 series
Selling 24200 Call option currently around 190
&
Selling 23300 Put option currently around 190
can give 380 points to the seller
The strategy would yield max profitable if Nifty closing on 29 May 2025 is any where between 23300 - 24200
On a capital requirement of approx Rs 2 lakhs the strategy provides a max profit potential of approximately 14% in 1 and 1/2 months
Loss in strategy if Nifty closes
below 21920 or
above 24580 on 29 May 2025
Use it for education purpose only to understand
- how the strategy works and
- risk management
Take care and safe trading
Disclaimer
not SEBI registered
I have been wrong in the past and can again be wrong
trading in Futures and Option involves risk. Pls do due diligence
understand the risk involved and see your comfort level
remember it is your money, treat it wisely
consult your financial adviser before taking any decision
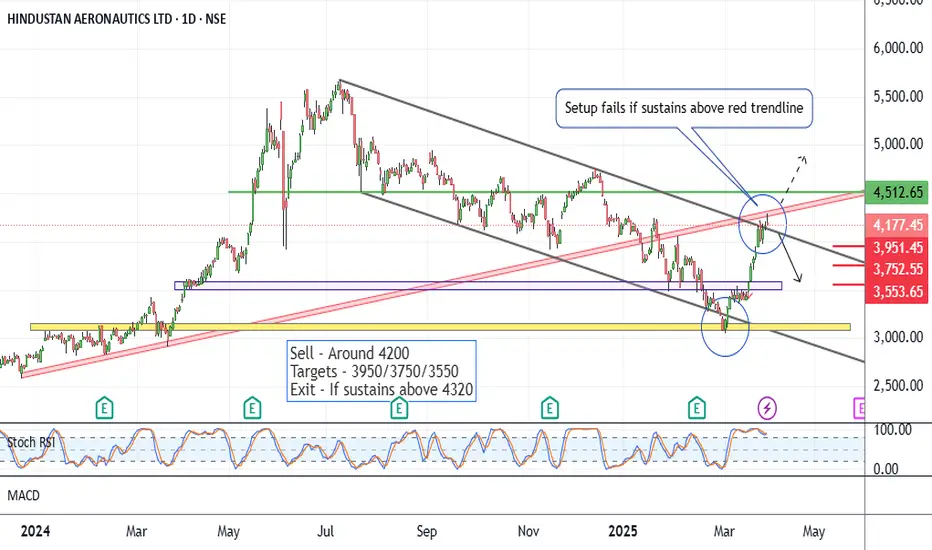
HAL - What Next ?CMP 4177 on 31.03.25
The stock has shown a 40% rise in the recent month. This time may face resistance as shown on the chart (the red trendline).
If the price is rejected from these levels, a downside move can be seen ahead. That can push the price down to the levels of 3950/3750 and 3550.
The setup fails if the price sustains above 4320 levels.
The strategy may be coupled with some hedging options for a wide coverage.
All these illustrations are only for learning and sharing purposes, for paper trading. They are not trading recommendations in any way.
All the best.
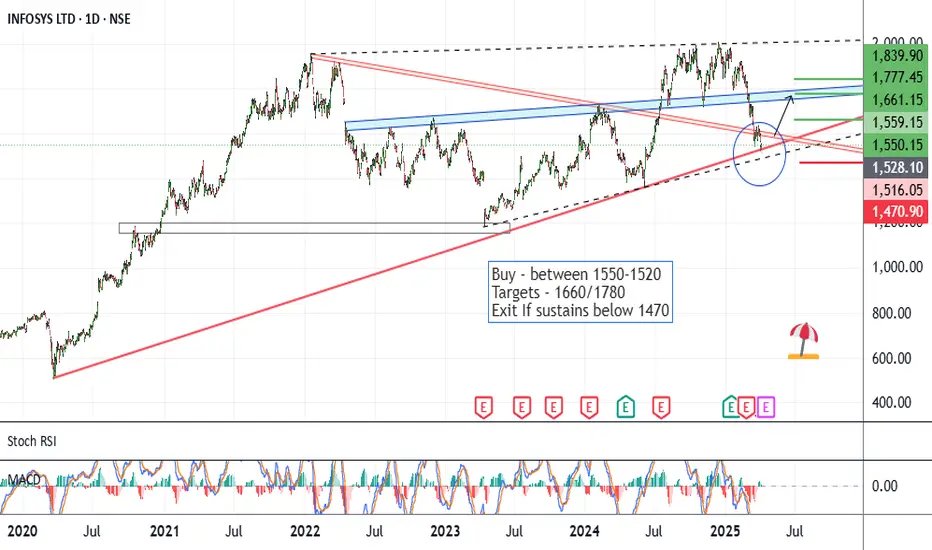
Infy - Long SetupCMP 1550 on 03.04.25
The chart marks all the important levels. The stock price has corrected by around 25% in recent weeks. According to the above setup, it seems to be on the supports.
If it reverses from these levels, it may go into a bullish phase ahead. Possible targets may be 1660/1780/1840.
The setup will lose significance if the price sustains below 1470.
One should keep the position size according to risk management.
All these illustrations are only for learning and sharing purposes, not a trading recommendation.
All the best.
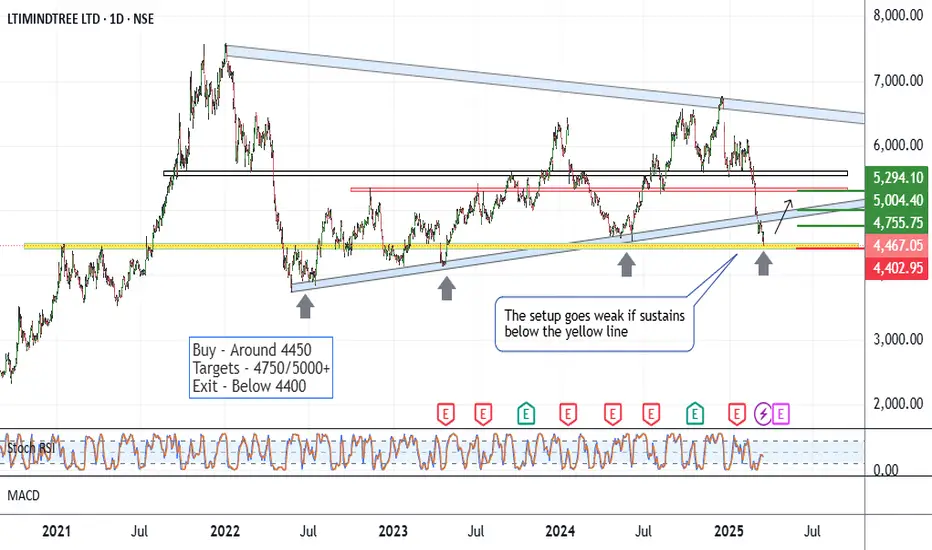
LTIM - Low Risk IdeaCMP 4467 on 16.03.25
The chart shows all the critical levels. The price has corrected around 30% in recent weeks. At this moment, it is on support, as seen in the chart.
Considering a possible reversal from the current levels gives an idea of buying with a small risk.
Possible targets may be 4750/5000 and even more, depending on the index movement ahead.
The setup goes weak if the price sustains below 4400 for a couple of days. In given conditions, the strategy should include Hedging tools for better coverage.
All these illustrations are only for learning and sharing purposes, not a buy or sell advice in any case. I am not a registered analyst.
Before entering a trade, be ready to take a loss on what you have decided.
All the best.
Britannia - Keep On WatchCMP 4575 on 04.03.25
The price movement has made a head & shoulder-like pattern in recent sessions and showed a breakdown of the pattern.
Also, the price has fallen to a crucial projection level that has acted as a support in the last 5 years. If it breaks down and sustains below this level, a bearish move may be seen.
Downside targets may be 4150/3800 or even more.
This setup remains active if the price sustains below 4700. Above 4820, setup will go weak.
One should keep the position size according to the risk management.
All these illustrations are only for learning and sharing purposes, not a buy or sell recommendation in any form.
All the best.

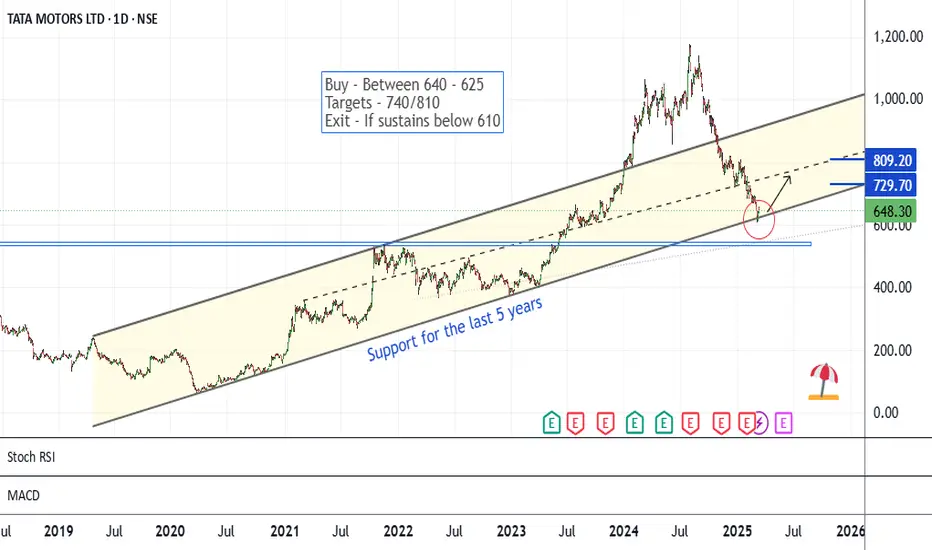
Tata Motors - Simple Long SetupThe chart is self-explanatory. The price has been travelling in a higher high-higher low pattern for the last 5 years. This time comes to the lower levels.
In the recent 5-6 sessions, it has shown a bounce back.
If momentum continues, a bullish move may be seen ahead.
The risk-reward ratio is quite good for positional trading at these levels.
If it sustains below 610 levels on a closing basis for 2-3 days, the setup will lose significance.
All these illustrations are only for learning and sharing purposes; it is not a buy or sell recommendation.
All the best.
Max Financial - Low Risk SetupCMP 1032 on 20.02.25
It is clear from the chart that the stock price has been rising in a parallel channel in recent sessions. Right now it is at the bottom of the channel.
If gives a bounceback, may go into a bullish phase again.
The risk-reward ratio seems good at the moment.
The setup remains active when the price sustains inside the parallel channel.
Plz keep the position size according to the risk management.
All the above illustration is my own view. Shared only for learning purposes. It is not a trading recommendation in any form.
All the best.

Eicher - Seeing A ReversalCMP 4703 on 17.02.25
All important levels are mentioned on the chart.
In the last 6 months, the stock price has taken support many times on the dotted line shown on the chart. This time again comes to the support.
The price is corrected around 10% after the earnings declaration.
Though it is a risky setup, the risk-reward ratio is quite good at present.
If gives a bounceback, upside targets may be 4910/5100 and 5300.
Keep your stop-loss strict according to risk management.
This is only for learning and sharing purposes, not a trading recommendation in any way.
All the best.

Titan - Keep On WatchCMP 3580 on 03.02.25
The above chart shows that the price has been traveling in a rising parallel channel in recent sessions. At this moment, the price has touched the upper edge of the channel. If rejected from these levels, a bearish move may be seen further.
Targets may be 3510/3330 and 3190.
Please keep in mind the earnings day around 4th February.
This setup fails if the price sustains above 3710.
Plan your trade as per your risk management. ( entry and exit)
The above illustration is my view. It is only for learning and sharing purposes, not a trading recommendation.
All the best.

Database option TradingOptions are a type of contract that gives the buyer the right to buy or sell a security at a specified price at some point in the future. An option holder is essentially paying a premium for the right to buy or sell the security within a certain time frame.
Options are highly sensitive to market volatility. Significant price swings can lead to substantial gains or losses. A trader might buy a put option expecting a stock to drop. If the stock instead surges in price due to unforeseen events, the value of the put option plummets.

Britannia - Low Risk SetupCMP 4834 on 05.01.25
The charts mention all important levels. This time, the stock has bounced back from a long-term support channel and formed a double-bottom pattern.
If the momentum continues it may go to 5240/5580 or more.
If it sustains below 4650, the setup goes weak.
one should keep the position size following risk management.
All this illustration is only for learning and sharing purposes, it is not trading advice.
All the best.

Aarti Ind - Low Risk OpportunityIn the last 6 months, the stock price has come down around 40%. This time has been consolidating in a small range in recent days.
MACD is showing a possible reversal on a weekly basis.
If it gives a reversal, it may go into a bullish phase again.
Possible targets are 485/570/620++.
If it sustains below 370, the setup goes weak.
One has to keep the position size in accordance with risk management.
This illustration is my own view. It is only for learning and sharing purposes. It is not a buying recommendation.
All the best.

Navin Fluorine - Positional SetupThe chart shows the possible supports and resistances. At present, the price is about to cross a predefined resistance area around 3450-3500. If crosses the zone and picks some momentum, we may see upper targets according to the setup.
Also, the gap area upside is to be filled in due time, of course in a bullish phase.
If sustains above 3500, may go to 4000/4200 or even more.
If sustains below 3200, this setup will go weak.
Decide your entry and exit levels and position size in accordance with your risk management.
All this illustration is only my view, just for learning and sharing purposes, not trading advice in any form.
All the best.

Astral - Keep An EyeThe stock price has dropped around 40% in the last six months. Now coming at the multiple support levels as shown on the chart. If it gives a reversal from the support levels, it may go into a bullish phase again.
It may reverse from 1550 or 1470 levels. One should wait for the reversal signs according to their setups.
Possible targets may be 1685/1770/1930+
The setup fails if the price sustains below 1440. Better to keep the position size following risk management or exercise hedging.
This is only for learning and sharing purposes, not a buy or sell recommendation. Please do your research before taking any trade.
All the best.

OIL INDIA - SWING TRADE ON LONG SIDESymbol - OIL
OIL is currently trading at 420
I'm seeing a trading opportunity on buy side.
Buying OIL Futures at 420
I will add more long position at 410, if comes.
Holding with SL of 397
Targets I'm expecting are 445 - 460 & above.
Disclaimer - Do not consider this as a buy/sell recommendation. I'm sharing my analysis & my trading position. You can track it for educational purposes. Thanks!
