Futures

POSITIONAL CALL IN HINDPETRO SEPT FUTPOSITIONAL CALL IN HINDPETRO
IF I AM RIGHT WE MIGHT HAVE FOUND THE
CRUCIAL SECOND BOTTOM IN HINDPETRO
FUTURES TRADE
BUY@255
STOP@249
TARGET@290
LOT:1575
QTY:2

MOMENTUM SWING TRADE IN RELIANCE (SHORT/BUY) SEPT FUTSO SHORT TRADE PLAYED OUT PRETTY WELL
DONT BE FOOLED THAT THE STOCK HAS TURNED FOR GOOD
BE AWARE ITS EXPIRY
NOW WE CATCH IT ON THE UP SIDE
A SLIDE TO 1245 CAN BE SOLD NOW AND COVERED @1250
AND ADD FRESH LONGS @1245-50
FIRST TRADE
SHORT@1280
STOP@1290
TARGET@1250
LOT:1000
QTY:1
SECOND TRADE
BUY@1245-50
STOP@1235
TARET@1280
LOT:1000
QTY:2

POSITIONAL TRADE IN YESBANK SEPT (FUT)POSITIONAL TRADE ON YESBANK
SEPTEMBER FUTURES
BUY THE DIPS ONES THE NEWS OF RANA KAPOOR IS
FACTORED WE WILL HAVE A SHORT COVERING RALLY
GOOD ENTRY LEVELS
ACCUMULATE
BUY@360
STOP@350
TARGET@392
LOT:1750
QTY:2

BTST IN JETAIRWAYS SEPTEMBER FUTBTST IN JETAIRWAYS
SEPTEMBER FUTRES
BAD NEWS FACTROED
CRUDE OIL REVERSAL LOOKING GOOD FROM RESITANCE LEVE(BRENT CRUDE)
BUY@293
STOP@289.5
TARGET@310
LOT:1200
QTY:2
JLong

POSITIONAL TRADE IN IRB INFRA IN SEPT FUTPOSITIONAL TRADE IN IRB INFRA
SEPTEMBER FUTURES
DOWNWARD TRENDLINE BREAOUT
MACD GAINING MOMENTUM
BUY@197
STOP@187
TARGET@217
LOT:2500
QTY:1

SHORT SWING TRADE IN RELIANCE AUG FUT(WITH A STRICT STOP)SHORT SWING TRADE IN RELIANCE
NOTE:TYRING TO CATCH PROFIT BOOKING AND
1320 WAS A STRONG RESISTANCE BEFORE SPILT
RISK CAUTION I AM FULL TIME TRADER AND RISK TAKER
THIS TRADE IS NOT TO DETERMINE THE TREND
SHORTING RELIANCE DUE TO RSI TOUCHING 80 LEVELS
ON DAILY AND WEEKLY CHART
SHORT @1319
STOP@1330
TARGET@1300
LOT:1000
QTY:2


SHORT TRADE IN ARVIND SEPT (FUT)SHORT TRADE IN ARVIND
SEPTEMBER FUTURES
TRIPLE TOP FORMATION AND
A DOUBLE TOP ON HOURLY CHART
SHORT@401
STOP@405
TARGET 1@395
TARGET 2@ 390
LOT:2000
QTY:2

HLong

STBT IN AUROPHARMA ON CONDITIONAL BASIS AUG FUTAUROPHARMA SHORT TRADE(IF PENNANT BREAKOUT DOWN)
AUGUST FUTURES
SHORT AT THE BREAKOUT OF THE PENNANT AFTER
2:30 THE BAR WILL BE COMPLETE A BREAK BELOW
THE SUPPORT LINE OF 684 IS A GOOD INDICATION
SHORT@684
STOP@590
TARGET@666
LOT:1000
QTY:2

SWING TRADE IN ACC CEMENT(CONDITIONAL) AUG FUTSWING TRADE IN ACC CEMENT(CONDITIONAL)
RANGE BREAK-OUT POSSIBLE
ASCENDING TRIANGLE WITH HIGHER LOW FORMATION
CONDITIONAL BUY
BUY@1651-55(ABOVE 1650 ON CLOSING BASIS)
STOP@1638
TARGET@1680
LOT:400
QTY:2

BTST IN POWERGRID AUG FUTBTST IN POWERGRID
AUGUST FUTURES
SHORTCOVERING AOND 200-DMA TESTING
BUY@197
STOP@193.5
TARGET@203
LOT:4000
QTY:1

BTST IN HDFC BANK AUG FUTBTST IN HDFC BANK
AUGUST FUTURES
BUY@2080
STOP@2069.5
TARGET@2098
LOT:500
QTY:2

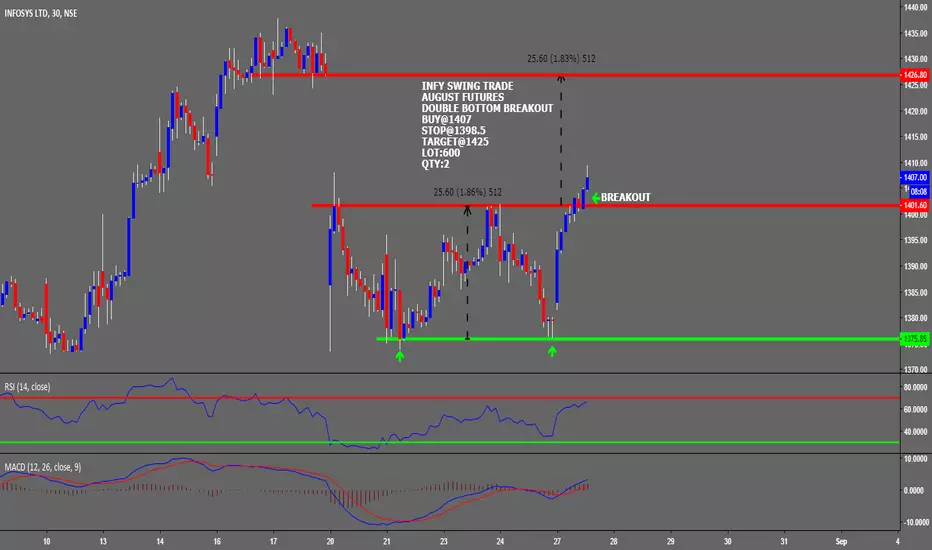
INFY SWING TRADE IN AUG (FUT)INFY SWING TRADE
AUGUST FUTURES
DOUBLE BOTTOM BREAKOUT
BUY@1407
STOP@1398.5
TARGET@1425
LOT:600
QTY:2
OSITIONAL SWING TRADE IN BPCLPOSITIONAL SWING TRADE IN BPCL
2ND TIME AT LOWER LEVELS
SEPTEMBER FUTURES
BUY@360
STOP@352
TARGET@390
LOT:1800
QTY:2


BTST IN KPIT TECHBTST IN KPIT TECH
AUGUST FUTURES
DOWNWARD TRENDLINE BREAKOUT
BUY@295.5
STOP@292
TARGET@299.5
LOT:4000
QTY:1
KLong

POSITIONAL TRADE IN HDFC BANK AUG (FUT)POSITIONAL TRADE IN HDFC BANK
DOUBLE BOTTOM BREAKOUT IN HOURLY CHART
PLUS DOWNWARD CHANNEL BREAKOUT
AUGUST FUTURES
BUY@2110.5
STOP@2099.5
TARGET@2125
LOT:500
QTY:2


BTST IN TVS MOTORS AUG (FUT)BTST IN TVS MOTORS
SECOND TRADE IN 2 DAYS
AUGUST FUTURES
BUY@542
STOP@534.5
TARGET@550
LOT:1000
QTY:1

SWING TRADE IN AXISBANK AUG (FUT)SWING TRADE IN AXIS BANK
POSSIBLE CONSOLIDATION BREAJKOUT
AUGUST FUTURES
CONDITIONAL BUY
BUY@634.5(ABOVE 630)
STOP@629
TARGET@650
LOT:1200
QTY:1

BTST IN GRASIM AUG (FUT)BTST IN GRASIM
AUGUST FUTURES
BUY@1063
STOP0@1047.5
TARGET@1085
LOT:750
QTY:1
