SBIN 1D Time frame📍 Current Price
₹823.30 (down 0.06% from previous close)
Short-Term Outlook
Bullish Scenario: A sustained move above ₹836 could lead to a test of the 52-week high around ₹875.50.
Bearish Scenario: A drop below ₹785.10 may signal a potential pullback toward ₹794.00.
Gann

MARUTI 1D Time frame📍 Current Price
₹15,325.00
Short-Term Outlook
Bullish Scenario: A sustained move above ₹15,450 could lead to a test of the 52-week high around ₹15,384.
Bearish Scenario: A drop below ₹15,100 may signal a potential pullback toward the ₹14,800 level.

Intraday Trading Tips1. Understanding Intraday Trading
Before diving into tips, let’s understand what intraday trading means.
Definition: Intraday trading involves buying and selling financial instruments—stocks, futures, options, or currencies—within the same trading session.
Objective: Profit from short-term price fluctuations.
Settlement: All open positions must be squared off before market close.
Leverage: Traders often use margin (borrowed money) to maximize gains, but this also increases risks.
For example: If you buy 100 shares of Reliance at ₹2,450 in the morning and sell them at ₹2,480 by afternoon, your profit is ₹3,000 (excluding brokerage).
2. Why Intraday Trading Attracts Traders
Quick profits: No need to wait for years like investors.
Leverage advantage: Small capital can control large trades.
Liquidity: You trade highly liquid stocks that allow easy entry/exit.
No overnight risk: Positions close before the market shuts.
However, the risks are equally high—overtrading, market volatility, and emotional decisions can wipe out capital quickly.
3. Golden Intraday Trading Tips
Tip 1: Choose the Right Stocks
Not all stocks are suitable for intraday trading.
Prefer liquid stocks (e.g., Reliance, Infosys, HDFC Bank).
Avoid penny stocks with low volumes.
Track stocks in the Nifty 50 and Bank Nifty basket—they have strong daily movement.
Look for stocks that follow market trends and are backed by news, earnings, or events.
Example: A stock with daily volume above 10 lakh shares is generally liquid enough for intraday trading.
Tip 2: Trade with a Plan
Trading without a plan is like sailing without a compass. Define:
Entry price – When to buy or sell.
Exit price – Where to book profits.
Stop-loss – How much you are ready to lose if the market goes against you.
A simple 2:1 risk-reward ratio is ideal. If you risk ₹1,000, target ₹2,000 profit.
Tip 3: Learn Technical Analysis
Intraday trading depends more on charts than company fundamentals.
Use candlestick patterns (Doji, Hammer, Engulfing).
Apply moving averages (50-day, 200-day) to spot trends.
Watch RSI (Relative Strength Index) for overbought/oversold zones.
Check Volume Profile to confirm momentum.
Example: If a stock breaks above a resistance level with high volume, it signals a potential intraday buying opportunity.
Tip 4: Follow Market Trend
“The trend is your friend.”
If the market is bullish, focus on buy opportunities.
If bearish, focus on short-selling opportunities.
Avoid going against the broader market trend.
Intraday traders often use Nifty and Bank Nifty movement as indicators of overall sentiment.
Tip 5: Use Stop Loss Religiously
The most important tool in intraday trading.
Decide in advance how much loss you can tolerate.
Place stop-loss orders immediately after entering a trade.
This prevents panic selling and large losses.
Example: Buy at ₹500, set stop-loss at ₹490. If the stock falls, you exit automatically, limiting loss.
Tip 6: Don’t Trade on Emotions
Greed and fear are the biggest enemies.
Avoid “revenge trading” after a loss.
Don’t chase stocks just because they are moving fast.
Stick to your trading plan, not your emotions.
Tip 7: Timing Matters
First 15 minutes after market opens = high volatility. Wait and observe.
Best trading hours: 9:30 AM to 11:30 AM and 1:30 PM to 2:30 PM.
Avoid trading just before market close unless you are squaring off.
Tip 8: Don’t Overtrade
Trading too many stocks at once increases confusion.
Focus on 2–3 quality trades per day.
Avoid random entry and exit without reason.
Remember: Fewer quality trades > Many random trades.
Tip 9: Keep Learning from Market News
Earnings results, RBI policy, crude oil prices, inflation data—all impact intraday trends.
Use reliable sources like Bloomberg, Moneycontrol, NSE updates.
Avoid tips from WhatsApp or Telegram groups without proper analysis.
Tip 10: Maintain Trading Discipline
Follow your rules strictly.
Keep a trading journal: Note entries, exits, reasons for trade, and results.
Review mistakes and improve.
4. Intraday Trading Strategies
Apart from general tips, let’s look at popular intraday strategies:
Breakout Trading: Enter when price breaks a strong support or resistance.
Momentum Trading: Buy rising stocks with strong volume, sell falling ones.
Scalping: Make multiple small trades for tiny profits.
Gap Trading: Trade based on price gaps at market opening.
Moving Average Crossover: Buy when short-term MA crosses above long-term MA, and vice versa for selling.
5. Risk Management in Intraday Trading
Without risk management, even the best trader will fail.
Never risk more than 1–2% of your capital per trade.
Diversify trades instead of betting everything on one stock.
Use proper leverage—don’t borrow excessively.
Conclusion
Intraday trading can be profitable, exciting, and rewarding, but it demands discipline, knowledge, and patience. Following intraday trading tips like choosing liquid stocks, sticking to stop-loss, respecting market trends, and avoiding emotions can make a big difference between success and failure.
Remember: In trading, survival is more important than speed. If you protect your capital and manage risks well, profits will follow.
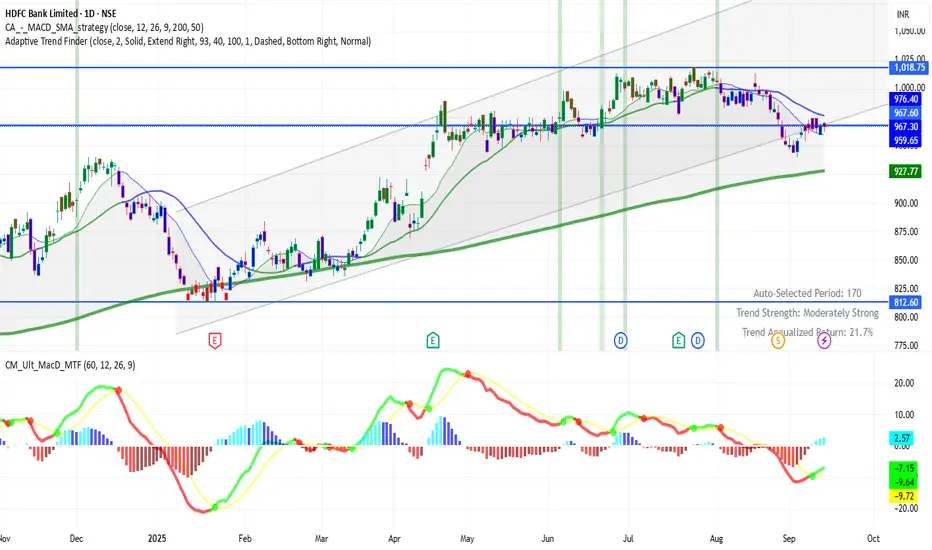
HDFCBANK 1D Time frame📊 Current Status
Price around ₹967
Trading near resistance zone
🔑 Key Levels
Support: ₹960 → ₹950
Resistance: ₹970 → ₹975
✅ Outlook
If price sustains above ₹975, further upside possible. Falling below ₹950 may bring weakness or sideways movement.
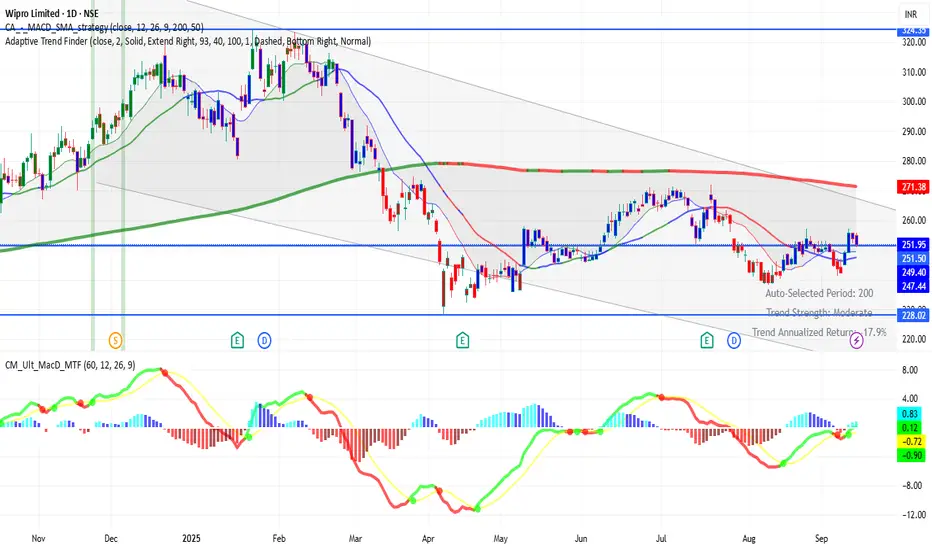
WIPRO 1D Time frame📊 Current Status
Price around ₹252–₹255
Showing recovery from recent support
🔑 Key Levels
Support: ₹242 → ₹240 → ₹230
Resistance: ₹255 → ₹260 → ₹265
✅ Outlook
If WIPRO sustains above ₹255–₹260, more upside is possible. Falling below ₹240 may push price back toward ₹230.
Private and Public Banks: Their Role in Trading1. Understanding Private and Public Banks
1.1 Public Banks
Definition: Banks owned or majorly controlled by governments.
Examples: State Bank of India (SBI), Bank of Baroda, Punjab National Bank, and international giants like China Development Bank or Germany’s KfW.
Role: Support trade finance, infrastructure, and developmental goals while also operating commercially.
Trust Factor: Often seen as safer due to government backing.
1.2 Private Banks
Definition: Banks owned by private individuals or institutions, focused on maximizing profits.
Examples: HDFC Bank, ICICI Bank, Axis Bank, JPMorgan Chase, Goldman Sachs, HSBC (though HSBC has mixed ownership).
Role: More aggressive in expanding into global markets, offering innovative trading products, and catering to high-net-worth individuals and corporates.
2. Banking as a Foundation for Trading
Both types of banks serve as pillars of the trading ecosystem. Their activities include:
Providing Liquidity: Banks buy and sell financial instruments, ensuring markets don’t dry up.
Market Making: Many large banks act as intermediaries in forex and derivatives trading.
Credit Access: Traders and corporations rely on bank credit to fund positions.
Clearing & Settlement: Banks ensure smooth processing of trades through clearinghouses.
Risk Management: Offering hedging tools, swaps, options, and forward contracts.
3. Role of Public Banks in Trading
Public banks play a dual role: stabilizing markets while also enabling participation in global trading.
3.1 Trade Finance
Provide letters of credit (LCs) and bank guarantees for exporters/importers.
Ensure trust in international trade transactions.
3.2 Forex Market Interventions
Act on behalf of central banks to stabilize currency markets.
Support importers by ensuring adequate foreign exchange availability.
3.3 Developmental Trading Role
Encourage financing of essential commodities (oil, wheat, fertilizers).
Maintain food and energy security through commodity trade funding.
3.4 Example: State Bank of India (SBI)
India’s largest public bank actively supports exporters through concessional finance.
Plays a key role in rupee-dollar trade settlement, enhancing India’s presence in global forex.
3.5 Strengths of Public Banks in Trading
Government backing ensures trust and credibility.
Ability to fund large-scale infrastructure trading projects.
Acts as a stabilizer during financial crises.
4. Role of Private Banks in Trading
Private banks are more aggressive and profit-oriented, often setting trends in trading innovations.
4.1 Active Participation in Global Markets
Private banks like JPMorgan, Goldman Sachs, Barclays are market leaders in forex, commodities, and equity trading.
Operate investment banking arms specializing in derivatives, structured products, and electronic trading platforms.
4.2 Wealth Management and Private Banking Services
Offer exclusive access to equity trading, hedge funds, and forex products for wealthy clients.
Provide advisory services to optimize portfolio exposure to global markets.
4.3 Technological Edge
Private banks are pioneers in algorithmic trading and high-frequency trading (HFT).
Platforms like HDFC Securities, ICICI Direct offer retail access to stock markets.
4.4 Example: Goldman Sachs
Dominates derivatives and commodities markets.
Provides structured financing deals for corporations to hedge against risks.
4.5 Strengths of Private Banks in Trading
Innovation-driven, offering sophisticated trading products.
Higher efficiency and faster adoption of fintech.
Wider global presence compared to many public banks.
5. Comparative Roles of Public vs Private Banks in Trading
Aspect Public Banks Private Banks
Ownership Government Private shareholders
Risk Appetite Conservative, stability-driven Aggressive, profit-driven
Innovation Moderate High (HFT, derivatives, fintech)
Global Trading Role Primarily support trade finance and forex Market leaders in derivatives, equities, commodities
Trust Factor Strong due to state backing Strong brand but vulnerable in crises
Client Base Mass market, corporates, governments High-net-worth individuals, institutions, corporates
6. Contribution to Different Types of Trading
6.1 Equity Trading
Public Banks: Generally less active in proprietary equity trading but support retail and institutional participation.
Private Banks: Major global equity traders, offering brokerage, research, and portfolio management.
6.2 Forex Trading
Public Banks: Assist central banks in intervention and stabilize exchange rates.
Private Banks: Global market makers, driving trillions of dollars in daily forex transactions.
6.3 Commodity Trading
Public Banks: Finance essential imports like crude oil and food grains.
Private Banks: Dominate speculative trading in oil, gold, and agricultural futures.
6.4 Derivatives & Structured Products
Public Banks: Use derivatives mainly for hedging national interests.
Private Banks: Innovate complex structured products, options, swaps, and exotic derivatives.
7. Challenges Faced by Public and Private Banks in Trading
7.1 Public Banks
Political interference in lending and trade financing.
Slower adoption of new technologies.
Higher burden of non-performing assets (NPAs).
7.2 Private Banks
Higher exposure to speculative risks.
Vulnerable to global financial shocks (e.g., Lehman Brothers collapse).
Criticism for prioritizing profit over public interest.
8. The Changing Landscape: Fintech and Digital Trading
Both public and private banks are facing disruption from fintechs:
Digital trading apps (Zerodha, Robinhood, Groww) are reducing dependency on banks for stock trading.
Still, banks remain indispensable for clearing, settlement, large-scale financing, and providing credibility.
Public banks are slowly catching up with digitization, while private banks continue to push boundaries with AI-driven trading systems.
Conclusion
The roles of public and private banks in trading are complementary rather than competitive. Public banks provide stability, credibility, and developmental support, while private banks bring innovation, speed, and global connectivity. Together, they form the backbone of the international trading ecosystem.
As trading becomes more globalized, technology-driven, and interconnected, both public and private banks will need to adapt rapidly. The future will likely see a hybrid financial system where state-backed security and private sector innovation coexist to shape the world of trading.

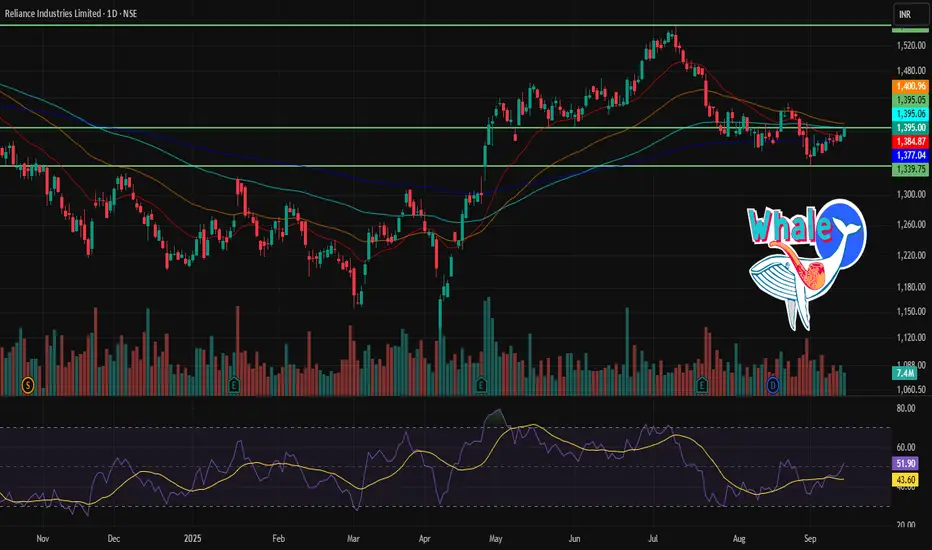
RELIANCE 1D Time frame🔢 Current Level
Trading around ₹1,395
🔑 Key Resistance & Support Levels
Resistance Zones:
~ ₹1,400 – ₹1,410 (near-term resistance)
~ ₹1,420 – ₹1,430 (stronger resistance above)
Support Zones:
~ ₹1,380 – ₹1,370 (first support)
~ ₹1,360 – ₹1,350 (secondary support)
📉 Outlook
Bullish Scenario: Holding above ₹1,400 could push price toward ₹1,420 – ₹1,430.
Bearish Scenario: A fall below ₹1,370 may drag it toward ₹1,350 or lower.
Neutral / Range: Likely to trade between ₹1,370 – ₹1,420 until a breakout or breakdown occurs.
Part 6 Learn Institutional Trading Call & Put Options Explained
At the heart of option trading are two instruments: Calls and Puts.
Call Option: Gives the buyer the right (not obligation) to buy the asset at the strike price.
Buyers expect prices to rise.
Sellers (writers) expect prices to stay flat or fall.
Put Option: Gives the buyer the right (not obligation) to sell the asset at the strike price.
Buyers expect prices to fall.
Sellers expect prices to stay flat or rise.
📌 Example:
If Reliance stock trades at ₹2500:
A ₹2600 call may cost ₹50 premium. If the stock rises to ₹2700, profit = (2700-2600-50) = ₹50 per share.
A ₹2400 put may cost ₹40. If stock falls to ₹2200, profit = (2400-2200-40) = ₹160 per share.
Key Concepts
Intrinsic Value: Real profit if exercised immediately.
Time Value: Premium paid for potential future movement.
In-the-Money (ITM): Option already profitable if exercised.
Out-of-the-Money (OTM): Option has no intrinsic value, only time value.
At-the-Money (ATM): Strike = current market price.

BDLTechnical Analysis (Daily Chart)
Major Trend
The stock has completed a major uptrend from ~₹600 to ~₹2,100 before entering into a corrective phase.
Currently, it has retraced back near the 50% retracement level of this entire up-move, which is an important support zone.
Support Zone (Monthly FVG)
Around ₹1,300–₹1,400, there is a monthly fair value gap (FVG) which acts as a discount zone.
The price has taken support here multiple times, indicating accumulation by buyers.
Resistance Zone (Weekly FVG)
On the upside, strong resistance lies between ₹1,750–₹1,850 where the weekly FVG is placed.
This zone may act as a supply area, where sellers could re-enter.
Current Price Action
Price has bounced sharply from the discount zone (~₹1,350–₹1,400) and is now trading at ₹1,564 (+5.56%) with good volume support.
This bounce suggests short-term bullish momentum.
Possible Scenarios
Bullish case: If the stock sustains above ₹1,500–₹1,520, it may head towards ₹1,750–₹1,850 (weekly FVG resistance).
Bearish case: If it fails near resistance and breaks below ₹1,400, deeper correction towards ₹1,200–₹1,250 is possible.
Volume Observation
Rising volume on the bounce signals strong buying interest from the support zone

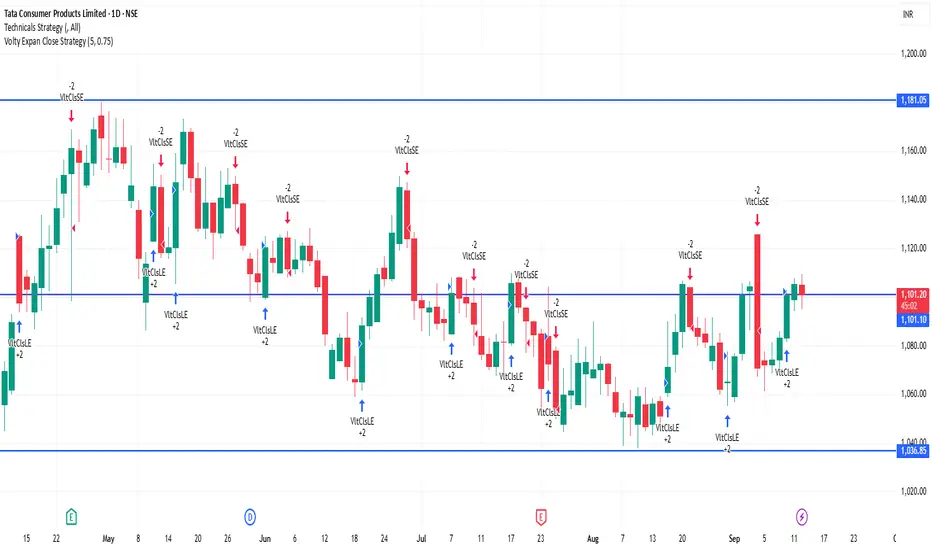
TATACONSUM 1D Time frame🔢 Current Level
Trading around ₹1,101.30
🔑 Key Resistance & Support Levels
Resistance Zones:
₹1,110 – ₹1,115 (recent highs; breakout above this may lead to further upside)
₹1,120 (psychological resistance)
₹1,130 – ₹1,140 (stronger resistance above)
Support Zones:
₹1,095 – ₹1,100 (immediate support; failure to hold above this may lead to a decline)
₹1,085 – ₹1,090 (short-term support; a break below this could indicate weakness)
₹1,070 – ₹1,080 (deeper support zone if price dips further)
📉 Outlook
Bullish Scenario: If Tata Consumer holds above ₹1,100, upward momentum may continue. Break above ₹1,115 can open the way toward ₹1,120+.
Bearish Scenario: If it falls below ₹1,085, risk increases toward ₹1,070 – ₹1,080.
Neutral / Range: Between ₹1,100 – ₹1,115, Tata Consumer may consolidate before a directional move.
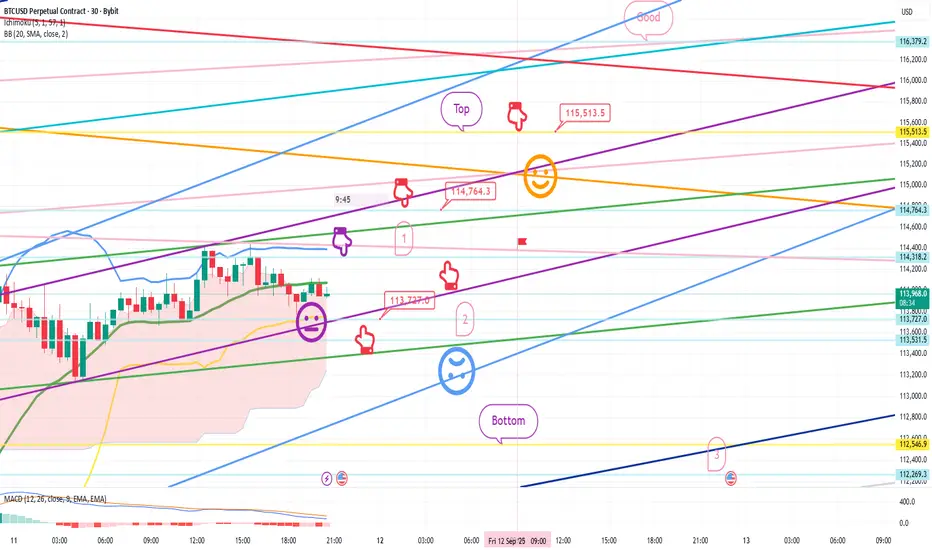
Bitcoin Bybit chart analysis September 11 (CPI)Hello
It's a Bitcoin Guide.
If you "follow"
You can receive real-time movement paths and comment notifications on major sections.
If my analysis was helpful,
Please click the booster button at the bottom.
This is Bitcoin's 30-minute chart.
The CPI indicator will be released shortly at 9:30 AM.
I implemented the strategy based on Nasdaq movements.
*When the red finger moves,
Long position strategy
Confirm the upward wave by touching the first section above (autonomous shorting)
1. $113,727 long position entry point / Stop loss if the light blue support line is broken
2. $114,764.3 long position 1st target -> Top 2nd -> Good 3rd target
If the daily candlestick forms before 9:00 AM tomorrow,
you can switch to a short position if the top section is touched.
You can also use the first section shown as a long position switching point.
If the price falls immediately without touching the purple finger at the top, the final long position is at the second level. The strategy was to place a stop-loss order from the breakout of the light blue support line until the possibility of a sideways movement.
From the breakout of the light blue support line, the price opens up to the bottom -> level 3, so long positions should be cautious.
Please use my analysis to this point for reference only.
I hope you operate safely, adhering to principled trading and a stop-loss order.
Thank you.
Derivatives in India: Secret Strategies for Massive ReturnsChapter 1: Understanding the Derivative Landscape in India
Before diving into strategies, it’s essential to understand the structure of derivatives in India.
1.1 What Are Derivatives?
A derivative is a financial contract whose value is derived from an underlying asset—such as stocks, indices, commodities, or currencies. In India, the most popular derivatives are:
Futures: Obligatory contracts to buy/sell at a predetermined price and date.
Options: Rights (but not obligations) to buy (call) or sell (put) at a specified price.
1.2 Key Milestones in India’s Derivatives Market
2000: NSE introduced index futures (Nifty 50).
2001: Index options and stock options launched.
2002: Stock futures introduced.
2020s: Surge in retail participation, especially in weekly options like Bank Nifty and Nifty.
1.3 Why Derivatives Matter in India
High Liquidity: Nifty and Bank Nifty options are among the most traded contracts globally.
Leverage: Small capital can control large positions.
Risk Management: Hedging against market volatility.
Speculation: Rapid gains (or losses) from price swings.
Chapter 2: The Psychology of Massive Returns
Before we look at the “secret strategies,” it’s important to highlight the psychological aspect.
2.1 Retail vs. Institutional Mindset
Retail traders often chase short-term profits, influenced by tips and news.
Institutions focus on risk-adjusted returns and hedging.
2.2 The Power of Discipline
The secret to massive returns isn’t chasing every trade but mastering risk control. Successful derivative players:
Limit losses using stop-loss orders.
Diversify positions.
Understand implied volatility and time decay.
2.3 The Illusion of Quick Money
Many traders blow up accounts because derivatives magnify both profits and losses. True success comes when strategies align with market structure.
Chapter 3: Secret Derivative Strategies for Massive Returns
Now let’s uncover the advanced and lesser-known strategies that experienced traders in India deploy.
3.1 The “Covered Call” Strategy
How it works: Buy a stock and sell a call option on the same stock.
Why it works in India: Many Indian stocks (like Infosys, HDFC Bank, Reliance) have stable long-term growth. Covered calls allow investors to earn extra income through premiums.
Secret Edge: Institutions frequently roll over covered calls, effectively compounding returns.
3.2 The “Straddle & Strangle” Trick Before Events
Straddle: Buy both a call and a put at the same strike price.
Strangle: Buy a call and a put at different strike prices.
When to use: Before high-volatility events (Union Budget, RBI monetary policy, earnings).
Secret Edge: In India, implied volatility (IV) tends to spike before events, allowing traders to profit even without large price moves.
3.3 The “Iron Condor” Strategy for Sideways Markets
Setup: Sell an out-of-the-money call and put, and buy further out-of-the-money call and put.
Why it works: Indian indices often consolidate after big moves, making non-directional strategies highly profitable.
Secret Edge: Works exceptionally well during weeks when no major events are scheduled.
3.4 The “Calendar Spread” Advantage
How it works: Sell near-term options and buy long-term options.
Why it works in India: Weekly options expire every Thursday, while monthly options provide longer exposure. Traders exploit the faster time decay in short-term contracts.
3.5 The “Delta Neutral” Hedge Fund Style Strategy
Concept: Create positions where overall delta (price sensitivity) is near zero, focusing on volatility instead of direction.
Example: Combine futures and options to balance exposure.
Secret Edge: Many prop desks in India use delta-neutral positions with high leverage to scalp volatility.
3.6 Bank Nifty Weekly Options: The Retail Goldmine
Why Bank Nifty? It has the highest liquidity and volatility.
Secret Trick: Institutions often sell far out-of-the-money (OTM) options to collect premiums, while retail traders chase cheap options.
How to win: Instead of buying OTM lottery tickets, adopt option-selling strategies with strict risk management.
3.7 “Event-Based Futures Arbitrage”
Concept: Price discrepancies often exist between cash and futures markets during dividend announcements, stock splits, or mergers.
Secret Edge: Advanced traders arbitrage these mispricings for near risk-free profits.
3.8 “Sectoral Rotational Strategies”
How it works: Track which sector index (Nifty IT, Nifty Pharma, Nifty Bank) is gaining momentum.
Secret Edge: Derivatives allow leveraged plays on sectors, amplifying returns during sectoral bull runs.
Chapter 4: Institutional Secrets That Retail Misses
Institutions and proprietary trading desks in India use strategies hidden from retail eyes.
4.1 Options Writing Dominance
Data shows institutions and HNIs are net option sellers, while retail is usually on the buying side. Sellers win most of the time due to time decay (theta).
4.2 Smart Order Flow Analysis
Institutions use algorithms to analyze open interest (OI) buildup. For example:
Rising OI with price rise → Long buildup.
Rising OI with price fall → Short buildup.
Retail often ignores these signs.
4.3 Implied Volatility Arbitrage
Big players monitor volatility skews between Nifty and Bank Nifty, or between weekly and monthly contracts. They profit from mispriced options that retail never notices.
Chapter 5: Risk Management – The True Secret to Longevity
No matter how powerful your strategy, risk management is the real differentiator.
5.1 The 2% Rule
Never risk more than 2% of capital on a single trade.
5.2 Stop-Loss Discipline
Options can go to zero, but a stop-loss saves you from portfolio collapse.
5.3 Position Sizing
Institutions diversify across indices, stocks, and expiries to avoid overexposure. Retail traders should do the same.
Conclusion
Derivatives in India present unparalleled opportunities for those who know how to use them wisely. The secret strategies for massive returns aren’t really about exotic formulas—they’re about understanding volatility, market psychology, institutional behavior, and risk management.
While retail traders often chase lottery-style option buying, the real winners are those who:
Sell options with discipline.
Use spreads and hedges to limit risks.
Exploit volatility and time decay.
Align trades with institutional flows.
If you want to succeed in the derivative markets of India, stop searching for shortcuts. Instead, master these strategies, respect risk, and trade with a professional mindset. The potential for massive returns is real—but only for the disciplined few.

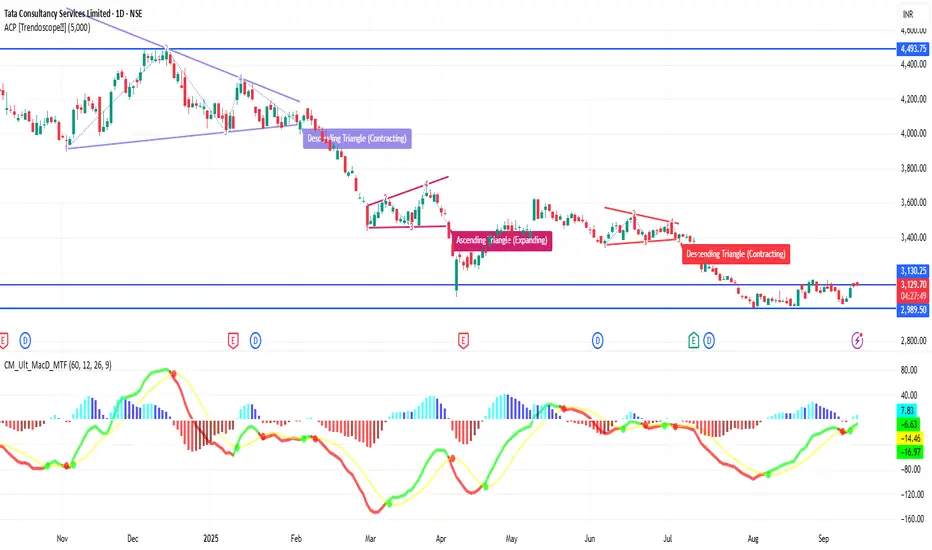
TCS 1D Time frame🔢 Current Level
Trading around ₹3,125 – ₹3,135
🔑 Key Resistance & Support Levels
Resistance Zones:
₹3,138 – ₹3,153 (near-term resistance; breakout above this may lead to further upside)
₹3,167 (stronger resistance above)
Support Zones:
₹3,095 – ₹3,110 (immediate support)
₹3,080 (stronger support if price dips further)
₹3,050 – ₹3,060 (deeper support zone)
📉 Outlook
Bullish Scenario: If TCS holds above ₹3,110, upward momentum may continue. Break above ₹3,153 can open the way toward ₹3,167+.
Bearish Scenario: If it falls below ₹3,080, risk increases toward ₹3,050.
Neutral / Range: Between ₹3,110 – ₹3,153, TCS may consolidate before a directional move.
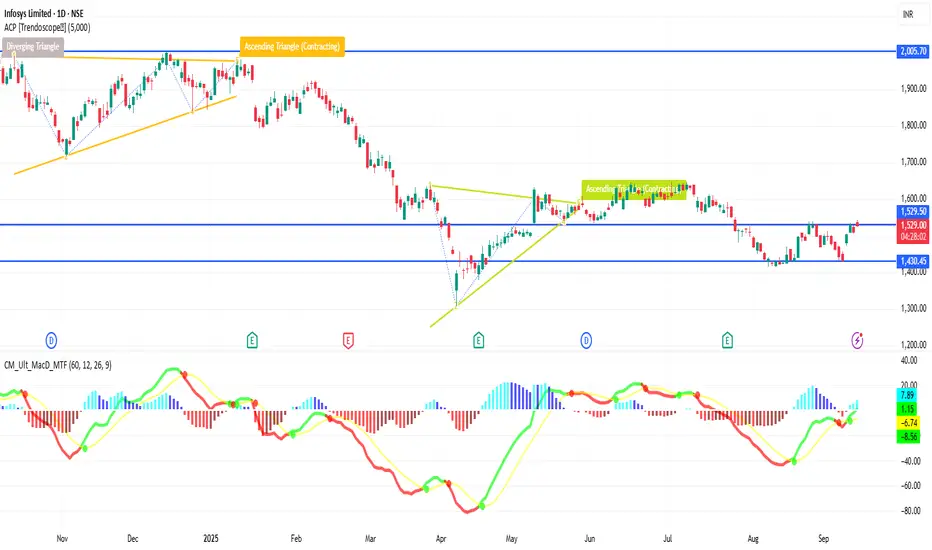
INFY 1D Time frame🔢 Current Level
INFY is trading around ₹1,510 – ₹1,529
🔑 Key Resistance & Support Levels
Resistance Zones:
₹1,518 – ₹1,520 (near-term resistance; breakout above this may lead to further upside)
₹1,530 (stronger resistance above)
Support Zones:
₹1,484 – ₹1,485 (immediate support)
₹1,481 (stronger support if price dips further)
₹1,470 – ₹1,472 (deeper support zone)
📉 Outlook
Bullish Scenario: If INFY holds above ₹1,485, upward momentum may continue.
Breakout Scenario: A move above ₹1,520 can open the way toward ₹1,530+.
Bearish Scenario: If it falls below ₹1,481, risk increases toward ₹1,470 – ₹1,472.
BANKNIFTY 1D Time frame📊 Current Snapshot
Current level: around 54,680 - 54,690
Today’s range: approx. 54,580 – 54,850
🔑 Key Daily Levels
Resistance Zones
54,960 (near-term resistance)
55,172 (major resistance; breakout above this could extend rally)
55,000 (psychological resistance)
Support Zones
54,462 (immediate support)
54,400 – 54,500 (important support band)
54,107 (deeper support if selling pressure continues)
📉 Outlook
Bullish Case: If Bank Nifty sustains above 54,960 – 55,172, it can move higher towards 55,300 – 55,500.
Bearish Case: If it breaks below 54,400, the index may slip toward 54,100 or even lower.
Neutral / Range: Between 54,400 – 54,960, sideways movement is likely until a breakout occurs.

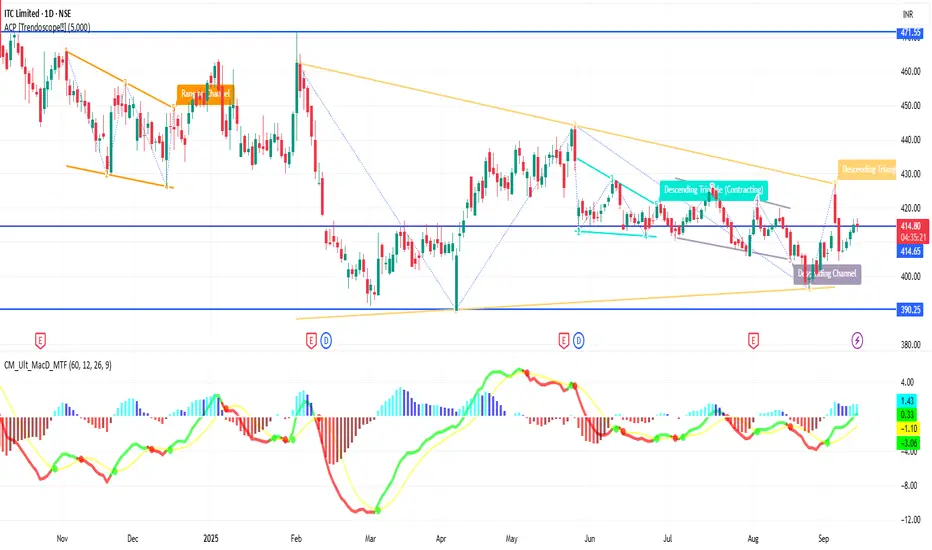
ITC 1D Time frame🔢 Current Level
Trading around ₹414 – ₹432
🔑 Key Resistance & Support Levels
Resistance Zones:
₹435 – ₹438 (near-term resistance; breakout above this may lead to further upside)
₹442 (stronger resistance above)
Support Zones:
₹425 – ₹428 (immediate support)
₹420 (stronger support if price dips further)
₹415 – ₹417 (deeper support zone)
📉 Outlook
Bullish Scenario: If ITC holds above ₹428, upward momentum may continue. Break above ₹438 can open the way toward ₹442+.
Bearish Scenario: If it falls below ₹420, risk increases toward ₹415 – ₹417.
Neutral / Range: Between ₹428 – ₹438, ITC may consolidate before a directional move.
MARUTI 1D Time frame📍 Current Price Action
Last traded price: ~₹ 15,096
Minimal intraday change (~0.1%, slightly up)
⚙ Technical Indicators
RSI (14): ~72 → strong uptrend / overbought conditions
Stochastic RSI: Low / showing weakness → possible cooling off
CCI (14): ~92 → uptrend strength
MFI (Money Flow Index): ~84 → strong buying pressure
📊 Moving Averages & Trend Strength
Price is above 50-day and 200-day SMAs & EMAs → long-term trend is bullish
20-day SMA/EMA are more neutral-to-slightly bullish
All major moving averages are broadly supporting upwards bias
🔧 Support & Resistance / Pivot Zones
Support Levels: ~₹ 14,900 – ₹ 15,000
Resistance Levels / Pivot: ~₹ 15,300 – ₹ 15,500
🧠 Summary
Maruti is in a strong uptrend on the daily chart. Overbought indicators like RSI and MFI suggest buying strength is high, which also means risk of a short-term pullback or consolidation. Key support ~₹ 15,000 needs to hold for bulls. If price clears resistance near ₹ 15,300-15,500 convincingly, upward move likely to continue.

EUR/USD | 1H | Smart Money OutlookPrice has swept the previous low and is reacting from a key liquidity pocket. Structure remains intact for a potential bullish delivery. With CPI expected to print on the stronger side, we could see a favorable USD reaction — but the market is already pricing in the move, setting up EUR/USD for a liquidity grab before a push higher.
I’m watching for:
Accumulation near 1.1680 zone
Break of internal structure for confirmation
Targeting the 1.1730 region as the next supply area
If CPI comes out as expected, we could get that impulsive leg upward aligning with this setup.

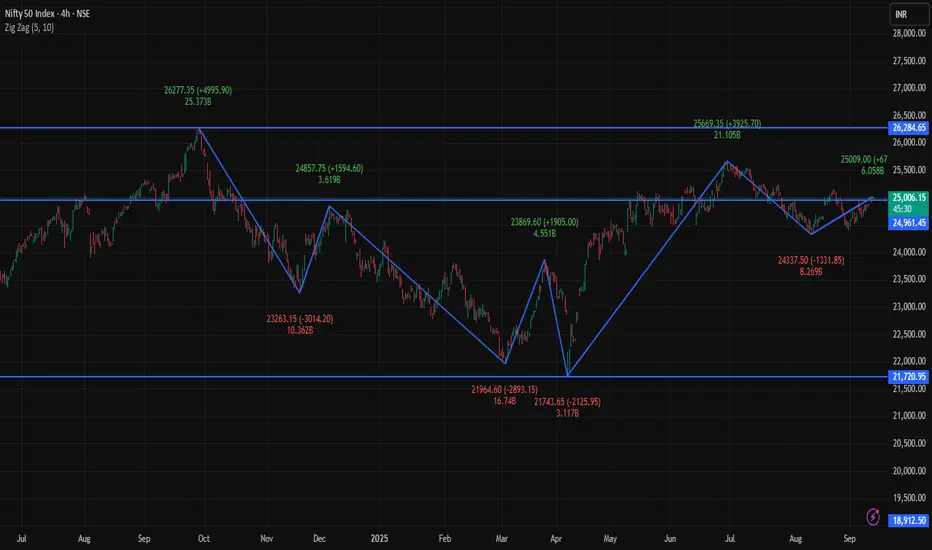
NIFTY 4H Time frame📊 Current Snapshot
Current Price: ₹24,976 - ₹25,006
Day’s Range (4H): ₹24,945 – ₹25,008
Previous Close: ₹24,973
Opening Price (4H): ₹24,991
Volume: Moderate
🔑 Key Support & Resistance Levels
Immediate Support: ₹24,945
Next Support: ₹24,900
Immediate Resistance: ₹25,008
Next Resistance: ₹25,050
📈 Trend & Indicators
Trend: Neutral to mildly bullish; trading near 50-hour and 200-hour moving averages.
RSI (14): 61 – Neutral zone.
MACD: Positive → indicating mild bullish momentum.
Moving Averages: Short-term averages suggest neutral to slightly bullish outlook.
🔮 Outlook
Bullish Scenario: Break above ₹25,008 with strong volume could target ₹25,050.
Bearish Scenario: Drop below ₹24,945 may lead to further decline toward ₹24,900.
Neutral Scenario: Consolidation between ₹24,945 – ₹25,008; breakout needed for directional move.
📌 Key Factors to Watch
Overall market sentiment.
Economic indicators: interest rates, inflation, RBI updates.
Global cues: US indices, crude oil, and currency movements.
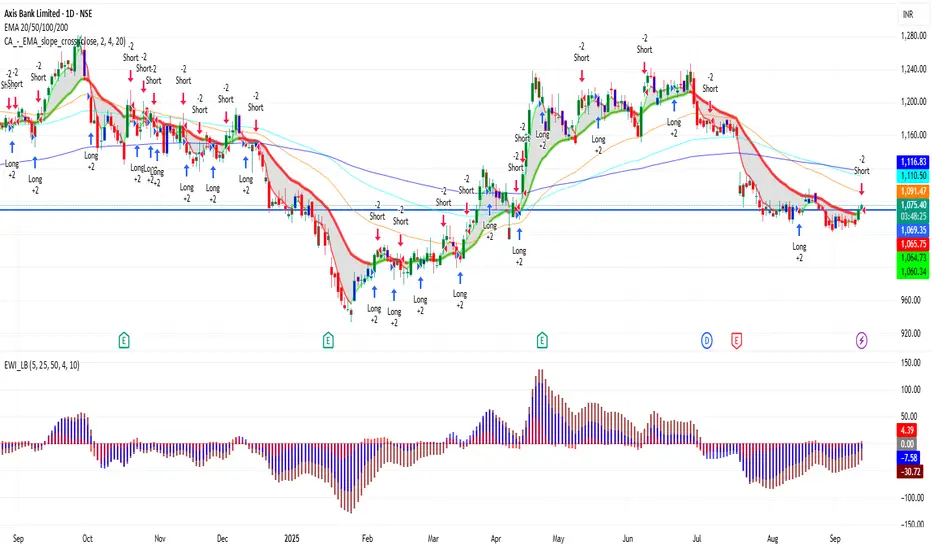
AXISBANK 1D Time frame📊 Current Snapshot
Current Price: ₹1,073.50
Day’s Range: ₹1,069.00 – ₹1,073.20
52-Week Range: ₹934.00 – ₹1,281.75
Previous Close: ₹1,070.10
Opening Price: ₹1,069.00
Market Cap: Approx. ₹3.32 lakh crore
Volume: ~1.65 lakh shares
📈 Trend & Indicators
Trend: Neutral to mildly bullish; trading near 50-day and 200-day moving averages.
RSI (14): 60 – Neutral; no immediate overbought or oversold conditions.
MACD: Positive → indicates bullish momentum.
Moving Averages: Short-term moving averages suggest neutral to slightly bullish outlook.
🔮 Outlook
Bullish Scenario: Break above ₹1,075 with strong volume could target ₹1,090.
Bearish Scenario: Drop below ₹1,065 may lead to further decline toward ₹1,050.
Neutral Scenario: Consolidation between ₹1,065 – ₹1,075; breakout needed for directional move.
📌 Key Factors to Watch
Market Sentiment: Overall market trend and investor behavior.
Economic Indicators: Interest rates, inflation, and RBI policy updates.
Global Cues: Global market trends, US indices, crude oil, and currency movements.
TVSMOTOR 1D Time frameCurrent Snapshot
Last Traded Price: ₹3,495.30
Day’s Range: ₹3,455.50 – ₹3,502.40
52-Week Range: ₹2,171.40 – ₹3,602.70
Market Cap: ₹1.64 lakh crore
Volume: 159,624 shares
VWAP: ₹3,474.60
📈 Trend & Indicators
Trend: Neutral to mildly bullish; trading above 20-day and 50-day EMAs.
RSI (14): Around 68 – approaching overbought territory.
MACD: Positive → indicates bullish momentum.
Moving Averages: Short-term MAs suggest neutral to slightly bullish outlook.
🔮 Outlook
Bullish Scenario: Break above ₹3,502 with strong volume could target ₹3,550.
Bearish Scenario: Drop below ₹3,455 may lead to further decline toward ₹3,400.
Neutral Scenario: Consolidation between ₹3,455 – ₹3,502; breakout needed for directional move.
📌 Key Factors to Watch
Market Sentiment: Broader market moves can impact TVS Motor.
Economic Indicators: Interest rates, fuel prices, and inflation affect automotive stocks.
Company News: Any financial results or strategic announcements can influence price.

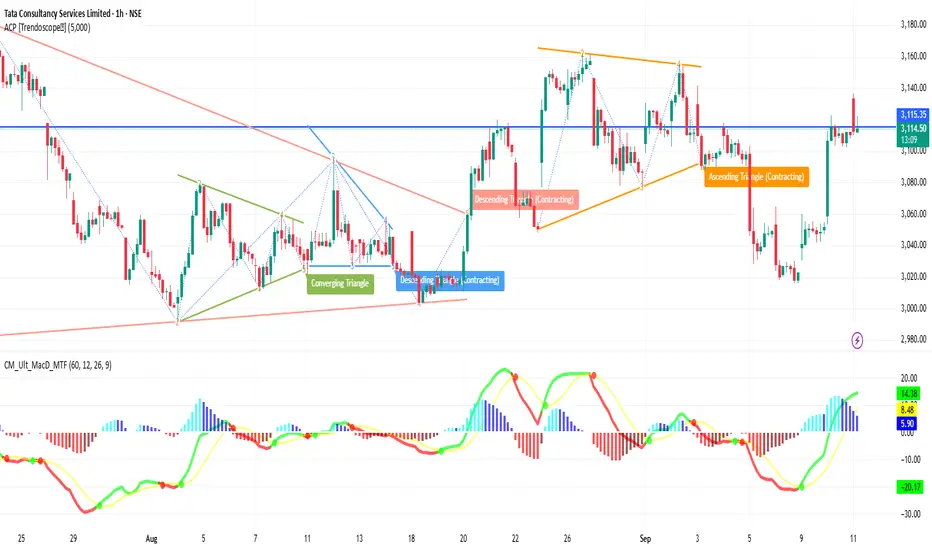
TCS 1H Time frameTCS 1-Hour Snapshot
Price is around ₹3,110
Showing small gains in recent sessions
Has been under pressure from broader IT sector weakness, but holding above some short-term support
🔎 Technical Indicators & Trend
Moving Averages (short-term hourly) are slightly below current price → providing support
Medium-term MAs (50-hour etc.) are above → resistance overhead
RSI (hourly) is moderately neutral—neither strongly overbought nor oversold
Trend strength appears modest; no sharp momentum bars or volume spikes indicating breakout
🔧 Support & Resistance Levels (1H)
Support: ~₹3,080–₹3,090 first support zone
Resistance: ~₹3,130–₹3,140 nearby resistance
🧭 Short-Term Outlook
Bullish Case: A break above ~₹3,130-3,140 with volume could push toward ~₹3,160
Bearish Case: If it fails to break resistance and drops below ~₹3,090, possible move toward ~₹3,060
Overall Bias: Slightly bullish to neutral; waiting for confirmation from resistance breakout
SENSEX 1H Time frameCurrent Snapshot
Sensex Last Price: around 81,425
Intraday High (1H): near 81,580
Intraday Low (1H): around
📈 Trend View (1H)
Above 81,580 → 82,000 = bullish momentum likely.
Below 81,225 → 81,000 = bearish sentiment can increase.
Staying between these = sideways consolidation.
📊 Trend & Bias
Above 81,600–82,000 → bullish breakout, upside momentum likely.
Below 81,000 → bearish pressure, possible drift toward 80,500.
As long as price holds higher lows on 1H candles, trend stays mildly positive.
⚠️ Risk Factors
Sudden global news or domestic policy updates may cause sharp reversals.
If volume is weak during up-moves, breakouts may fail.
Overbought conditions on momentum indicators (RSI/MACD) could slow the rally.
