EURGBP - Weekly Smart Money PlanMarket Context
EURGBP steps into the new week under strong macro influence as markets reprice Bank of England vs ECB rate expectations. Sticky UK inflation, mixed UK data, and growing speculation around ECB rate cuts are driving erratic flows rather than clean directional trends.
This backdrop favors liquidity manipulation — stop hunts, false breakouts, and sharp reactions around key weekly levels — ideal conditions for Smart Money to operate.
Expect volatility around UK CPI, BoE commentary, and Eurozone data, especially near range extremes.
Smart Money Technical Read
Current State: Price remains within a broader bearish HTF structure, despite a strong bullish displacement from recent lows. The rally shows signs of being corrective, reacting into prior premium liquidity rather than initiating a new trend.
Core Bias: Sell premium after confirmation. Buy only at deep discount with structure shift. No chasing price in the middle of the range.
Structure Notes:
• HTF bearish structure remains intact
• Recent upside impulse shows liquidity grab characteristics
• Premium aligns with prior supply & buy-side liquidity
• Discount holds sell-side liquidity + inefficiency (FVG)
• Market currently rotating inside a controlled range
Liquidity Zones & Key Weekly Levels
🔴 SELL EURGBP: 0.87137 – 0.87147
SL: 0.87237
🟢 BUY EURGBP: 0.86541 – 0.86531
SL: 0.86441
🔴 SELL Scenario — Weekly Premium Distribution
Conditions:
✔ Price spikes into 0.8714 area on GBP weakness or EUR strength
✔ Buy-side liquidity taken above recent highs
✔ Bearish CHoCH / MSS on H1–M15
✔ Downside BOS confirms Smart Money intent
✔ Entry refined via bearish OB or FVG
Targets:
• 0.8680 — internal reaction
• 0.8655 — range low liquidity
• 0.8630s — weekly discount expansion
🟢 BUY Scenario — Weekly Discount Accumulation
Conditions:
✔ Sell-side liquidity sweep below 0.8654
✔ Price trades at deep weekly discount
✔ Bullish CHoCH / MSS on LTF
✔ Strong bullish displacement confirms accumulation
✔ Entry from refined bullish OB inside discount
Targets:
• 0.8680 — first reaction
• 0.8710 — internal liquidity
• 0.8730+ — if corrective upside extends
Institutional Playbook
Inducement → Liquidity Sweep → CHoCH / MSS → BOS → Displacement → OB / FVG → Expansion
⚠️ Risk Notes
• Expect fake moves around BoE & ECB headlines
• No structure = no trade
• Reduce size during news volatility
• Let price come to levels — patience pays
Weekly Summary
EURGBP remains a Smart Money range environment this week:
• Sell strength at premium (0.8714)
• Buy weakness only at deep discount (0.8654)
Trade levels, respect structure, and let liquidity reveal intent.
Follow Ryan_TitanTrader for Smart Money gold breakdowns.
GBPUSD

EURUSD - 4H - SHORTFOREXCOM:EURUSD
Hello traders , here is the full multi time frame analysis for this pair, let me know in the comment section below if you have any questions, the entry will be taken only if all rules of the strategies will be satisfied. wait for more Smart Money to develop before taking any position . I suggest you keep this pair on your watchlist and see if the rules of your strategy are satisfied...
Keep trading
Hustle hard
Markets can be Unpredictable, research before trading.
Disclaimer: This trade idea is based on Smart money concept and is for informational purposes only. Trading involves risks; seek professional advice before making any financial decisions. Informational only!!!

GBPUSD – Support Holding, Watching Reaction From RangeGBP/USD has reacted from a well-defined support zone, an area where buyers have stepped in multiple times before. Price is currently trading between clear support and resistance, indicating a short-term range environment.
As long as this support holds, upside reactions toward the resistance zone remain possible. A clean break below support, however, would weaken this structure and change the short-term bias.
This is a reaction-based zone, not a prediction. Let price confirm the next move.
Disclaimer: This analysis is for educational purposes only and does not constitute financial advice. Trading involves risk. Please manage risk responsibly.

GBPUSD – Breakout Retest Looks Healthy, Bulls in ControlGBP/USD has been trading below a falling resistance trendline for quite some time. Recently, price managed to break above this trendline, which is the first sign that selling pressure is weakening.
After the breakout, price did not continue straight up. Instead, it came back for a retest, and that retest is holding well so far. This is usually a healthy sign, showing that buyers are willing to step in at higher levels instead of letting price fall back below structure.
What Price Is Telling Us:
Price is respecting the previous resistance as support and forming higher lows. Sellers are trying, but they are unable to push price back below the trendline. This behavior often appears when the market is preparing for continuation rather than reversal.
As long as price holds above this zone, the bullish bias remains intact, with upside levels marked on the chart. A clean breakdown below the structure would invalidate this view.
This is a structure-based idea, not a prediction. Let price do the work.
If this analysis helped you, like, follow, and comment for more clean Forex breakdowns.
Disclaimer: This analysis is for educational purposes only and does not constitute financial advice. Trading involves risk, and past performance does not guarantee future results. Please manage risk responsibly.

GBPUSD SHOWING A GOOD DOWN MOVE WITH 1:8 RISK REWARDGBPUSD SHOWING A GOOD DOWN MOVE WITH 1:8 RISK REWARD
DUE TO THESE REASON
A. its following a rectangle pattern that stocked the market
which preventing the market to move any one direction now it trying to break the strong resistant lable
B. after the break of this rectangle it will boost the market potential for break
C. also its resisting from a strong neckline the neckline also got weeker ald the price is ready to break in the outer region
all of these reason are indicating the same thing its ready for breakout BREAKOUT trading are follws good risk reward
please dont use more than one percentage of your capitalfollow risk reward and tradeing rules
that will help you to to become a bettertrader
thank you

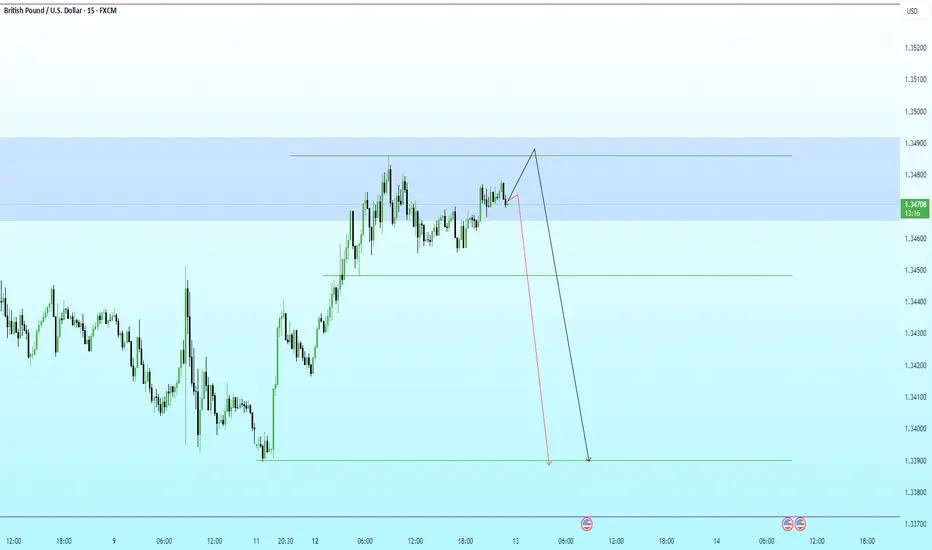
GBPUSD · 15M · SMC OutlookPrice is trading deep into premium, pressing against a well-defined HTF supply zone.
HTF Framework
Clear bullish leg already completed.
Buy-side liquidity resting above recent highs.
Premium zone aligns with prior distribution and weak highs.
LTF Structure
Momentum is slowing near the highs.
Price is consolidating under resistance, hinting at distribution.
Minor pullbacks are being absorbed, classic liquidity buildup behavior.
Expectation
A final push higher to sweep buy-side liquidity.
Reaction from supply after the sweep.
Strong bearish displacement targeting:
Internal range low
Prior demand imbalance
HTF discount zone below
Execution Plan
Avoid longs in premium.
Wait for:
Liquidity sweep above highs
Bearish displacement
LTF MSS for confirmation
Shorts favored post-confirmation.
Partial profits at range low, runners into discount.
GBPUSD broke level of 1.34820As you can see GBPUSD broke level of 1.34820 and massive fall already happened so I give you next expected move.
Plan your trade accordingly.

GBP/USD Signals Trend Shift – Impulsive Upside ExpectedThe chart shows that GBP/USD has completed a full W–X–Y corrective pattern, with the final wave (y) and its C wave forming a clean bottom near the long-term support line. From that low, price has started a strong upward move, which looks like the beginning of a new impulsive Wave 1. The current pullback toward the 0.382–0.618 Fibonacci zone is typical behavior for a Wave 2 retracement before the next strong rally. As long as the price stays above the invalidation level at 1.30094 (the wave (y) bottom), the bullish scenario remains valid. This suggests that GBP/USD is preparing for a larger Wave 3 push to the upside.
Stay tuned!
@Money_Dictators
Thank you :)

In about an hour, UK Retail Sales data will be releasedIn about an hour, UK Retail Sales data will be released.
We’ve analyzed every report since 2022 to build this insight-packed dashboard showing how GBPUSD typically reacts within 4 hours after the print:
📊 Historical Breakdown (32 events total):
🔹 Bullish trend: 46.9% → 15 events
🔸 Bearish trend: 53.1% → 17 events
📉 Average bearish move: -30.35 pips
📈 Average bullish move: +22.13 pips
No crystal ball — just statistics and probabilities.

This One GBP Option Has 4 Red Flags — All Pointing UpA new GBP put option at 1.27 on the March futures contract entered the CME market quietly — and the price reacted almost immediately, starting to move in that direction.
👉 That’s Signal #1: Price is respecting the flow.
But it gets more interesting:
Signal #2: The position was built very rapidly — over a tight time window.
Fast accumulation like this often signals "big money" action.
Signal #3: The size is just over $1 million — not "epic", but definitely material for GBP options.
Worth watching.
Now check the CME heatmap for this option series — and you’ll see:
This level of volume inflow hasn’t occurred in over a month.
👉 That’s Signal #4: Unusual option activity. Fresh positioning. Aka institutional footprint.
📌 Bottom line:
We’re not jumping in — we’re watching for acceptable R/R short setup.
But when four signals align like this, you don’t ignore them.

GBP/USD (1-hour) chart...GBP/USD (1-hour) chart:
Price is moving within a descending channel, and currently testing the upper boundary of that channel.
The Ichimoku cloud above the price suggests a bearish bias, as price remains below the cloud.
There’s a projected leg down (green arrow) marked on my chart — pointing toward the lower channel line.
🎯 Likely Target Zone
If the move respects the current channel and the upper rejection holds:
Short-term downside target: around 1.2910–1.2920, aligning with the lower channel trendline and my marked “target point.”
Intermediate resistance: near 1.3040–1.3060 (top of the cloud / channel upper edge).
Summary:
📉 Sell bias below 1.3040
🎯 Target: 1.2910–1.2920
❌ Invalidation: If price breaks above 1.3070 with strong candles (then potential reversal).

GBP/USD Correction Almost Done: Bulls LoadingGBP/USD has already completed a big corrective structure from the previous high and is now moving inside a complex W-X-Y pattern. The current drop is forming the final C-wave of Wave Y, which suggests the bearish move is close to finishing. Price is likely to dip slightly lower near the support zone before finding buyers again. Once this final leg completes, the chart expects a strong bullish reversal to the upside. In simple terms, one more small drop to finish the correction, then GBP/USD should bounce and start a new uptrend.
Stay tuned!
@Money_Dictators
Thank you :)

GBP/USD – 1H Chart...✅ Clear Technical Target Zones (GBP/USD – 1H Chart)
Target Price Zone Why it matters
TP1 1.3420 – 1.3440 Nearest major resistance + previous structure level + matches my first marked target
TP2 1.3485 – 1.3500 Next resistance zone + matches my upper target line + psychological round number
---
⚠ Levels to Watch Below (Support)
Support Zone Why
1.3325 – 1.3340 Kumo (cloud) support + breakout retest zone
If price falls back into the cloud, momentum could weaken. If it stays above the breakout, bullish continuation remains valid toward TP2.
---
Quick Plan (Based on the chart only)
✅ If price pushes above 1.3420 → TP2 becomes more likely
⚠ If price rejects at 1.3420 → retracement is likely first
---
If you want, I can help my refine: ✅ Stop-loss zone
✅ Risk-to-reward
✅ Confirmation signals (Ichimoku + price action combo)

GBPUSD - 15M (IDEA)FOREXCOM:GBPUSD
Hello traders , here is the full multi time frame analysis for this pair, let me know in the comment section below if you have any questions, the entry will be taken only if all rules of the strategies will be satisfied. wait for more Smart Money to develop before taking any position . I suggest you keep this pair on your watchlist and see if the rules of your strategy are satisfied...
Keep trading
Hustle hard
Markets can be Unpredictable, research before trading.
Disclaimer: This trade idea is based on Smart money concept and is for informational purposes only. Trading involves risks; seek professional advice before making any financial decisions. Informational only!!!

GBPUSD – Medium-Term H1/H4 Technical Outlook
Overview: GBPUSD has recently broken below its ascending trendline/channel after failing to sustain momentum near the 1.3530–1.3575 supply zone. At present, price is testing the 0.618 retracement (~1.3366), while the RSI (5) is heavily oversold (~13–14). This signals the possibility of a short-term bounce before the broader bearish bias resumes.
For Indian traders who follow GBPUSD closely, the focus should remain on selling rallies into resistance while being open to buying intraday dips at clearly defined liquidity levels.
Market Structure & Key Observations
Trendline Break: The bullish channel has been violated, shifting momentum to a “sell-the-rally” strategy.
Resistance Zones: 1.3537 and 1.3453–1.3428 (strong supply levels).
Support Zones: Initial support at 1.3366 (Fib 0.618) and 1.3319; major demand lies at 1.3143–1.3093.
Momentum Check: Deep oversold RSI could trigger corrective recoveries, making intraday scalps attractive.
Trading Plan
Sell the Rally – Primary Bias
Entry: 1.3500 – 1.3510
Stop Loss: 1.3550
Take Profit: 1.3480 – 1.3466 – 1.3445 – 1.3430
📌 Idea: Short entries on retest of broken structure. Only invalid if we see a 4H close above 1.3550.
Buy the Dip – Intraday Scalping
Entry: 1.3310 – 1.3330
Stop Loss: 1.3290
Take Profit: 1.3355 – 1.3368 – 1.3390 – 1.3410
📌 Idea: Quick long trades from liquidity near 1.3319, targeting minor resistance.
Buy Deeper Liquidity Sweep – Swing Setup
Entry: 1.3090 – 1.3110
Stop Loss: 1.3050
Take Profit: 1.3135 – 1.3160 – 1.3200 – 1.3240
📌 Idea: If the market flushes into the 1.3143–1.3093 demand zone, expect stronger bounce potential.
Risk Management & Invalidation
Above 1.3550 (4H close) → Bearish bias invalidated.
Strong breakdown below 1.3310 → Skip scalps, focus on deeper buy zones.
Partial profit booking at each target is recommended to protect capital.

You going to lossI need daily candle close on the black Box.. then I am looking for sell if I get my entry signals

GBPUSD(20250911)Today's AnalysisMarket News:
The U.S. PPI annual rate for August hit 2.6%, the lowest since June. Traders are increasing bets on a Federal Reserve rate cut.
Technical Analysis:
Today's buy/sell levels:
1.3533
Support and resistance levels:
1.3584
1.3565
1.3553
1.3514
1.3502
1.3483
Trading Strategy:
If the price breaks above 1.3553, consider entering a buy position, with the first target price being 1.3565.
If the price breaks below 1.3533, consider entering a sell position, with the first target price being 1.3514

GBPUSD(20250910)Today's AnalysisMarket News:
US employment data was significantly revised downward, with the number of jobs for the 12 months ending March revised down by 911,000.
Technical Analysis:
Today's Buy/Sell Levels:
1.3544
Support and Resistance Levels:
1.3616
1.3589
1.3572
1.3516
1.3499
1.3472
Trading Strategy:
On a breakout above 1.3544, consider a buy entry with the first target at 1.3572.
On a breakout below 1.3516, consider a sell entry with the first target at 1.3499

GBPUSD(20250909)Today's AnalysisMarket News:
New York Fed Survey: Consumers expect unemployment and job losses to rise, and the Fed is expected to cut interest rates next week.
Technical Analysis:
Today's Buy/Sell Levels:
1.3526
Support and Resistance Levels:
1.3601
1.3573
1.3555
1.3498
1.3480
1.3452
Trading Strategy:
If the price breaks above 1.3555, consider buying, with the first target price at 1.3573.
If the price breaks below 1.3526, consider selling, with the first target price at 1.3498

this is Gbpusd Chart this is way of Analysis of London session THis Is GBPUSD Chart
Analysis of the Chart Way
Open the MArket of Before london Session And marke the Amrket Key Lavels

GBP/USD Rising Wedge Breakdown PotentialThe GBP/USD 30-minute chart shows price moving within an ascending trendline but recently stalling near resistance around 1.3550–1.3560. The Ichimoku cloud suggests weakening bullish momentum, with price struggling to sustain above the support line.
Bearish Setup: A breakdown below the ascending trendline and cloud support around 1.3500 could trigger stronger downside pressure.
Targets: If selling momentum continues, price may test the 1.3420 and 1.3395 support levels.
Stop Loss: A safe invalidation zone lies above 1.3550–1.3560, where further upside would invalidate the bearish scenario.
🔎 Overall, GBP/USD looks vulnerable to a short-term pullback unless it reclaims strong bullish momentum above 1.3550.

GBPUSD(20250905)Today's AnalysisMarket News:
The US August "Non-Farm Payrolls" report came in at 54,000, below the expected 65,000. The previous figure was revised up from 104,000 to 106,000. Initial jobless claims rose unexpectedly to 237,000 last week, the highest level since June.
Technical Analysis:
Today's Buy/Sell Levels:
1.3435
Support and Resistance Levels:
1.3477
1.3462
1.3451
1.3419
1.3408
1.3392
Trading Strategy:
On a breakout above 1.3435, consider a buy entry, with the first target at 1.3451.
On a breakout below 1.3419, consider a sell entry, with the first target at 1.3408.

GBPUSD(20250904)Today's AnalysisMarket News:
① Waller: I believe we should cut interest rates at the next meeting. Multiple rate cuts are possible in the future, but the exact pace depends on the data.
② Musallem: Current interest rates are appropriate, but there are risks in the job market.
③ Bostic: Concerned about inflation, I still believe one rate cut this year is appropriate.
④ The Federal Reserve will hold a payments innovation conference on October 21st, which will discuss stablecoins, artificial intelligence, and tokenization.
⑤ Fed Governor nominee Milan: If confirmed, I will maintain the independence of the FOMC.
⑥ Kashkari: There is room for a modest rate cut.
⑦ The Federal Reserve Beige Book: Economic activity is roughly flat, with businesses and households feeling the impact of tariffs.
Technical Analysis:
Today's Bullish/Bearish Divide:
1.3411
Support and Resistance Levels:
1.3535
1.3488
1.3458
1.3363
1.3333
1.3287
Trading Strategy:
If the price breaks above 1.3458, consider entering a buy position, with the first target price at 1.3488.
If the price breaks below 1.3411, consider entering a sell position, with the first target price at 1.3363
