GBPUSD - FACES RESISTANCE AS BEARISH SIGNALS EMERGESymbol - GBPUSD
CMP - 1.3525
GBPUSD has been rallying amid a weakening US dollar but is now encountering strong resistance and showing signs of a false breakout suggesting a potential corrective phase ahead.
The pair is currently testing a key resistance zone within a distribution phase, with a double top pattern forming on the higher timeframe - a classic bearish reversal signal. Despite the broader bullish structure, the failure to sustain gains above key resistance 1.3600 and ongoing consolidation below 1.3545 point to weakening momentum.
Additionally, the US dollar has reached support levels and may begin to recover, adding further downward pressure on GBPUSD.
Resistance levels: 1.3548, 1.3570, 1.3600
Support levels: 1.3512, 1.3455
If the pair cannot hold above 1.3565 during this retest, a deeper pullback is likely, potentially offering short opportunities. The correction could extend toward the 1.3450–1.3365 & may test 1.3300 support range before any continuation of the broader uptrend.
Gbpusdforecast

GBPUSD - BULLS NEED TO EXERCISE CAUTION - NEWS AHEADSymbol - GBPUSD
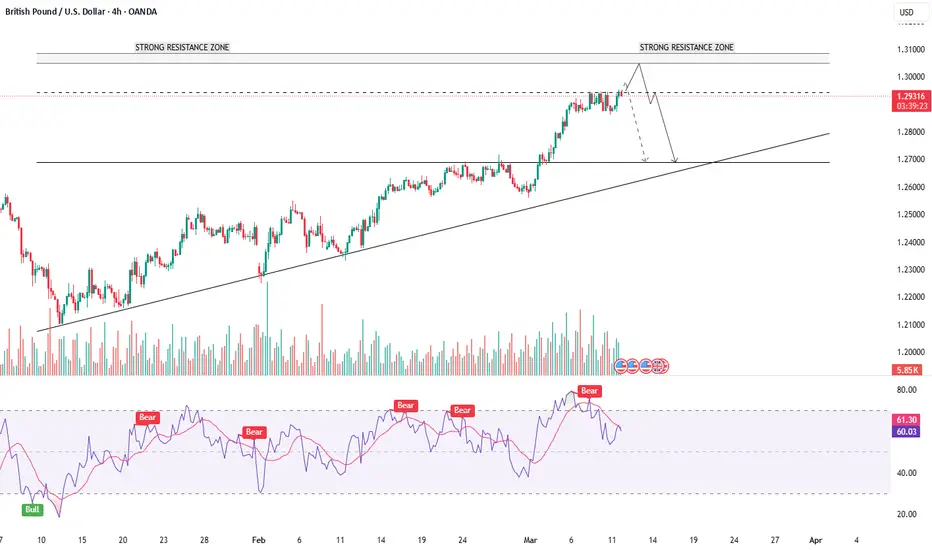
CMP - 1.2937
The GBPUSD pair has shown impressive bullish strength recently, continuing its upward move against the US dollar. This strength can be attributed to aggressive sell-off of the US dollar, which has created a favorable environment for the British pound. The pair is currently trading in a critical zone, with consolidation at the 1.2920 - 1.2940 levels, making it a pivotal point for future price action.
From a technical standpoint, I previously shared my analysis when GBPUSD was trading around the 1.2460 levels, identifying a strong breakout, and I'm pleased to report that all the targets I set have been reached.
However, the current situation remains complex, with crucial economic data due to be released shortly. US JOLTs job openings data is expected later today, followed by CPI data tomorrow. These releases will have a significant impact on the US dollar, which in turn will influence GBPUSD. Given that the US dollar index (DXY) is trading at oversold levels, if the upcoming data comes more than forecast, we could see a strong rebound in the US dollar, potentially pushing GBPUSD lower. However, if the data comes lower than expected reading, it could trigger another corrective move in the DXY & an up move in GBPUSD. Despite this, I believe such a move would be a false breakdown in DXY, with the US dollar likely to recover and strengthen in the medium term.
In the event of weaker than forecast data, the GBPUSD pair could see a push towards the 1.3050-1.3080 levels. These levels represent strong resistance zones, where the pair is likely to encounter selling pressure. Should GBPUSD reach these levels, a reversal back towards lower levels is highly probable.
Key Support Levels: 1.2920, 1.2900
Key Resistance Levels: 1.2950, 1.3000, 1.3060
As key support for the pair is at 1.2920-1.2900, and a strong break below these levels could signal a potential shift in trend. On the other hand, resistance levels lie around 1.2950. If the bulls manage to push past these levels, we may see further price growth till 1.3050-1.3080. However, bulls should exercise caution at current levels. Any reversal could occur sooner than expected, given the prevailing market conditions and upcoming economic data releases.
In conclusion, the fate of GBPUSD heavily depends on the upcoming US economic data. Traders should closely monitor the JOLTs and CPI data, as these will likely dictate the next move for the pair.
GBPUSD - TREND REVERSAL?Symbol - GBPUSD
GBPUSD is attempting to capitalize on a potential trend reversal amid the ongoing correction of the U.S. dollar. The price is currently testing a key resistance level within a consolidation phase, indicating a possible breakout. On the daily timeframe, the price remains above the previously breached trendline, with the effort to surpass the resistance providing insights into market sentiment. A continued correction in the dollar could benefit the British pound, particularly if the U.S. Dollar Index breaks below 107 and moves toward the 106-105 range.
From a technical perspective, attention is centered on the 1.257 level, which acts as a crucial resistance threshold. A sustained break and consolidation above this level may trigger a rally.
Resistance levels: 1.2575, 1.2718
Support levels: 1.250, 1.2377
I do not rule out the possibility of a retest of the 1.250 support level to accumulate liquidity before further upward movement. The dollar is expected to continue its correction following remarks from Trump and Powell regarding potential rate cuts.

GBPUSD Inverse head and shoulder patternFX:GBPUSD
Hi All, here you can see that, GBPUSD has created a Inverse head and shoulder pattern in 1D Time Frame. so we can go for long and pull back entries.

GBPUSD - BULLISH MOMENTUM TO CONTINUESymbol - GBPUSD
The GBPUSD pair has been showing strong bullish momentum, particularly after the reversal from the mid-January low and the recent rise back to 1.2500 The price action suggests potential for further upside, with 1.2700 emerging as the next key resistance level. Buying the dips remains the most favorable strategy in this context.
Currently, the price is attempting a local trend reversal. It has breached the resistance of the descending price channel and is consolidating above this level, within the buying zone. The underlying fundamental conditions, however, remain complex and unstable, influenced significantly by President Trump's policies and the ongoing tariff disputes with various countries. Sudden, sharp statements continue to have a notable impact on market sentiment.
Technically, the price is breaking through the resistance of a prolonged downtrend, offering an opportunity for a shift in the local trend. A breakout above the resistance at 1.2490, followed by consolidation above this level, could encourage further bullish momentum.
Key resistance levels: 1.2490, 1.2600, 1.2750
Key support levels: 1.2415, 1.2380
The price may test the previously broken channel resistance before continuing its upward movement. However, the 1.2490 level remains crucial. Should the bulls maintain support above this area, the currency pair may experience a short-term rally.

#GBPUSD Present At Good Area For SellOnce the #GBPUSD closes below 1.2480 on the hourly chart, keep an eye for a retest of this level. If there's rejection on the retest on the M5/M15 timeframe, consider initiating a sell position with a 30-pip stop loss and a target of 70 pips down to 1.2400. There's substantial trendline liquidity beneath these levels.

GBPUSDFX:GBPUSD
As you can see that, GBPUSD has formed a good support zone and it is in down trend. If it gives breakout then we can plan for sell side and take retest entry. Plan your trade accordingly. This trade is for monday (25-09-2023).....

GBPUSDFX:GBPUSD
As you can see that, GBPUSD has created a trendline good resistance, If it gives breakout then we can plan for buy side and take retest entry. Plan your trade accordingly....

GBPUSDFX:GBPUSD
As you can see that, GBPUSD has created a head & shoulder pattern in 1D Time frame. If it gives breakout then we can plan for sell side. This set-up is for monday (04-09-2023) Plan your trade accordingly...

GBPUSDFX:GBPUSD
As you can see that, GBPUSD has created a trendline support in 4Hr Time frame, If it gives breakout then we can plan for sell side. It is for monday (31-07-23) Plan your trade accordingly...

FOMC Minutes in the Charts: EUR/USD & GBP/USD FOMC Minutes in the Charts: EUR/USD & GBP/USD
During their June meeting, minutes released on Wednesday indicated that almost all Federal Reserve officials expect further tightening in the future. Despite the majority's belief in upcoming rate hikes, policymakers chose not to increase rates due to concerns about over-tightening. They acknowledged the delayed impact of previous policies and other factors, which led them to skip the June meeting after implementing ten consecutive rate increases.
Out of the 18 participants, all but two anticipated at least one rate hike to be appropriate within this year, while twelve members expected two or more hikes.
The prevailing consensus that the US central bank will raise borrowing costs by 25 basis points at the end of the July policy meeting has lent some strength to the US Dollar and exerted downward pressure on the GBP/USD and EUR/USD. The DXY (US Dollar Index) surged above 103.30, reaching its highest level of the week.
EUR/USD further declined to the 1.0850 region. The outlook for the Euro has turned negative as the EUR/USD pair dropped below the 20-day simple moving average (SMA).
If the GBP/USD pair falls below 1.2700 and confirms that level as resistance, the next potential bearish targets could be 1.2680, 1.2658, 1.2647 according to fib retracement levels and previously pivot points.

Resistance at 1.267: Key Level to Watch After BoE Rate Decision
The UK continues to struggle with high inflation, as demonstrated once again this morning when headline inflation exceeded expectations at 8.7%, surpassing the projected 8.4%. Core inflation also outperformed, registering a 7.1% figure compared to the expected 6.8%. This divergence emphasizes the contrast between the UK and its counterparts in the US and Europe.
Tomorrow, the Bank of England is set to announce its interest rate decision, and there are expectations of further tightening from the central bank. Given the elevated level of inflation, the bank may have little choice but to maintain a hawkish stance.
Last week, the GBPUSD initially tested the support level at the previous resistance of 1.250. However, that brief decline was followed by four consecutive days of significant gains, ultimately reaching a new high for the year.
There was a temporary resistance encountered at a critical level of 1.267. Following tomorrow's rate decision, this level could potentially act as a support area, particularly considering the slight pullback observed in recent days and the elevated RSI (Relative Strength Index).
On the other side of the trade, we have Federal Reserve Chair Jerome Powell's comments on the central bank's ongoing battle against inflation falling short of the market's more hawkish expectations.
During his testimony to lawmakers, Powell acknowledged that inflation remains significantly above the Fed's target and indicated that raising rates could still be a sensible course of action, albeit at a more moderate pace. Traders particularly took note of the term "moderate," which Powell used to qualify the potential rate increases. We still have one more day of testimony from Powell.

GBPUSD SHORT 1:3 TRADEGBPUSD breaks their support
trend is downward
200EMA us Above the price
1:3 beast trade

GBPUSD Analysis wait for Retest and Candlestick Pattern TriangleGBPUSD Analysis wait for Retest and Candlestick Pattern Triangle

GBPUSD CAPITALCOM:GBPUSD
As you can see in GBPUSD pair is in consolidation since Dec 22 (long time ) and now it is near to the resistance, if it rejects the resistance level and come down then we can plan for sell side with the conformation of pull back entries. Plan your trade accordingly.... (4 HR time frame)

GBPUSD FX:GBPUSD
As you can see gbpusd is in forming bullish ascending channel or higher highs and it can go up to the channel resistance, Take pull back entries. plan your trade accordingly...

#GBPUSD Uptrend Movement With rish:reward=3.5#trading stratergy
#GBPUSD Uptrend Movemet
time frame 3 hours.
breakout from parallel channel.
Buy at 1.20718, Target 1.22331, SL 1.20257
HOPE our analysis is adding value to your site trading Journey.
If yes, Hit like button or boost our ideas. Thank you.
NOTE: Published Ideas are for ‘’EDUCATIONAL PURPOSE ONLY’’ trade at your own risk.
NOTE: RESPECT The risk. SL should not be more than 2% of the capital.
Happy Trading

GBPUSD FX:GBPUSD
GBPUSD is at good level that is 1.20470 is an important resistance level if it breaks the resistance and sustaining then we can plan for buying opportunities.

GBPUSD ShortTime Frame: 4H
Symbol: GBPUSD
Entry: 1.15383
TP: 1.13668
SL: 1.16592
Bias: Short
For this pair our bias is short and we think the projection will be activated as we have projected the price levels .

GBPUSD ShortTime Frame: 4H
Symbol: GBPUSD
Entry: 1.15002
TP: 1.12606
SL: 1.16577
Bias: Short
The current price pattern of this instrument is showing a positive tendency towards selling opportunity.

GBPUSD ShortTime Frame: 4H
Symbol: GBPUSD
Entry: 1.17891
TP: 1.16574
SL: 1.19305
Bias: Short
The obvious trend for this instrument is short and we are looking for a selling opportunity.

GBPUSD H4Wait for breakout of range trade after retest and confirmation. If we don't get breakout so we will ignore this setup.

GBPUSD | Good Sell opportunityIf you find this technical analysis useful, please like & share our ideas with the community.
What do you think is more likely to happen? Please share your thoughts in comment section. And also give a thumbs up if you find this idea helpful. Any feedback & suggestions would help in further improving the analysis.
Good Luck!
Disclaimer!
This post does not provide financial advice. It is for educational purposes only! You can use the information from the post to make your own trading plan for the market. But you must do your own research and use it as the priority. Trading is risky, and it is not suitable for everyone. Only you can be responsible for your trading.
