Good Risk/Reward

#canfinhomes trade idea kindly see the details and levels on the chart
this can be good trade for this month and can give 12% return
this is not a trade recommendation
below you can check the link I have recommended it at 510 level for target of 570 and it has achieved the target within 1 month

RSI Divergence on Daily time frame - NYKAAThere is positive RSI divergence on daily time frame.
*FOR EDUCATIONAL PURPOSE ONLY*

A clear BULLISH view on BIRLASOFTHEY GUYS,
BIRLASOFT stock was following a pattern
i.e FALLING WEDGE PATTERN
now , this stock has crossed that pattern
and it is showing clear BULLISH SIGNS.
as you can see, a 12% increase in a single week and volume is also very high,
this shows that people are really interested in this stock.
Therefore, you can also trade in this stock and earn high returns.
you can clearly see the pattern in the chart
i have marked that pattern with the trend lines.
thanks and have a great trade.

#nal trade idea kindly see the levels marked on the chart and see the logic behind the trade
this is only for educational purpose

Motherson- Add in chunks nowBuy in chunks around 123-128, keep SL 120 on closing basis.
Target 135,140,145.
*Note-Only for educational purpose.

UcalFuel- breakout done.Keep an eyeKeep in watching list, SL@ 119 closing basis.
Entry point between 126-133, but wait for confirmation on hourly breakout. One can add around 20% in current price to avoid FOMO.
Target- 165, 185, 200.
*Note- Only for educational purpose.

APLAPOLLO after breaking the previous highs APLAPOLLO looks good at this price. Gave a strong closing above the resistance zone, so, we can expect a good upside move. We can also consider this as a Double Top breakout, Go long with strict stop-loss for the given targets.

ADANI WILMAR is again , ready to give high returns hey guys ,
from a long time , we are seeing that ADANI COMPANIES ARE GIVING GREAT RETURNS,
in this group of companies , there is a stock called ADANI WILMAR ,
this stock was giving a great returns , JUST AFTER LISTING
this stock has gave a return of APPROX 250% RETURN in just 73 DAYS ,
but after a short period of time ,
this stock has started to follow a pattern called , DESCENDING TRIANGLE .
and now the time has come to BREAK THIS PATTERN ,
and now you can see that , THIS STOCK HAS CROSSED ITS RESISTANCE
and has made GREAT BIG GREEN CANDLE ,
you can see that , stock has taken support on its resistance and now gave a great green candle ,
therefore , I SUGGEST YOU THAT YOU CAN BET ON THIS STOCK AND TRY TO EARN GREAT RETURNS ,
I have marked the STOP LOSS AND TARGET ,
STOP LOSS - 567.60
TARGET - 768.70
BUT PLS CONSIDER THE GLOBAL MARKET SITUATIONS
1. INFLATION
2. WAR
3. RISING BANK RATES
4. INCREASING CRUDE OIL PRICES
AFTER CONSIDERING THESE SITUATIONS
YOU CAN BUY THIS STOCK
ADANI WILMAR - AWL
FUNDAMENTALLY ALSO , THIS COMPANY IS WELL ESTABLISHED .
THEREFORE , YOU CAN BET ON THIS STOCK

HIGH PROBABILITY TRADE SET-UP IN HIMADRI SPECIALITYStock is trading in a zone near the all-time high price, which will most probably be going to act as a supply zone. Also stock has rallied almost 55-60% in one month and we can expect a price correction of 25%. In addition, these RSI values have given a clear divergence. So I'm expecting a fall in price in the coming days. Enter trade if the price closes below 81 with an SL at 86.5 and targets are mentioned on the chart. This is just my observation. Do your own analysis before making any financial decision.
NSE:HSCL

MAHINDRA CIE Channel BreakoutIn the daily time frame of Mahindra CIE, It seems like there is a breakout in W Pattern with good volume. Even in 15mins timeframe stock looks very bullish. I have mentioned Probable target and SL on the chart. please do your own analysis before making any financial decisions. NSE:MAHINDCIE

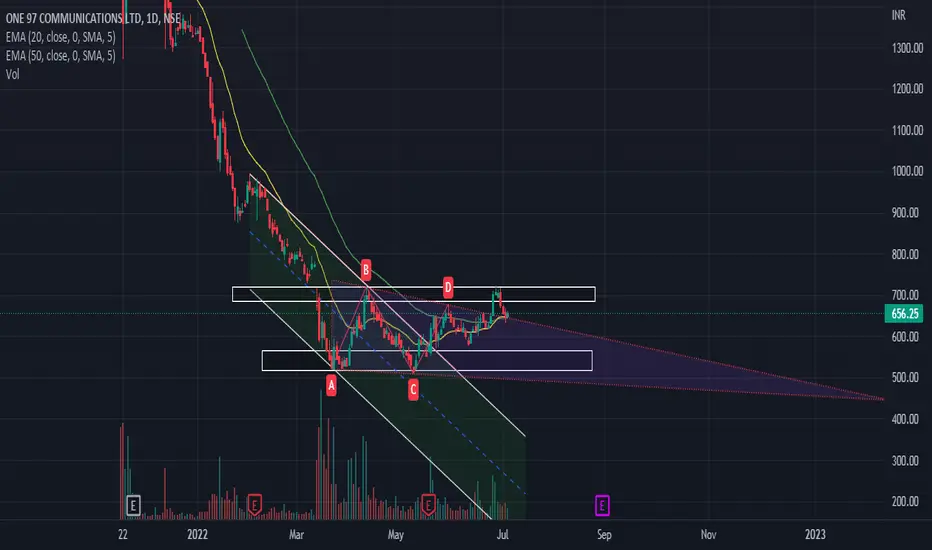
PAYTM has retested and showing bullish signshey guys ,
after a long DOWNTREND ,
PAYTM stock has shown a signs of recovery ,
from the very FIRST DAY , this stock was completely controlled by bears
but now , this stock was following a chart pattern called FALLING WEDGE
last week , this stock was trying to cross this pattern
ans it was SUCCESSFULLY COMPLETED .
And now this stock has retested
and it has shown a great green candle ,
which convince us to bet on this stock
and earn HIGH RETURNS
BUT FIRST CONSIDER THE GLOBAL SITUATIONS
.INFLATION
. WAR BETWEEN UKRAINE AND RUSSIA
. RISING BANK RATES
. AND INCREASING EXPORT DUTIES
AFTER CONSIDERING THESE SITUATIONS
YOU CAN BUY THIS STOCK
BUT PLS GUYS , SEE THAT IF MARKET IS OPENING GAP DOWN
THAT THIS STOCK IS UNDER HIS RESISTANCE AREA
THEN PLS WAIT AND LET THIS STOCK TRY TO CROSS HIS RESISTANCE AREA
and guys , if u like my analysis
. follow
. like
. and comment

GODREJPROP - Head and should patternAll details are given on chart with clear explanation.
1. Godrej Properties was in the downtrend since Nov 2021 with LH and LL pattern.
2. Last LL was not taken out by following candles and formed Head and Shoulder pattern in the bottom which indicates trend reversal
3. Breakout happened but with not much impressive volume
4. Chart pattern looks very good and attractive
5. Overall Real Estate sector is in positive
Disc - Am not a SEBI registered. This post is only for educational purpose and do your own analyses before taking any position.

Ramcocem formed inverted h&S patternIf 1hr candle closes above 1005 with volume then buy stop loss given in chart @975
Profit Strategy trading and training institute jaysingpur.
contact no. 8956337959
this view is for educational purpose only.

enj next move, use stop loss.enj next move, use stop loss, best time to big profit lets make some money.......use stoploss, god luck.

enj next move, use stop loss.enj next move, use stop loss, good points for this, buy in parts and sell in 2 parts. good day

Mid term callBuy CAMS on CMP for target 4100 CAMS shows good Q2 result and also announced divident stock change the trend currently in uptrend

BEL (Medium Term Study)Bharat Electronics Ltd.
Chart Pattern:
- Rounding Bottom Pattern Breakout
- Price consolidating after breakout
- Price at ATH
- Price once came below the previous ATH levels, but didn't sustain even a day. Previous ATH levels now act as strong support for the price.
- Price closed yesterday at ATH after crossing the previous swing high.
Relative Strength:
- Stock outperforming Nifty50 & its sector in 1w, 1m, 3m, 6m, 1y & 2y timeframe.
- Stock is RS+ & RS in inclined upwards.
- From the latest ARS date, the stock has outperformed the index by more than 20%
- Stock's RS History is good. In previous years, whenever stock turned RS+ it gave good returns.
Financial Performance:
- Q2 witnessed Sales growth of 123% QoQ & 15% YoY
- PBT growth stood at 4489% QoQ & 48% YoY
- EPS growth stood at 2460% QoQ & 56% YoY
- The Q2 numbers are not a turnaround. Since the company is a PSU and are manufacturers of defense items, therefore their quarterly results are cyclical in nature.
- Company's Order book as of Q2 FY21 stands at 52,148 Cr with a fresh order inflow of 1,561 Cr. These orders are for the next 4 FYs.
- As per DuPont 5 stage model. Cos. ROE is 19.2% Avg.
- Company has zero debts as of last FY and their Net block and investments are increasing YoY along with the sales & net profits.
At CMP, the stock price is around 15% away from the base of the last consolidation, so it's not overextended; it could offer a good RR in the long run. Being a PSU, this stock might be a slow grower, but it surely will be a grower. Worth keeping on a watchlist and studying thoroughly

VECHAIN TARGETSvechain target for inr trades lets take small profit go an buy on line touch. geta small two parts profit.

bitcoin supply and demand area. falling or rise bitcoin supply and demand area. falling or rise 80% chance to fall and 20% chance to rise. so make sure.

Good Long Opportunitystop loss and target levels are mentioned in the chart . sl is on eod closing basis . follow position sizing and proper risk management .
a good flag and pole breakout happening in suppetro . but more important than any chart pattern u can see that this stock is continuously following 50 ema from 2020 lows and has rallied to these levels by taking support everytime on 50 EMA . FOR the first time it closed below 50 ema but now it has again given breakout of 50 ema and as well as retested it and also retested the trendline so now we can hope for a good upmove making new highs in recent future .
Volume also seems to be increasing after a good consolidation in tight range .

Bajaj Electric: Recovering after 20 days of continuous pullback.Hello Traders,
I would want to see Bajaj Electric to continue upmove and then taking a small pullback would be a buy signal for me.
Thus I would not enter right away if BajajElectric moves upwards.
My trade setup wouldbe as follows:-
Stock: Bajaj Electric, Swing Trade Cash Segment.
Entry: 1277-1288
Target: 1549
SL: 1210
Risk Reward- 3:1
Happy Trading!
