Crude buy neae 5150 sell near 5425 both work done desc is hereParameter Data Data
Asset Name Crude Oil WTI Futures (MCX)
Price Movement 🟥 Minor Bearish/Rangebound (₹5,179 / -1.2% from Prev. Close)
Current Trade 🟨 WAIT/RANGE TRADE (Sell near R1, Buy near S1)
SMC Structure 🟨 Neutral/Consolidation (Price compressing within a tight range)
Trap/Liquidity Zones 🟥 Supply/Trap Zone above ₹5,303 (Trendline Resistance)
Probability 🟨 50% (for consolidation continuation)
Risk Reward 1 : 1.5
Confidence 🟨 Medium (Trend is unclear until range breaks)
Max Pain 🟨 N/A (Weekend/Futures Data)
DEMA Levels 🟨 Neutral/Mixed (Price below 21-DEMA & 50-DEMA, but holding multi-week low)
Supports 🟩 S1: ₹5,140 (Crucial Near-term Support), 🟩 S2: ₹5,010 (Major Structural Demand)
Resistances 🟥 R1: ₹5,227 (Immediate Pivot), 🟥 R2: ₹5,303 (Strong Trendline Resistance), 🟥 R3: ₹5,433 (Upper Range)
ADX/RSI/DMI 🟨 RSI Neutral (Near 45) / ADX Weak Trend (Below 20)
Market Depth 🟨 Neutral (Balanced order flow within the range)
Volatility 🟨 Moderate-to-Low (Volatility compressed due to range-bound movement)
Source Ledger 🟩 Official MCX Feeds & Global Supply/Inventory Reports (Prioritizing official data and fundamental drivers)
OI 🟨 Neutral (OI \sim11,710 contracts with small change - FILLED_OI)
PCR 🟥 Bearish Skew (PCR 0.53 on 16 Dec Options suggests more Call writing/shorting)
VWAP 🟨 Neutral (Price trading near the average/mid-point of the range - FILLED_VWAP)
Turnover 🟩 High (Volume \sim21,529 lots, confirming activity)
Harmonic Pattern 🟨 N/A (No clear or active major pattern detected)
IV/RV 🟨 Moderate IV (Implied Volatility is compressed, suggesting a breakout is likely)
Options Skew 🟥 Bearish Bias (Put-side activity strong near S1, supporting the lower bound)
Vanna/Charm 🟨 Neutral (Gamma/Vanna pressure is focused on the range extremes)
Block Trades 🟨 Mixed (Both buying and selling blocks observed at range extremes)
COT Positioning 🟩 Bullish (Global WTI data suggests net long speculative buying, but domestic is weaker)
Cross-Asset Correlation 🟨 Neutral/Weak (Less correlation currently than Gold/Silver)
ETF Rotation 🟨 Neutral (Inflows/outflows are balanced at this price level)
Sentiment Index 🟨 45 (Neutral/Caution)
OFI 🟨 Neutral (Balanced buy/sell flow)
VWAP Bands 🟨 Price Testing Middle Band (Confirmation of consolidation)
Market Phase 🟨 Consolidation/Compression (Pre-Breakout phase)
Harmonic Patterns

NG buy given but avoid suggested on comment when not sustain Parameter Data Data
Asset Name Natural Gas Futures (MCX)
Price Movement 🟥 Strong Bearish (₹371.1 / -2.62% from Prev. Close of ₹381.1)
Current Trade 🟥 SELL ON RALLIES (Short-term bearish trend confirmed)
SMC Structure 🟥 Bearish Order Flow (Breaking key support, potential Sell-side Liquidity Run)
Trap/Liquidity Zones 🟩 Demand/Liquidity Zone at ₹365 - ₹358 (Target for current move)
Probability 🟥 65% (for continued downside to test major support)
Risk Reward 1 : 1.5
Confidence 🟨 Medium-High (Clear technical trend and fundamental pressure)
Max Pain 🟨 N/A (Weekend/Futures Data)
DEMA Levels 🟥 Bearish (Price trading below all short-term EMAs/DMAs)
Supports 🟩 S1: ₹369.1 (Day's Low/Immediate Pivot), 🟩 S2: ₹365 (Psychological/Key Liquidity Target), 🟩 S3: ₹345 (Next Structural Support)
Resistances 🟥 R1: ₹381.1 (Previous Close/Immediate Supply), 🟥 R2: ₹385.6 (Day's High/Strong Resistance)
ADX/RSI/DMI 🟥 RSI Bearish (Near 32.90) / ADX Trending (21 - Trend developing)
Market Depth 🟥 Bearish Skew (Sell-side pressure dominating the order book)
Volatility 🟥 High (ATR is elevated, high price fluctuation)
Source Ledger 🟩 Official MCX Feeds & US/Global Storage Data (Citing official data and fundamental drivers)
OI 🟥 Bearish (OI \sim21,038 contracts, suggesting short build-up - FILLED_OI)
PCR 🟨 N/A (Data not readily available for weekend - FILLED_PCR)
VWAP 🟥 Bearish (Price trading well below VWAP - FILLED_VWAP)
Turnover 🟩 High (Confirms high volume during the strong selling move)
Harmonic Pattern 🟨 N/A (Strong Impulse Move/No pattern detected)
IV/RV 🟩 High IV (Reflecting high expected future volatility due to weather risk)
Options Skew 🟥 Bearish Bias (Puts are relatively more expensive than Calls)
Vanna/Charm 🟨 Neutral (No major flow-driven pressure detected)
Block Trades 🟥 Significant SELL Blocks (Indicating aggressive institutional shorting)
COT Positioning 🟨 Neutral-to-Bearish (Speculators maintaining a short or reduced net-long position)
Cross-Asset Correlation 🟨 Neutral (Currently decoupled from Crude Oil and Gold)
ETF Rotation 🟥 Outflows (Capital moving away from Natural Gas ETFs)
Sentiment Index 🟥 40 (Fear/Caution) (Pulling back from previous euphoria)
OFI 🟥 Negative (Sustained net selling flow)
VWAP Bands 🟥 Price Testing Lower Band (Confirmation of strong bearish momentum)
Rotation Metrics 🟥 Lagging (Underperforming the energy complex)
Market Phase 🟥 Liquidation/Sell-off (Aggressive downside trend)

Copper profit booking recommended now holding buy 1092 T -1120Parameter Data Data
Asset Name Copper Futures (MCX)
Price Movement 🟥 Correction/Minor Bearish (₹1,098.00 / -1.25% from Prev. Close)
Current Trade 🟩 BUY ON DIPS (Accumulate near Support 1)
SMC Structure 🟩 Strong Bullish Order Flow (Consolidation/Pullback Phase)
Trap/Liquidity Zones 🟩 Demand/Liquidity Zone at ₹1,060 - ₹1,073 (Accumulation zone)
Probability 🟩 70% (for trend continuation after consolidation)
Risk Reward 1 : 1.5
Confidence 🟩 High (Strong fundamental long-term thesis)
Max Pain 🟨 N/A (Weekend/Futures Data)
DEMA Levels 🟩 Bullish (Price above 20, 50, and 100-DEMA)
Supports 🟩 S1: ₹1,073 (Immediate Pivot), 🟩 S2: ₹1,060 (Key Accumulation Zone), 🟩 S3: ₹1,032.90 (20-DEMA)
Resistances 🟥 R1: ₹1,114.00 (Recent High), 🟥 R2: ₹1,125 (Psychological/Projection), 🟥 R3: ₹1,155 (Uptrend Target)
ADX/RSI/DMI 🟥 RSI Overbought (Near 80, cooling) / ADX Strong Trend
Market Depth 🟩 Bullish Skew (Dip-buying expected to dominate Monday's open)
Volatility 🟥 High (Elevated ATR due to sharp rallies and pullbacks)
Source Ledger 🟩 Official MCX/LME Feeds & Supply Deficit (Prioritizing official data and citing fundamentals)
OI 🟨 Neutral/Mixed (Open Interest \sim7,347 contracts with minor change - FILLED_OI)
PCR 🟨 N/A (Data not readily available for weekend - FILLED_PCR)
VWAP 🟩 Bullish (Price testing VWAP from above - FILLED_VWAP)
Turnover 🟩 High (Volume \sim25,528 lots confirms participation)
Harmonic Pattern 🟨 N/A (Strong Impulse Move/Breakout Phase)
IV/RV 🟩 High IV (Reflecting high expected future volatility)
Options Skew 🟩 Positive Skew (Call side premium higher, reflecting upside bias)
Vanna/Charm 🟨 Neutral (No major gamma/charm pressure observed)
Block Trades 🟩 Significant BUY Blocks (Suggesting long-term accumulation)
COT Positioning 🟩 Net Long Aggression (Hedge funds increasing long bets)
Cross-Asset Correlation 🟩 Inverse with USD Index (USD weakness supports Copper)
ETF Rotation 🟩 Continued Inflows (Global Copper ETFs seeing accumulation)
Sentiment Index 🟥 75 (Greed/Euphoria)
OFI 🟨 Neutralizing (Short-term selling pressure on Friday's close)
VWAP Bands 🟨 Price Testing Middle Band (Correction after trading near the upper band)
Market Phase 🟨 Correction/Consolidation (Phase after Expansion)

Silver profit booking recommended on previous update,now buy dipParameter Data Data
Asset Name Silver Futures (MCX)
Price Movement 🟥 Strong Correction/Liquidation (₹1,92,851 / Est. -3.06% from Prev. Close of ₹1,98,942)
Current Trade 🟨 BUY ON DEEP DIPS (Monitor Reversal at ₹1,92,000 pivot)
SMC Structure 🟩 Bullish Order Flow (Deep Pullback/Liquidation Phase)
Trap/Liquidity Zones 🟩 Demand/Liquidity Zone at ₹1,92,000 - ₹1,89,800 (Key buying zone)
Probability 🟨 60% (for rebound towards ₹1,96,000 from current levels)
Risk Reward 1 : 1.5
Confidence 🟨 Medium (High short-term volatility/deep retracement)
Max Pain 🟨 N/A (Weekend/Futures Data)
DEMA Levels 🟩 Bullish (Price testing 20-DEMA zone from above)
Supports 🟩 S1: ₹1,91,000 (Immediate Pivot/Current Zone), 🟩 S2: ₹1,89,800 (Strong Demand), 🟩 S3: ₹1,84,500 (Crucial Structural Support)
Resistances 🟥 R1: ₹1,96,600 (Immediate Supply/Pivot), 🟥 R2: ₹2,00,362 (All-Time High)
ADX/RSI/DMI 🟨 ADX Strong Trend (38.5) / RSI Neutralizing (Moving toward 50)
Market Depth 🟨 Neutralizing (Selling pressure dominant in the short term)
Volatility 🟥 Extreme High (ATR is elevated due to sharp drop)
Source Ledger 🟩 Industrial Demand/Weak Rupee (Core fundamental drivers)
OI 🟩 Bullish (Based on latest available closing data - FILLED_OI)
PCR 🟨 N/A (Data not readily available for weekend - FILLED_PCR)
VWAP 🟨 Neutral/Testing VWAP (Deep price drop suggests breach of VWAP - FILLED_VWAP)
Turnover 🟩 Very High (Confirms liquidation/high volume during the move)
Harmonic Pattern 🟨 N/A (Strong Impulse Wave - patterns not applicable)
IV/RV 🟩 Very High IV (Reflecting high expected volatility)
Options Skew 🟩 Positive Skew (Implied Volatility higher for Call options - Upside bias)
Vanna/Charm 🟨 Neutral (No major flow-driven pressure detected)
Block Trades 🟨 Mixed (Aggressive selling blocks observed during the drop)
COT Positioning 🟩 Net Long Aggression (Speculative positions remain bullish)
Cross-Asset Correlation 🟩 Favorable Domestic Setup (Strong Inverse DXY / Positive USDINR)
ETF Rotation 🟩 Continued Inflows (Long-term accumulation persists)
Sentiment Index 🟨 65 (Greed - Pulling back from Extreme Euphoria)
OFI 🟨 Neutralizing (Short-term selling pressure dominates current flow)
VWAP Bands 🟥 Price Testing Lower Band (Deep correction phase)
Rotation Metrics 🟩 Leading/Alpha Generating (Outperforming the base metal index)
Market Phase 🟨 Correction/Liquidation (Temporary phase after Expansion)

Gold mcx profit booking recommended again start buy on dipParameter Data Data
Asset Name Gold Futures (MCX)
Price Movement 🟩 Strong Bullish (₹1,32,469 / +2.06% from Prev. Close)
Current Trade 🟩 BUY ON DIPS/Maintain Long (Target ₹1,34,000)
SMC Structure 🟩 Bullish Order Flow (Higher Highs/Higher Lows - Strong trend continuation)
Trap/Liquidity Zones 🟥 Potential Trap Zone above ₹1,33,300 (Profit-taking trigger)
Probability 🟩 75% (for consolidation followed by an upside attempt)
Risk Reward 1 : 1.5
Confidence 🟩 High (Strong global and domestic confluence)
Max Pain 🟨 N/A (Weekend/Futures Data)
DEMA Levels 🟩 Extreme Bullish (Price well above all key EMAs)
Supports 🟩 S1: ₹1,31,660 (Immediate Pivot), 🟩 S2: ₹1,31,000 (Psychological/Key Base)
Resistances 🟥 R1: ₹1,33,300 (Immediate Resistance), 🟥 R2: ₹1,34,000 (All-Time High Target)
ADX/RSI/DMI 🟥 RSI Overbought (72.7) / ADX Strong Trend (40)
Market Depth 🟩 Bullish Skew (Strong buy-side interest dominating depth)
Volatility 🟥 High (Elevated range due to sharp price moves)
Source Ledger 🟩 Global Gold Price + USD/INR Weakness (Dual bullish factor)
OI 🟩 Bullish (OI \sim13,717 contracts with small % change - FILLED_OI)
PCR 🟨 N/A (Data not readily available for weekend - FILLED_PCR)
VWAP 🟩 Bullish (Price trading well above rising VWAP - FILLED_VWAP)
Turnover 🟩 High (Confirms strong institutional participation)
Harmonic Pattern 🟨 N/A (Impulse move/no major pattern detected)
IV/RV 🟩 High IV (Reflecting high expected volatility)
Options Skew 🟩 Positive Skew (Call side premium higher, indicating upside bias)
Vanna/Charm 🟨 Neutral (No major gamma or charm pressure observed)
Block Trades 🟩 Significant BUY Blocks (Aggressive institutional positioning)
COT Positioning 🟩 Net Long Aggression (Mirroring international bullish sentiment)
Cross-Asset Correlation 🟩 Strong Inverse with DXY & Positive with USDINR (Ideal setup for MCX)
ETF Rotation 🟩 Domestic Gold ETF Inflows (Retail and HNIs accumulating)
Sentiment Index 🟥 80 (Extreme Greed)
OFI 🟩 Positive (Sustained buying flow)
Delta 🟩 Positive Skew (Call Delta is high at nearby strikes)
VWAP Bands 🟩 Price Trading Near Upper Band (Strong momentum/overextension)
Rotation Metrics 🟩 Leading/Alpha Generating (Outperforming other domestic commodities)
Market Phase 🟩 Expansion/Parabolic Move (Aggressive trend continuation)

Silver profit booking given now again buy on dip near 61.70 $Parameter Data Data
Asset Name Silver Futures (SI)
Price Movement 🟥 Strong Bearish/Correction ($62.01 / -2.41% from last close)
Current Trade 🟨 CONSOLIDATE/BUY ON DIPS (Monitor support at $61.00)
SMC Structure 🟩 Aggressive Bullish Order Flow (In Pullback Phase)
Trap/Liquidity Zones 🟥 Liquidity Trap Zone above **$64.74** (Recent High - Stop-run/Profit-taking)
Probability 🟩 65% (for rebound/consolidation above $61.00)
Risk Reward 1 : 1.5
Confidence 🟨 Medium-High (High volatility due to profit-taking)
Max Pain 🟨 N/A (Weekend/Futures Data)
DEMA Levels 🟩 Bullish (Price still above 20-DEMA/50-DEMA)
Supports 🟩 S1: $61.00 (Immediate Pivot/Consolidation Low), 🟩 S2: $60.00 (Psychological/Breakout Zone)
Resistances 🟥 R1: $63.60 (Friday’s High/Supply), 🟥 R2: $64.74 (All-Time High)
ADX/RSI/DMI 🟩 ADX Strong Trend (32.0) / RSI Neutralizing (52.55 - Cooling off overbought)
Market Depth 🟨 Neutralizing (Buy-side pressure easing on the correction)
Volatility 🟥 Extreme High (Daily trading range remains very wide)
Source Ledger 🟩 Industrial Demand/Supply Deficit (Primary long-term driver)
OI 🟩 Bullish (Open Interest high at \sim108.72K contracts - FILLED_OI)
PCR 🟨 N/A (Data not readily available for weekend - FILLED_PCR)
VWAP 🟩 Bullish (Price testing VWAP from above - FILLED_VWAP)
Turnover 🟩 High (Confirms liquidation/volume during the correction)
Harmonic Pattern 🟨 N/A (Strong Impulse Wave - patterns not applicable)
IV/RV 🟩 Very High IV / Positive Skew (Upside protection remains expensive)
Options Skew 🟩 Positive Skew (Implied Volatility higher for Call options)
Vanna/Charm 🟨 Neutral (No significant flow-driven pressure detected)
Block Trades 🟨 Mixed (Both buying/selling blocks detected at recent highs/lows)
COT Positioning 🟩 Record Net Long (Speculative positions remain highly bullish - 33.2K FILLED_COT)
Cross-Asset Correlation 🟩 Strong Positive with Gold (Both precious metals in sync)
ETF Rotation 🟩 Continued Inflows (Long-term capital accumulating despite price dip)
Sentiment Index 🟥 78 (Euphoria/Greed - Pulling back from Extreme)
OFI 🟨 Neutralizing (Short-term selling pressure on Friday)
VWAP Bands 🟨 Price Testing Middle Band (Corrective phase entry)
Rotation Metrics 🟩 Leading/Alpha Generating (Outperforming the general commodity index)
Market Phase 🟨 Correction/Liquidation (Temporary phase after Expansion)

Gold hope everyone booked profit before Friday fall buy dip nowParameter Data Data
Asset Name Gold Futures (GC)
Price Movement 🟩 Strong Bullish ($4,330.35 / +0.35% from last close)
Current Trade 🟩 BUY ON DIPS/Breakout (Awaiting new high confirmation)
SMC Structure 🟩 Bullish Order Flow (Higher Highs/Higher Lows - Market in Expansion Phase)
Trap/Liquidity Zones 🟥 Liquidity Zone above $4,380 (Potential Trap for late buyers)
Probability 🟩 70% (for continued upside after minor consolidation)
Risk Reward 1 : 1.5
Confidence 🟩 High (Strong confluence of fundamental and technical factors)
Max Pain 🟨 N/A (Weekend/Futures Data)
DEMA Levels 🟩 Extreme Bullish (Price significantly above 20-DEMA/50-DEMA)
Supports 🟩 S1: $4,295 (Immediate Pivot), 🟩 S2: $4,250 (Psychological/Swing Low)
Resistances 🟥 R1: $4,387 (All-Time High/Supply Zone), 🟥 R2: $4,500 (Psychological Target)
ADX/RSI/DMI 🟩 ADX Strong Trend (43.5) / RSI Strong Bullish (53.53 - Away from Overbought)
Market Depth 🟩 Bullish Skew (Strong Buy-side pressure evident in Order Book)
Volatility 🟥 High (ATR is elevated, high implied volatility)
Source Ledger 🟩 Institutional Flow/Fed Outlook (Primary source of momentum)
OI 🟩 Bullish (Open Interest high at \sim323.94K contracts - FILLED_OI)
PCR 🟨 N/A (Data not readily available for weekend - FILLED_PCR)
VWAP 🟩 Bullish (Price above a rising VWAP - FILLED_VWAP)
Turnover 🟩 Very High (Confirms strong institutional participation)
Harmonic Pattern 🟨 N/A (Strong Impulse Wave - patterns not applicable)
IV/RV 🟩 High IV / Steep Positive Skew (Extreme Call premium)
Options Skew 🟩 Extreme Positive Skew (Reflecting urgent upside demand)
Vanna/Charm 🟨 Neutral (No significant flow-driven pressure detected)
Block Trades 🟩 Significant BUY Blocks (Suggesting aggressive institutional positioning)
COT Positioning 🟩 Net Long Aggression (Managed Money increasing net long position)
Cross-Asset Correlation 🟩 Strong Inverse (Continued USD weakness supports Gold)
ETF Rotation 🟩 Massive Inflows (Aggressive capital injection into Gold ETFs)
Sentiment Index 🟥 85 (Extreme Greed/Euphoria)
OFI 🟩 Positive (Sustained buying interest)
Delta 🟩 Positive Skew (Strong Call side Delta)
VWAP Bands 🟩 Price Trading Above Upper Band (Strong momentum phase)
Rotation Metrics 🟩 Leading/Alpha Generating (Outperforming the commodity complex)
Market Phase 🟩 Expansion/Bullish Parabolic (Price is trending aggressively)

GILLETE BAT 0.8 revGILLETE BAT 0.8 rev on order block which make more pull up, consolidate and order block cover happen by that 0.8 zoon

NIFTY- Intraday Levels - 15th December 2025If NIFTY sustain above 26058/70/88 above this bullish then around 26109 strong level above more bullish above this wait more levels marked on chart
If NIFTY sustain below 26034 below this bearish then 25991/85/71 below this more bearish then 25949/38 strong level and last hope 25889/84/63 day closing below this will be considered bearish , below this wait more levels marked on chart
My view :-
"My viewpoint, offered purely for analytical consideration, The trading thesis is: Nifty (bearish tactical approach: sell on rise)
16th dec Expiry is expected to be buy on dip probably last chance to exit long position for this month.
This analysis is highly speculative and is not guaranteed to be accurate; therefore, the implementation of stringent risk controls is non-negotiable for mitigating trade risk."
Consider some buffer points in above levels.
Please do your due diligence before trading or investment.
**Disclaimer -
I am not a SEBI registered analyst or advisor. I does not represent or endorse the accuracy or reliability of any information, conversation, or content. Stock trading is inherently risky and the users agree to assume complete and full responsibility for the outcomes of all trading decisions that they make, including but not limited to loss of capital. None of these communications should be construed as an offer to buy or sell securities, nor advice to do so. The users understands and acknowledges that there is a very high risk involved in trading securities. By using this information, the user agrees that use of this information is entirely at their own risk.
Thank you.

Part 2 Candle Stick Patterns Greeks in Options
Option Greeks measure the sensitivity of options to various factors.
a. Delta
Measures change in premium when underlying moves.
b. Gamma
Measures change in delta.
c. Theta
Measures time decay—how quickly premium reduces.
d. Vega
Measures impact of volatility.
e. Rho
Measures impact of interest rate changes.
Beginners primarily track Delta and Theta.

Nifty bullish movement in 1 hour time frameit looks like up trend may be continue, the reversal trend take support at retracement level of 0.618 to major trend and 1.618 to minor trend
and this show that up trend may continue,look bullish

Part 2 Support and ResistanceImportant Option Trading Terms
a. In-The-Money (ITM)
Options with intrinsic value.
b. At-The-Money (ATM)
Strike price near the current market price.
c. Out-of-The-Money (OTM)
Options with no intrinsic value—cheaper but riskier.
d. Expiry
Last trading day of the option contract.
India has:
Weekly expiry (Index)
Monthly expiry (Stocks & Index)
e. Lot Size
You trade options in a fixed quantity called lot size.

Candle Patterns Candle Patterns and Volume Profile
Volume profile defines where most trading activity occurs.
Key zones:
VAL (Value Area Low) → Strong buy zone
VAH (Value Area High) → Strong sell zone
POC (Point of Control) → Strong rejection or acceptance
High Volume Node (HVN) → Reversal zones
Low Volume Node (LVN) → Breakout zones
Combine candle patterns:
Example setups:
Bullish Engulfing at VAL
Shooting Star at VAH
Pin Bar at LVN breakout
Inside Bar at HVN compression
This combination gives professional-level accuracy.

Premium Chart Patterns Rules for Trading Chart Patterns
Wait for confirmation
Don’t assume a breakout. Always wait for a close beyond the breakout level.
Use volume confirmation
High volume strengthens signals.
Trade only strong patterns
Avoid weak, uneven, unclear structures.
Always check market trend
Pattern reliability increases in the direction of trend.
Use stop-loss
Set SL below support (bullish) or above resistance (bearish).
Measure target using pattern height
Many patterns provide measurable targets.
Combine with indicators
RSI, EMA, MACD improve accuracy.

Part 12 Trading Master Class Buyers vs Sellers
Every option contract has two sides:
Option Buyer
Pays a premium.
Has limited risk (only premium loss).
Has unlimited profit potential.
Needs significant price movement to make money.
Option Seller/Writer
Receives the premium.
Has limited profit (premium received).
Has high or unlimited risk.
Benefits when price stays stable or moves slightly.
Most professional traders prefer selling options because time works in their favour.

Part 11 Trading Master Class Types of Options
There are two basic types:
a) Call Option (CE)
A Call Option gives the right to buy the underlying at a fixed strike price.
Traders buy calls when they expect the price to go up.
Example: Nifty trading at 22,000 → You buy 22,200 CE expecting upside.
b) Put Option (PE)
A Put Option gives the right to sell at a fixed strike price.
Traders buy puts when they expect the price to fall.
Example: Nifty trading at 22,000 → You buy 21,800 PE expecting downside.

Introduction to Derivatives and Options1. Derivatives Trading Strategies
Derivatives can be traded using a variety of strategies depending on market expectations, risk tolerance, and investment objectives.
A. Hedging Strategies
Hedging is a risk management technique used to protect against adverse price movements in the underlying asset.
Futures Hedging:
A trader holding a physical asset (like wheat, crude oil, or shares) can hedge by taking a futures position in the opposite direction. For example, a farmer expecting to sell wheat in three months can sell wheat futures now to lock in the price, reducing the risk of price decline.
Portfolio Hedging with Index Futures:
Institutional investors can hedge against market-wide risk using index futures. For instance, holding a portfolio of Nifty 50 stocks, an investor may sell Nifty futures to protect against a market downturn.
Interest Rate Hedging with Swaps:
Companies with floating-rate loans may use interest rate swaps to exchange variable payments for fixed payments, thus reducing exposure to interest rate fluctuations.
B. Speculative Strategies
Speculators use derivatives to profit from price movements in underlying assets without necessarily owning them.
Long and Short Futures:
Traders can go long (buy) if they expect prices to rise or short (sell) if they expect prices to fall. For example, a trader anticipating a rise in crude oil prices buys crude futures to benefit from price appreciation.
Spread Trading:
Spread strategies involve taking offsetting positions in related derivatives to profit from relative price movements. Common spreads include:
Calendar spreads: Buying a long-dated contract while selling a short-dated contract.
Inter-commodity spreads: Trading price differences between related commodities, like gold vs. silver.
Leverage and Margin Trading:
Derivatives often allow high leverage, enabling traders to control large positions with smaller capital. While leverage increases profit potential, it also amplifies risk.
C. Arbitrage Strategies
Arbitrage exploits price inefficiencies between markets or instruments to earn risk-free or low-risk profits.
Cash-and-Carry Arbitrage:
Traders buy the underlying asset and sell futures simultaneously if futures are overpriced relative to spot prices.
Index Arbitrage:
Exploits differences between index futures and the actual underlying stocks in the index.
Inter-market Arbitrage:
Identifying price discrepancies across different exchanges for the same asset.
2. Option Trading Strategies
Options trading strategies can be divided into basic strategies for beginners and advanced strategies for professional traders.
A. Basic Option Strategies
Long Call:
Buy a call option expecting the underlying asset to rise.
Risk: Limited to premium paid.
Reward: Unlimited potential profit.
Long Put:
Buy a put option expecting the underlying asset to fall.
Risk: Limited to premium paid.
Reward: Gains increase as the asset price declines.
Covered Call:
Holding the underlying stock and selling a call option on it.
Objective: Earn premium income while holding the stock.
Risk: Stock may rise above strike price; profit is capped.
Protective Put:
Buy a put option while holding the underlying asset.
Objective: Insure against a price drop.
Cost: Premium paid for the put.
B. Advanced Option Strategies
Spreads
Spreads involve buying and selling options of the same type (calls or puts) with different strike prices or expirations to limit risk and optimize returns.
Bull Call Spread:
Buy a call at a lower strike and sell a call at a higher strike.
Profitable if the underlying price rises moderately.
Lower cost than a simple long call.
Bear Put Spread:
Buy a put at a higher strike and sell a put at a lower strike.
Profitable if the underlying price falls moderately.
Calendar Spread:
Buy a long-term option and sell a short-term option at the same strike.
Profits from time decay differences.
Straddles and Strangles
These are volatility strategies designed to profit from significant price movements, regardless of direction.
Straddle:
Buy both a call and put at the same strike price.
Profitable if the asset moves sharply up or down.
Strangle:
Buy a call and put with different strike prices.
Cheaper than straddle but requires larger price movement for profit.
Butterfly and Condor Spreads
Butterfly Spread: Combines buying and selling multiple options to profit from minimal price movement.
Iron Condor: Uses both call and put spreads to generate income in low-volatility markets.
Synthetic Positions
Synthetic Long Stock: Buy a call and sell a put at the same strike.
Synthetic Short Stock: Sell a call and buy a put.
Purpose: Mimics stock positions using options, often at lower capital outlay.
3. Risk Management in Derivatives and Options Trading
Risk management is crucial in derivatives trading due to leverage and market volatility.
Stop Loss Orders: Automate exits to limit losses.
Position Sizing: Control exposure relative to capital.
Hedging: Use options or futures to reduce risk on existing positions.
Volatility Assessment: Traders must evaluate implied volatility for option pricing and strategy selection.
4. Practical Applications
Institutional Investors: Use derivatives for hedging portfolios, managing interest rate risk, and currency exposure.
Retail Traders: Utilize options strategies for speculative bets, income generation, and hedging personal investments.
Corporate Usage: Companies hedge commodity prices, interest rates, and foreign currency exposure to stabilize cash flows.
Conclusion
Derivatives and options trading strategies offer a wide array of tools for hedging, speculation, arbitrage, and income generation. While derivatives provide leverage and flexibility, options add non-linear payoff structures that can be tailored for risk and return preferences.
Understanding each strategy, market conditions, and risk-reward dynamics is critical for successful trading. Beginners should start with basic strategies and limited exposure, while advanced traders can explore complex spreads and volatility trades to maximize returns and manage risk effectively.

Investing in Shares: A Comprehensive Overview1. Understanding Shares
Shares, also called stocks or equities, are financial instruments that represent ownership in a corporation. Each share entitles the holder to a fraction of the company's profits, typically distributed as dividends, and gives them voting rights in certain corporate decisions, depending on the type of share held. Shares are issued by companies to raise capital for business expansion, research, or debt repayment. In return, investors hope to earn returns through price appreciation and dividends.
There are two primary types of shares:
Common Shares: These represent ordinary ownership. Shareholders have voting rights and may receive dividends, but they are last in line to claim company assets in case of liquidation.
Preferred Shares: These provide a fixed dividend and have a higher claim on assets than common shares. However, preferred shareholders usually lack voting rights.
2. Why Invest in Shares
Investing in shares can offer several benefits:
Potential for Capital Growth: Shares have the potential to appreciate in value over time, allowing investors to sell them at a higher price than the purchase price.
Dividend Income: Companies often distribute a portion of profits as dividends, providing a steady income stream.
Ownership in a Company: Shareholders have a stake in the company, including the right to vote on major corporate matters.
Hedge Against Inflation: Historically, equities have outperformed inflation, helping preserve the purchasing power of money.
Liquidity: Shares traded on stock exchanges can be bought and sold easily, offering high liquidity compared to other investments like real estate.
3. How Share Prices Are Determined
The price of a share is influenced by a combination of factors:
Company Performance: Profits, revenue growth, and business strategies directly impact investor perception and share price.
Market Sentiment: Investors’ collective emotions, confidence, and speculation can drive prices up or down.
Economic Indicators: Interest rates, inflation, and GDP growth affect share valuations.
Industry Trends: Changes in technology, consumer preferences, and competition influence sector performance.
Global Events: Political instability, trade wars, and global economic conditions can significantly impact share prices.
4. Methods of Investing in Shares
There are different ways to invest in shares, depending on risk tolerance, knowledge, and financial goals:
Direct Investment: Purchasing shares of individual companies through stock exchanges using a brokerage account. Investors need to research companies, analyze financials, and monitor market trends.
Mutual Funds: Equity mutual funds pool money from multiple investors to invest in a diversified portfolio of shares. This reduces risk compared to investing in a single stock.
Exchange-Traded Funds (ETFs): ETFs track the performance of an index or sector and can be traded like individual shares. They offer diversification and low cost.
Dividend Reinvestment Plans (DRIPs): Investors reinvest dividends to purchase more shares, enabling compounding growth over time.
Systematic Investment Plans (SIPs): Investing fixed amounts periodically in equity mutual funds to benefit from rupee cost averaging.
5. Analyzing Shares
Before investing, it is crucial to analyze shares using two main approaches:
Fundamental Analysis: This involves evaluating a company’s financial statements, revenue growth, profit margins, debt levels, management quality, and industry position. Key metrics include Price-to-Earnings (P/E) ratio, Earnings Per Share (EPS), Return on Equity (ROE), and dividend yield. Fundamental analysis helps investors determine a company’s intrinsic value and decide whether the stock is overvalued or undervalued.
Technical Analysis: This focuses on historical price movements, trading volumes, and chart patterns to predict future price trends. Tools like moving averages, support and resistance levels, and momentum indicators are commonly used by traders. Technical analysis is particularly popular for short-term trading strategies.
6. Risk and Reward in Share Investing
Investing in shares involves a trade-off between risk and reward:
Market Risk: Stock prices can fluctuate due to overall market movements or economic conditions.
Company-Specific Risk: Poor management, product failures, or regulatory issues can negatively impact a company’s stock.
Liquidity Risk: Some stocks may be difficult to sell quickly without affecting the price.
Volatility: Share prices can experience rapid ups and downs, especially in emerging markets or high-growth sectors.
Mitigating Risk: Diversification, long-term investment horizons, and informed decision-making reduce risk exposure.
The potential for high returns is higher than traditional investments like fixed deposits or bonds, but so is the risk. Historical data suggests that equities outperform most asset classes over long periods, making them suitable for wealth creation.
7. Strategies for Share Investing
Successful investors adopt strategies based on goals and risk appetite:
Buy and Hold: Investors purchase quality stocks and hold them long-term to benefit from compounding and price appreciation.
Value Investing: Investing in undervalued stocks based on fundamental analysis, a strategy popularized by Warren Buffett.
Growth Investing: Focusing on companies with high growth potential, even if they appear expensive, expecting significant capital appreciation.
Dividend Investing: Prioritizing shares with consistent and high dividend payouts for stable income.
Swing Trading: Short- to medium-term trading based on technical patterns to profit from price fluctuations.
Index Investing: Investing in market indices via ETFs or index funds to replicate overall market performance with minimal effort.
8. The Role of Psychology in Share Investing
Behavioral finance highlights that emotions influence investment decisions. Common psychological pitfalls include:
Herd Mentality: Following the crowd without independent analysis.
Overconfidence: Overestimating one's knowledge or market predictions.
Fear and Greed: Emotional reactions during market volatility can lead to panic selling or excessive risk-taking.
Loss Aversion: Reluctance to sell underperforming stocks, which can magnify losses.
Successful investors maintain discipline, set clear investment goals, and stick to their strategy regardless of short-term market noise.
9. Taxation and Regulatory Considerations
Investing in shares is subject to taxation and regulatory compliance:
Capital Gains Tax: Profits from selling shares may attract short-term or long-term capital gains tax depending on the holding period.
Dividend Distribution Tax: Dividends received are taxed in some jurisdictions.
Regulations: Stock markets are regulated by government authorities (like SEBI in India) to ensure transparency, prevent fraud, and protect investors.
Awareness of these factors helps investors plan their investments efficiently.
10. Conclusion
Investing in shares is both an art and a science, blending financial analysis, market understanding, and behavioral discipline. It offers the potential to grow wealth, generate income, and participate in the growth story of companies. However, it requires knowledge, patience, and risk management. Investors should conduct thorough research, diversify portfolios, and remain focused on long-term objectives to navigate market volatility successfully.
By understanding the fundamentals, adopting effective strategies, and maintaining emotional discipline, investing in shares can become a powerful tool for achieving financial freedom and building lasting wealth. In a world where economic growth is increasingly linked to corporate success, shares remain one of the most accessible and rewarding avenues for individual investors to participate in that growth journey.

Introduction: Understanding Crypto Assets1. Blockchain Fundamentals: The Hidden Architecture
At the heart of crypto assets is blockchain technology—a distributed ledger system. The “secret” here is its simplicity combined with complexity:
Decentralization: Unlike traditional finance, no single entity controls the ledger. Control is distributed across a network of nodes, enhancing security.
Immutability: Once a transaction is recorded, it cannot be altered. This provides transparency and reduces fraud.
Consensus Mechanisms: Proof of Work (PoW) or Proof of Stake (PoS) ensures that network participants agree on the state of the ledger. Understanding these mechanisms can help investors gauge energy efficiency, security, and scalability of a blockchain.
Savvy investors know that not all blockchains are equal; scalability, transaction costs, and governance mechanisms directly influence a crypto asset’s utility and long-term potential.
2. Market Dynamics: Beyond Price Movements
Crypto markets behave differently from traditional equity or forex markets. Some lesser-known secrets include:
Liquidity Pools & Whales: Large holders, or “whales,” can significantly influence prices. Decentralized exchanges (DEXs) use liquidity pools, where the distribution of assets can create volatility or hidden opportunities for profit.
Market Sentiment & Social Media: Crypto markets are highly sentiment-driven. Twitter, Reddit, Telegram, and Discord often act as catalysts for rapid price changes. Early detection of trends on these platforms can be profitable.
Cyclicality: Crypto often follows market cycles—accumulation, hype, euphoria, and crash. Understanding these cycles allows traders to anticipate potential risk and reward.
A key secret is that volatility is not inherently bad; it is a tool for strategic positioning if one understands liquidity and sentiment flows.
3. Tokenomics: The Secret Economics
The design of a crypto asset's economy—its tokenomics—determines its value proposition:
Supply Mechanisms: Some coins have fixed supply (e.g., Bitcoin), creating scarcity, while others are inflationary or deflationary.
Utility: Tokens may represent voting rights, staking rewards, transaction fees, or access to services. Understanding a token’s utility is crucial to predicting demand.
Incentive Structures: Many networks reward participation, staking, or liquidity provision. These incentives influence holder behavior and network security.
The secret here is that strong tokenomics often lead to network effects, driving adoption and sustainable price growth.
4. Security & Custody Secrets
Crypto security is an often-overlooked aspect:
Private Keys & Wallets: Owning crypto means controlling private keys. Losing a key means losing access permanently, making personal security paramount.
Hot vs. Cold Storage: Hot wallets are online and convenient but vulnerable to hacking. Cold wallets are offline and secure but less liquid.
Smart Contract Risk: DeFi protocols rely on smart contracts. Bugs or exploits can drain funds instantly. Audited contracts mitigate risk but are not foolproof.
A secret many beginners miss: security lapses, not market moves, are the leading cause of losses in crypto.
5. Psychological Secrets of Crypto Trading
Emotional intelligence is crucial in crypto trading:
Fear of Missing Out (FOMO): Rapid price increases trigger impulsive buying. Savvy traders anticipate FOMO cycles and position themselves in advance.
Fear, Uncertainty, and Doubt (FUD): Negative news can induce panic selling. Long-term investors often exploit FUD-driven dips.
Cognitive Biases: Overconfidence, herd mentality, and anchoring affect decision-making. Recognizing these biases is essential to maintaining rational trading behavior.
The secret is that crypto is as much a psychological battlefield as it is a financial market.
6. DeFi, NFTs, and Emerging Assets
The crypto world is evolving beyond simple currencies:
Decentralized Finance (DeFi): Offers lending, borrowing, and yield farming without intermediaries. Secrets include yield optimization strategies, impermanent loss management, and governance participation.
Non-Fungible Tokens (NFTs): Represent ownership of digital assets. Market success depends on community adoption, rarity, and cultural relevance.
Layer 2 Solutions & Interoperability: Assets that solve scaling and cross-chain challenges have hidden growth potential. Technologies like rollups, sidechains, and bridges create opportunities for early adoption.
Understanding these emerging segments can give investors a competitive edge before mass adoption occurs.
7. Regulatory & Institutional Influence
Crypto assets exist in a fluid regulatory environment. Secrets include:
Regulatory Arbitrage: Some projects thrive in crypto-friendly jurisdictions, while others face restrictions. Awareness of regulations can prevent legal and financial pitfalls.
Institutional Participation: Large financial institutions entering crypto markets influence liquidity, volatility, and market confidence.
Taxation & Compliance: Different jurisdictions treat crypto differently. Strategic planning can maximize gains and minimize tax liabilities.
Ignoring regulatory trends is a common mistake that can destroy profits or even lead to legal trouble.
8. Mining, Staking, and Network Participation
Mining Secrets: Proof of Work coins like Bitcoin require computational power. Mining profitability depends on electricity costs, hardware efficiency, and network difficulty.
Staking Secrets: Proof of Stake coins reward users for locking their tokens. Staking can yield passive income but comes with risks like slashing.
Governance Participation: Active involvement in protocol decisions can shape the future of the network and provide strategic insight into token value.
These mechanisms are often overlooked by casual investors but are crucial for long-term engagement.
9. Common Pitfalls and Hidden Risks
Scams and Rug Pulls: High-yield promises and anonymous teams can indicate fraud. Research and community validation are essential.
Illiquidity: Some assets may be hard to sell without affecting the price. Avoid assets with low volume unless prepared for long-term holding.
Technical Complexity: Mistakes in transactions, contract interactions, or wallet management can lead to irreversible losses.
The secret is simple: due diligence and skepticism are more valuable than luck in crypto investing.
Conclusion: The Crypto Secret Sauce
The real “secrets” of crypto assets are not mystical—they are a combination of understanding technology, market psychology, tokenomics, security, regulatory frameworks, and emerging trends. Successful crypto investors and traders:
Treat blockchain technology as a tool, not a trend.
Study market sentiment and cycles to anticipate opportunities.
Analyze tokenomics to gauge long-term sustainability.
Prioritize security and risk management above speculation.
Manage psychological biases to prevent impulsive mistakes.
Explore DeFi, NFTs, and layer 2 innovations strategically.
Stay aware of regulatory developments and institutional activity.
In essence, crypto rewards knowledge, discipline, and foresight. Those who master these “secrets” navigate the market more effectively, turning volatility from a threat into an opportunity.

Volume Profile and Market Analysis: A Comprehensive Guide1. Introduction to Volume Profile
Volume Profile is a graphical representation that shows the amount of trading volume that occurred at specific price levels over a given period. Unlike standard volume indicators that display total volume per time period (bars or candles), Volume Profile organizes volume price-wise, highlighting where trading activity has been concentrated.
Key elements of a Volume Profile include:
Point of Control (POC): The price level with the highest traded volume, representing an area of significant interest or consensus between buyers and sellers.
Value Area (VA): The price range where a significant portion of total volume (usually 70%) occurs. This area helps identify fair value for the asset.
High Volume Nodes (HVN): Price zones with high trading activity, often acting as strong support or resistance.
Low Volume Nodes (LVN): Price zones with low trading activity, indicating potential breakout or rejection areas.
By focusing on volume at price rather than volume over time, traders gain a clearer understanding of market sentiment, institutional activity, and potential future price behavior.
2. Importance of Volume Profile in Market Analysis
Volume Profile provides structural clarity that other indicators often miss:
Identifying Key Levels: Volume Profile highlights areas where the market participants have shown the highest interest, forming natural support and resistance zones.
Understanding Market Sentiment: A market trading above its Value Area suggests bullish sentiment, while trading below indicates bearish sentiment.
Spotting Imbalances: Low-volume areas often indicate price rejection or gaps in trading activity, suggesting potential areas for rapid price movement.
Assisting Risk Management: Traders can better define stop-loss and take-profit levels based on high-volume nodes, minimizing the risk of being stopped out by normal market fluctuations.
In essence, Volume Profile provides a macro-level view of price acceptance and rejection, enabling traders to anticipate market behavior with higher precision.
3. How Volume Profile Works
To understand the workings of Volume Profile, consider a market like the Nifty 50 or a stock like Reliance.
Step 1 – Data Collection: Volume Profile uses tick-by-tick or minute-by-minute data to calculate total volume at each price level.
Step 2 – Constructing the Profile: For each price level, the cumulative volume is plotted horizontally. This forms a histogram-like structure over the price axis.
Step 3 – Analyzing the Profile: Traders analyze the histogram to find the POC, HVNs, LVNs, and Value Area. The shape of the profile often reveals market sentiment:
D-Shaped Profile: Indicates a balanced market with equilibrium between buyers and sellers. Price tends to oscillate within the Value Area.
P-Shaped Profile: Suggests strong bullish activity with absorption at lower levels and buying pressure pushing prices higher.
b-Shaped Profile: Reflects bearish sentiment, where sellers dominate and price struggles to move higher.
Understanding these shapes allows traders to anticipate whether the market is likely to trend or remain range-bound.
4. Volume Profile in Conjunction with Market Analysis
Market analysis is broadly divided into technical analysis, fundamental analysis, and sentiment analysis. Volume Profile complements all three.
a. Technical Analysis
Volume Profile enhances traditional technical tools like support/resistance, trendlines, and candlestick patterns by adding the dimension of trading activity concentration.
For example, a resistance level confirmed by a high-volume node is significantly stronger than one identified by price action alone.
Traders can also combine Volume Profile with moving averages or RSI to refine entry and exit points.
b. Fundamental Analysis
While fundamentals like earnings, macroeconomic data, or geopolitical events drive long-term price trends, Volume Profile helps gauge the short-term reaction of market participants.
For instance, if positive earnings lead to a price spike but Volume Profile shows rejection at higher levels (low-volume node), traders might anticipate a pullback.
c. Sentiment Analysis
Volume Profile captures the footprints of institutional trading.
Large participants often accumulate or distribute positions at specific price levels, which appear as high-volume nodes.
Observing these nodes provides clues about market psychology and potential directional bias.
5. Practical Applications of Volume Profile
Support and Resistance Identification:
Traders use high-volume nodes as natural support/resistance levels. Breakouts above or below these nodes are considered significant.
Trend Confirmation and Reversals:
If the price stays above the POC and Value Area, the trend is bullish.
If it drops below, the market may be entering a bearish phase.
Entry and Exit Strategies:
Volume Profile allows precise placement of entries and exits. Buying near LVNs or selling at HVNs can enhance reward-to-risk ratios.
Scalping and Intraday Trading:
Intraday traders use Volume Profile to identify areas of liquidity and price acceptance, helping in quick decision-making for short-term trades.
Gap Analysis:
Low-volume areas act as potential “gaps” where price can move rapidly, enabling traders to exploit breakout opportunities.
6. Limitations of Volume Profile
While powerful, Volume Profile is not without limitations:
Requires Accurate Data: Tick-level or high-resolution volume data is essential for precision.
Doesn’t Predict Market Direction: Volume Profile shows areas of interest but cannot guarantee future movement.
Works Best in Liquid Markets: Illiquid assets may produce misleading volume distributions.
Needs Contextual Analysis: Relying solely on Volume Profile without trend, news, or sentiment analysis can lead to poor decisions.
7. Combining Volume Profile with Other Analysis Tools
To maximize its potential, Volume Profile should be used with complementary tools:
Moving Averages: To confirm trend direction relative to high-volume nodes.
Candlestick Patterns: To validate reversals or breakouts at key levels.
Fibonacci Retracements: To identify confluences between retracement levels and high-volume zones.
Order Flow Analysis: To track live buying/selling pressure in relation to Volume Profile levels.
By integrating these tools, traders achieve a multi-dimensional understanding of market structure, enhancing both timing and accuracy of trades.
8. Conclusion
Volume Profile is a critical tool in modern market analysis, bridging the gap between price action and volume dynamics. By highlighting areas where market participants have concentrated their activity, it provides actionable insights into support, resistance, trend strength, and potential breakout zones. When combined with technical, fundamental, and sentiment analysis, it empowers traders to make informed decisions with a structured approach to risk and reward.
Ultimately, mastering Volume Profile requires practice and observation, but once understood, it becomes a powerful lens for seeing the market’s inner workings, allowing traders to anticipate movements rather than react to them. Whether for intraday scalping, swing trading, or long-term investing, Volume Profile remains a cornerstone for serious market participants aiming for consistency and precision in their trading strategies.
Zero-Day Option Trading: A Comprehensive Overview1. Introduction to Zero-Day Options
Zero-Day Option Trading refers to the practice of trading options contracts that expire on the very same day. In standard options trading, contracts may expire weeks or months in the future. However, zero-day options have a life span of only a few hours, typically expiring at the end of the trading day. This makes them extremely sensitive to price movements in the underlying asset, offering both tremendous profit potential and significant risk.
Zero-day options are also referred to as 0DTE (Zero Days to Expiry) options in modern trading parlance. They are primarily available in highly liquid markets, such as the Nifty 50, S&P 500 (SPX), and major stocks in India, the U.S., and other global exchanges.
2. Why Traders Use Zero-Day Options
Traders are attracted to zero-day options because they can leverage time decay (theta) in their favor and profit from intraday volatility without tying up capital for long periods. The key advantages include:
Rapid Profits: Small moves in the underlying asset can lead to large percentage gains in zero-day options due to high gamma sensitivity.
Intraday Hedging: Traders can hedge other positions without holding them overnight.
Speculative Opportunities: Short-term events, such as economic announcements, earnings, or geopolitical news, can create massive price swings that zero-day options can capitalize on.
However, these benefits come with high risks, as prices can also swing against the trader quickly, resulting in total loss of premium paid.
3. Key Characteristics of Zero-Day Options
High Gamma: Gamma measures the rate of change of delta relative to changes in the underlying asset’s price. In zero-day options, gamma is extremely high, meaning the delta (price sensitivity) can change very quickly with small market movements. This creates both fast profits and fast losses.
Accelerated Theta Decay: Theta represents time decay. As zero-day options approach expiration, theta decay is maximal, meaning the option loses value rapidly if the underlying does not move favorably.
High Vega Sensitivity: Vega measures sensitivity to volatility. While zero-day options are highly sensitive to volatility, the effect of volatility diminishes closer to expiration, making timing extremely crucial.
Cost-Efficiency: Compared to longer-dated options, zero-day options often have lower premiums, allowing traders to take positions with smaller capital.
4. Trading Strategies for Zero-Day Options
Zero-day option trading can be approached through multiple strategies, broadly divided into directional and non-directional trades:
A. Directional Strategies
These are used when traders have a strong belief about the market’s intraday movement.
Buying Calls or Puts:
Traders purchase calls if they expect an upward move or puts for a downward move.
Due to high gamma, even small favorable moves can yield significant profits.
The risk is limited to the premium paid, but total loss can happen within hours.
Scalping with Intraday Trends:
Traders use technical indicators like moving averages, RSI, or intraday patterns to enter trades for small moves.
Profits are booked quickly, often within minutes or hours.
B. Non-Directional Strategies
These are used when traders anticipate minimal price movement or high volatility without direction.
Selling Iron Condors:
Traders sell an out-of-the-money call and put while buying a further out-of-the-money call and put to limit risk.
Profit comes from rapid theta decay, which is extremely fast in zero-day options.
Requires careful monitoring as sudden market spikes can lead to losses.
Straddles and Strangles:
Buying straddles or strangles allows profiting from sharp intraday moves regardless of direction.
Expensive in terms of premiums but can pay off if volatility spikes unexpectedly.
5. Risk Management in Zero-Day Options
Zero-day option trading is inherently risky due to the combination of short time horizon, high gamma, and fast theta decay. Effective risk management is crucial:
Capital Allocation: Never invest more than a small portion of your trading capital in zero-day options. Many traders allocate only 1–5% per trade.
Stop Loss Orders: Set intraday stop losses based on price levels or delta changes to prevent catastrophic losses.
Hedging: Use other options or futures positions to hedge large positions.
Avoid Over-Leverage: High leverage can magnify gains but also total losses. Conservative position sizing is critical.
6. Tools and Technical Analysis for Zero-Day Trading
Traders rely heavily on technical analysis for zero-day trades due to the intraday nature:
Intraday Charts: 1-minute, 5-minute, or 15-minute charts are commonly used to spot trends and reversals.
Volatility Indicators: Bollinger Bands, ATR (Average True Range), and Implied Volatility measures help anticipate price swings.
Momentum Indicators: RSI, MACD, and Stochastic Oscillators help gauge overbought or oversold conditions for timing entries.
Order Flow Analysis: Monitoring real-time buy/sell pressure using Level 2 data can provide an edge in fast-moving markets.
7. Common Mistakes in Zero-Day Option Trading
Ignoring Time Decay: Many beginners buy zero-day options without accounting for the rapid loss in value if the underlying doesn’t move.
Overtrading: Frequent trading increases transaction costs and can amplify losses.
Leverage Mismanagement: High leverage in zero-day options can wipe out capital quickly.
Neglecting Volatility Events: Economic news or corporate announcements can cause sudden spikes, which can either make or break trades.
8. Market Examples and Popular Instruments
In India, Nifty 50 0DTE options are widely used by institutional and retail traders. In the U.S., SPX and SPY options are popular zero-day instruments. These markets are chosen due to:
High liquidity ensuring tight spreads
Significant daily volume
Availability of intraday hedging options
9. Psychological Aspects of Zero-Day Trading
Zero-day option trading demands discipline, emotional control, and focus. Traders face intense pressure as prices can move rapidly within minutes. Impulsive decisions often lead to total losses. Developing a calm, rule-based approach is crucial for consistent profitability.
10. Conclusion
Zero-day option trading is a high-risk, high-reward form of derivatives trading that appeals to intraday traders looking for quick profits from price movements and volatility. Success in this domain requires a combination of:
Deep understanding of options Greeks (Delta, Gamma, Theta, Vega)
Strong technical analysis skills
Disciplined risk management
Quick decision-making under pressure
While the potential for profit is attractive, the risk of rapid losses is equally real. As such, zero-day options are best suited for experienced traders who can manage capital, emotions, and strategy execution simultaneously.
In essence, trading zero-day options is not just a financial endeavor; it is a test of skill, discipline, and nerve, offering an intense yet potentially rewarding experience for those prepared to master it.
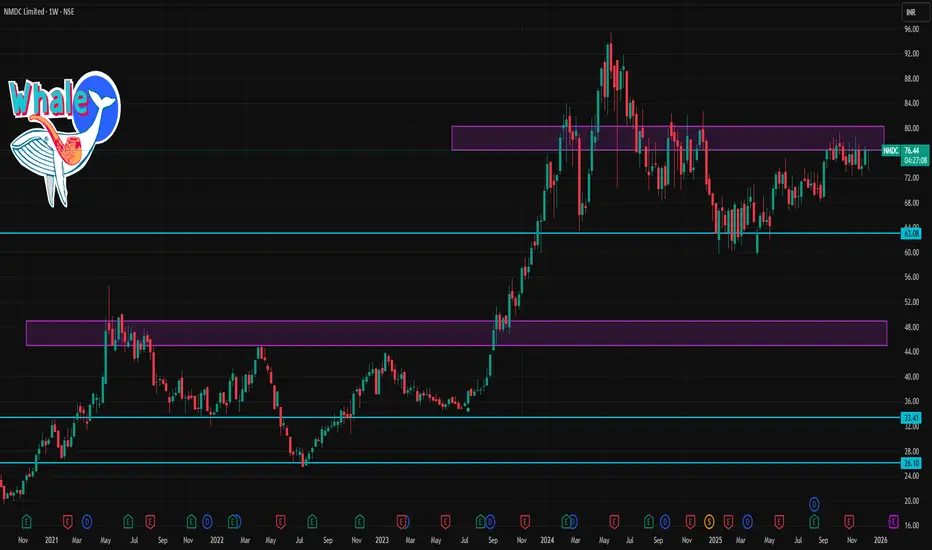
NMDC 1 Week Time Frame 📊 Current Context
The stock is trading around ~₹74–76 recently.
🧠 Notes for the Week
Bullish scenario: Holding above ₹76 could support a move toward ₹78–80.
Bearish scenario: If price closes weekly below ₹73–72, short‑term downside may extend toward ₹71.
Pivot levels and Fibonacci retracements suggest the midpoint resistance ~₹75–76 is key for the next few sessions.
🔎 Quick Summary (1‑Week Levels)
Level Type Zone (Approx)
Strong Support ₹71–72
Immediate Support ₹73–74
Weekly Pivot ₹75.5–76
Immediate Resistance ₹76–77
Higher Resistance ₹78–79
Breakout Zone ₹80+
MARUTI 1 Week Time Frame 📌 Current Price Context
MARUTI is trading around ₹16,470 – ₹16,480 on NSE/BSE today, near recent intraday highs.
📊 Key 1-Week Levels (Support & Resistance)
📈 Resistance Levels
These are upside price zones where selling pressure may appear:
Immediate Resistance (R1): ~₹16,463 – ₹16,488 — the primary near-term ceiling.
Secondary Resistance (R2): ~₹16,644 — next barrier if price sustains above R1.
Higher Resistance (R3): ~₹16,950 — a broader breakout level for the week.
📉 Support Levels
These are downside zones that could act as buying interest:
Immediate Support (S1): ~₹15,976 — first key floor for this week.
Support 2 (S2): ~₹15,670 — deeper support if price slips below S1.
Lower Support (S3): ~₹15,489 — significant lower buffer area for buyers.
Short-term intraday support ~₹16,100 – ₹15,975 — near current trading range.
📊 Pivot Levels (Weekly Reference) — useful for short-term traders
Standard weekly pivot analysis shows:
Weekly Pivot: ~₹16,157
S1: ~₹15,976
S2: ~₹15,670
R1: ~₹16,463
R2: ~₹16,644
R3: ~₹16,950
