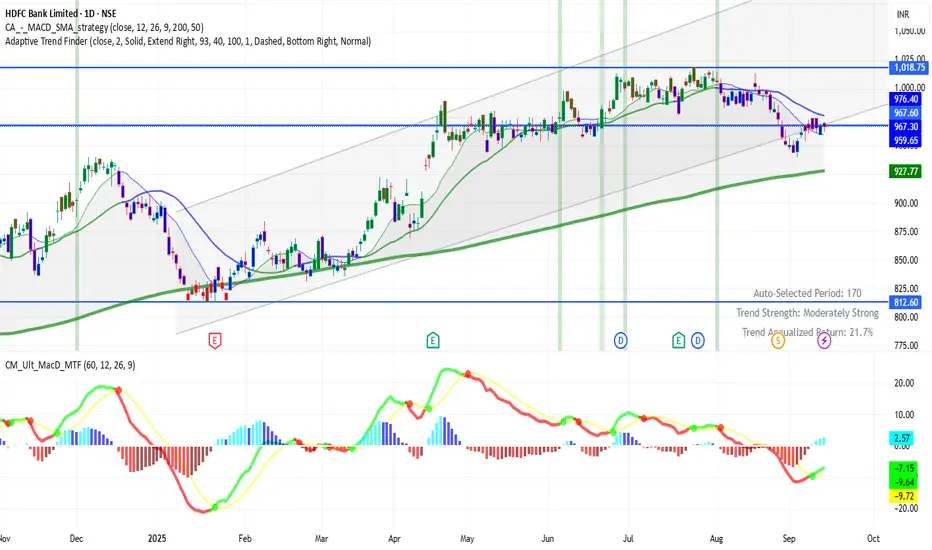
HDFCBANK 1D Time frame📊 Current Status
Price around ₹967
Trading near resistance zone
🔑 Key Levels
Support: ₹960 → ₹950
Resistance: ₹970 → ₹975
✅ Outlook
If price sustains above ₹975, further upside possible. Falling below ₹950 may bring weakness or sideways movement.
HDFCBANK
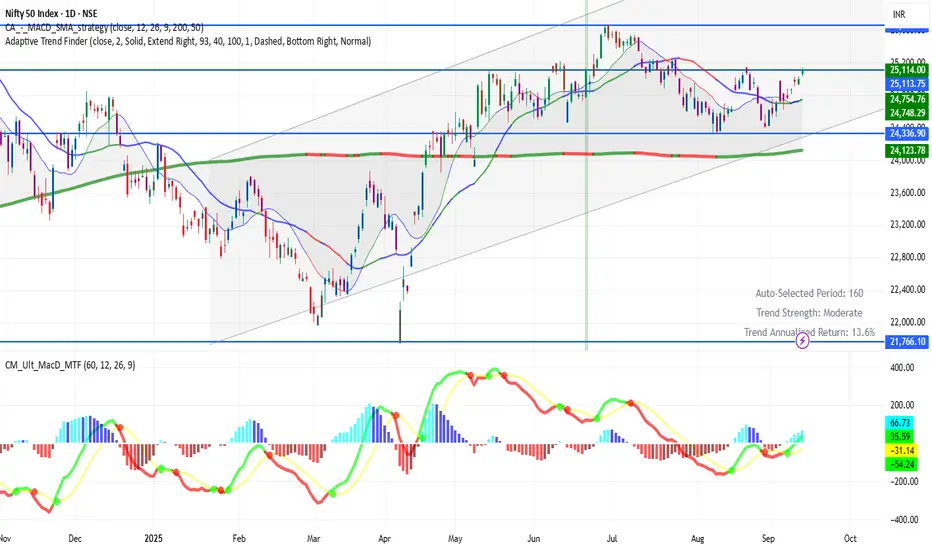
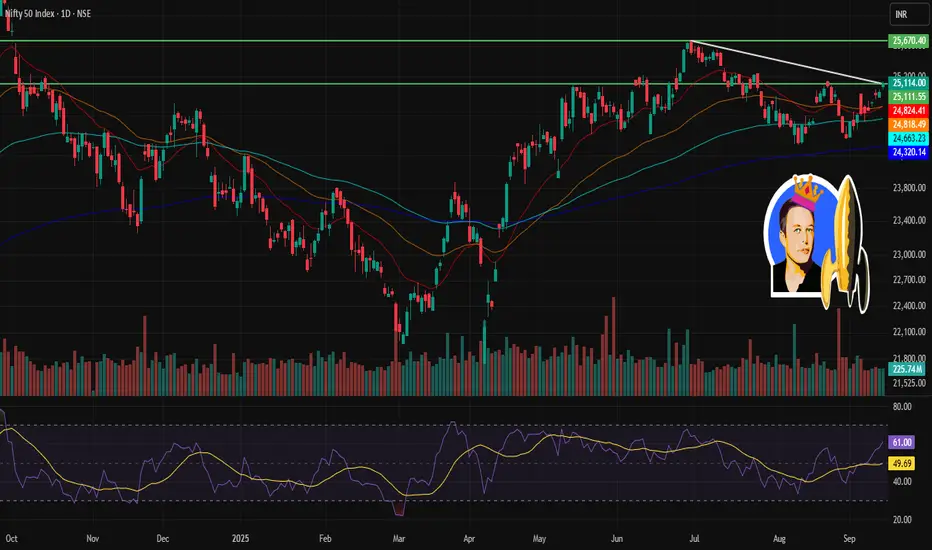
NIFTY (1D timeframe)📍 Current Level
Trading around 25,114
🔑 Key Levels
Immediate Resistance: 25,150 → 25,200
Immediate Support: 25,000 → 24,950
Deeper Support: 24,800 → 24,600
✅ Outlook
If Nifty sustains above 25,150–25,200, more upside can open up.
If it slips below 24,950–25,000, weakness may extend toward 24,800–24,600.
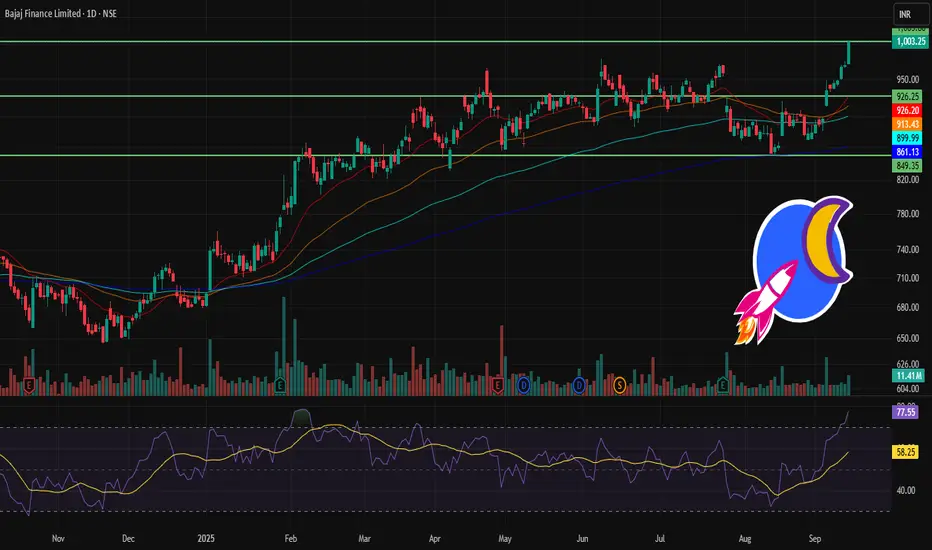
BAJFINANCE 1D Time frame🔢 Current Level
Trading near ₹1,003
🔑 Key Resistance & Support Levels
Resistance Zones:
~ ₹1,020 – ₹1,030 (immediate resistance)
~ ₹1,050 – ₹1,070 (stronger resistance above)
Support Zones:
~ ₹980 – ₹970 (first support)
~ ₹950 – ₹940 (secondary support)
~ ₹920 – ₹900 (deeper support if selling pressure builds)
📉 Outlook
Bullish Scenario: Sustaining above ₹1,000 may drive price toward ₹1,020 – ₹1,070.
Bearish Scenario: A break below ₹980 can drag it toward ₹950 or even ₹920.
Neutral / Range: Likely sideways between ₹980 – ₹1,030 until a breakout.
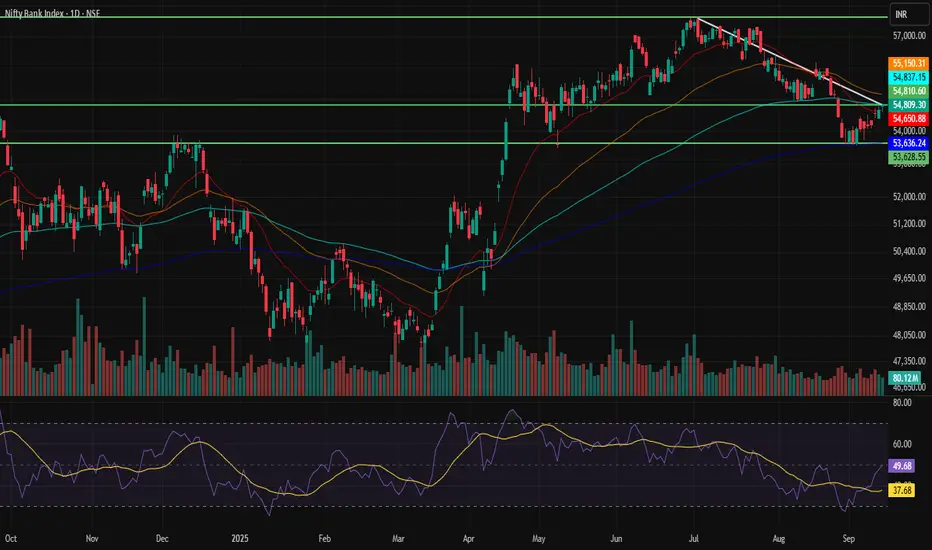
BANKNIFTY 1D Time frame🔢 Current Level
Trading near ₹54,809
🔑 Key Resistance & Support Levels
Resistance Zones:
~ ₹55,000 – ₹55,200 (immediate resistance)
~ ₹55,500 – ₹55,700 (stronger resistance above)
Support Zones:
~ ₹54,500 – ₹54,600 (first support)
~ ₹54,200 – ₹54,300 (secondary support)
~ ₹53,800 – ₹54,000 (deeper support if selling extends)
📉 Outlook
Bullish Scenario: A close above ₹55,000 may trigger momentum toward ₹55,500+.
Bearish Scenario: A slip below ₹54,500 could drag price toward ₹54,200 or even ₹53,800.
Neutral / Range: Between ₹54,500 – ₹55,200, sideways movement likely until a breakout.
NIFTY 1D Time frame🔢 Current Level
NIFTY ~ 25,114
🔑 Key Resistance & Support Levels
Resistance Zones:
~ 25,200 – 25,250 (near-term resistance)
~ 25,400 – 25,500 (stronger resistance if it breaks above the first zone)
Support Zones:
~ 24,950 – 25,000 (immediate support)
~ 24,800 – 24,900 (short-term support)
~ 24,600 – 24,700 (deeper support, in case of downside move)
📉 Outlook
Bullish Scenario: If NIFTY holds above ~25,000 and clears ~25,250, it may head toward ~25,400-25,500.
Bearish Scenario: If it drops below ~24,950, then weakness may drag it toward ~24,800 or lower supports.
Neutral / Range: Between ~25,000 – 25,250 likely consolidation until a decisive move.
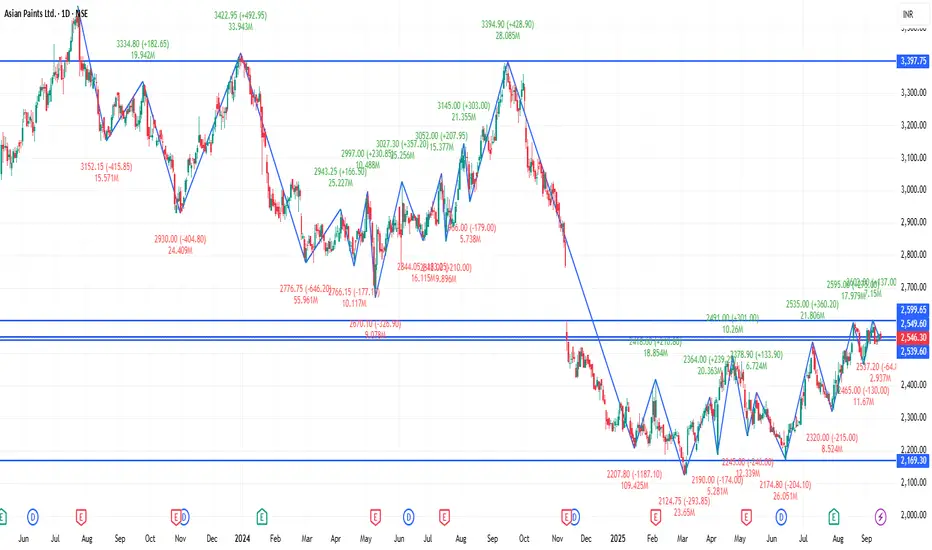
ASIANPAINT 1D Time frame🔢 Current Level
Trading around ₹2,546 – ₹2,560
🔑 Key Resistance & Support Levels
Resistance Zones:
₹2,559 – ₹2,560 (recent highs; breakout above this may lead to further upside)
₹2,580 – ₹2,600 (stronger resistance above)
Support Zones:
₹2,540 – ₹2,545 (immediate support; failure to hold above this may lead to a decline)
₹2,520 – ₹2,530 (short-term support; a break below this could indicate weakness)
₹2,500 – ₹2,510 (deeper support zone if price dips further)
📉 Outlook
Bullish Scenario: If Asian Paints holds above ₹2,545, upward momentum may continue. Break above ₹2,560 can open the way toward ₹2,580+.
Bearish Scenario: If it falls below ₹2,520, risk increases toward ₹2,500 – ₹2,510.
Neutral / Range: Between ₹2,545 – ₹2,560, Asian Paints may consolidate before a directional move.
SBIN 1D Time frame🔢 Current Level
Trading around ₹823.65
🔑 Key Resistance & Support Levels
Resistance Zones:
₹825.00 – ₹830.00 (recent highs; breakout above this may lead to further upside)
₹835.00 – ₹840.00 (stronger resistance above)
Support Zones:
₹815.00 – ₹820.00 (immediate support; failure to hold above this may lead to a decline)
₹810.00 – ₹815.00 (short-term support; a break below this could indicate weakness)
₹800.00 – ₹805.00 (deeper support zone if price dips further)
📉 Outlook
Bullish Scenario: If SBIN holds above ₹820.00, upward momentum may continue. Break above ₹830.00 can open the way toward ₹840.00+.
Bearish Scenario: If it falls below ₹800.00, risk increases toward ₹790.00 – ₹795.00.
Neutral / Range: Between ₹820.00 – ₹830.00, SBIN may consolidate before a directional move.

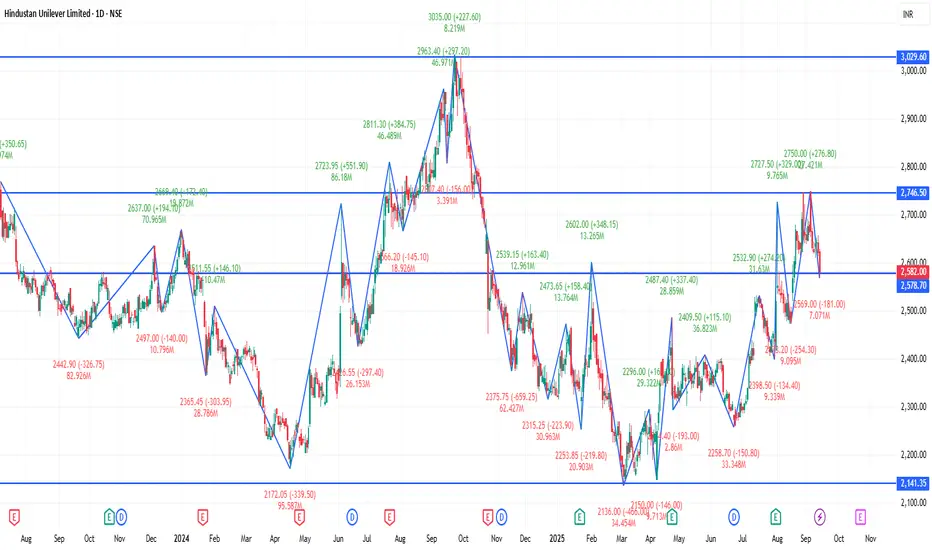
HINDUNILVR 1D Time frame:
🔢 Current Level
Trading around ₹2,578.90 - ₹2,582.00
🔑 Key Resistance & Support Levels
Resistance Zones:
₹2,634.90 – ₹2,636.40 (recent highs; breakout above this may lead to further upside)
₹2,650.00 – ₹2,660.00 (stronger resistance above)
Support Zones:
₹2,569.00 – ₹2,570.00 (immediate support; failure to hold above this may lead to a decline)
₹2,550.00 – ₹2,560.00 (short-term support; a break below this could indicate weakness)
₹2,520.00 – ₹2,530.00 (deeper support zone if price dips further)
📉 Outlook
Bullish Scenario: If HINDUNILVR holds above ₹2,570.00, upward momentum may continue. Break above ₹2,636.40 can open the way toward ₹2,650.00+.
Bearish Scenario: If it falls below ₹2,520.00, risk increases toward ₹2,510.00 – ₹2,530.00.
Neutral / Range: Between ₹2,570.00 – ₹2,636.40, the stock may consolidate before a directional move.
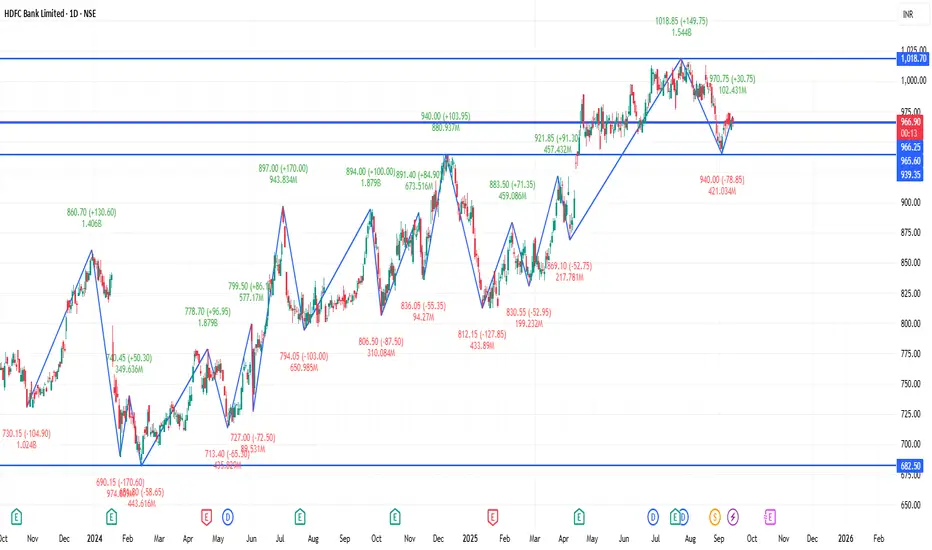
HDFCBANK 1D Time frame🔢 Current Level
Trading around ₹966 – ₹968
🔑 Key Support & Resistance Levels
Resistance Zones:
~ ₹973 – ₹975 (near-term resistance)
~ ₹980 – ₹985 (stronger resistance if price crosses above the earlier zone)
Support Zones:
~ ₹962 – ₹960 (immediate support)
~ ₹955 – ₹953 (lower support if downward pressure continues)
📉 Outlook
Bullish Scenario: Holding above ₹960-₹962 may push price toward ₹973-₹975, and a breakout above that can lead to ₹980-₹985.
Bearish Scenario: Falling below ₹955 may increase downside risk toward deeper supports.
Neutral / Range Zone: Between ₹960-₹975, likely sideways consolidation until a breakout happens.
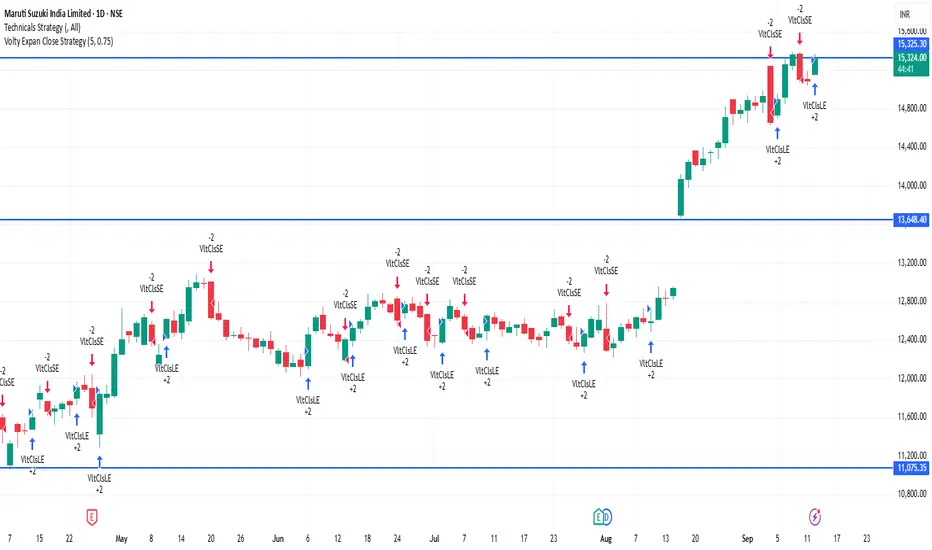
MARUTI 1D Time frame🔢 Current Level
Trading around ₹15,318 – ₹15,325
🔑 Key Resistance & Support Levels
Resistance Zones:
₹15,373 – ₹15,384 (recent highs; breakout above this may lead to further upside)
₹15,400 (psychological resistance)
₹15,500 (stronger resistance above)
Support Zones:
₹15,150 – ₹15,160 (immediate support; failure to hold above this may lead to a decline)
₹15,050 – ₹15,100 (short-term support; a break below this could indicate weakness)
₹14,800 – ₹14,900 (deeper support zone if price dips further)
📉 Outlook
Bullish Scenario: If Maruti Suzuki holds above ₹15,160, upward momentum may continue. Break above ₹15,384 can open the way toward ₹15,500+.
Bearish Scenario: If it falls below ₹15,050, risk increases toward ₹14,800 – ₹14,900.
Neutral / Range: Between ₹15,160 – ₹15,384, Maruti Suzuki may consolidate before a directional move.
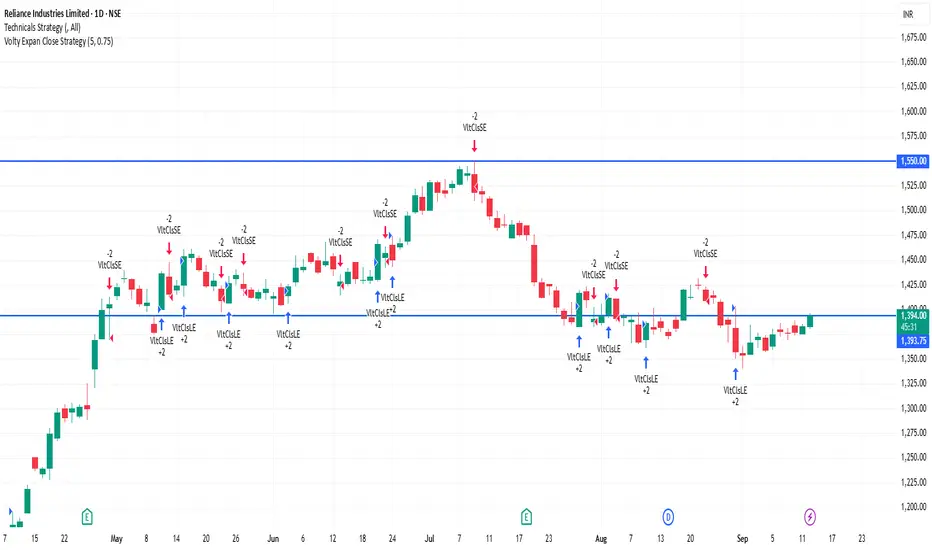
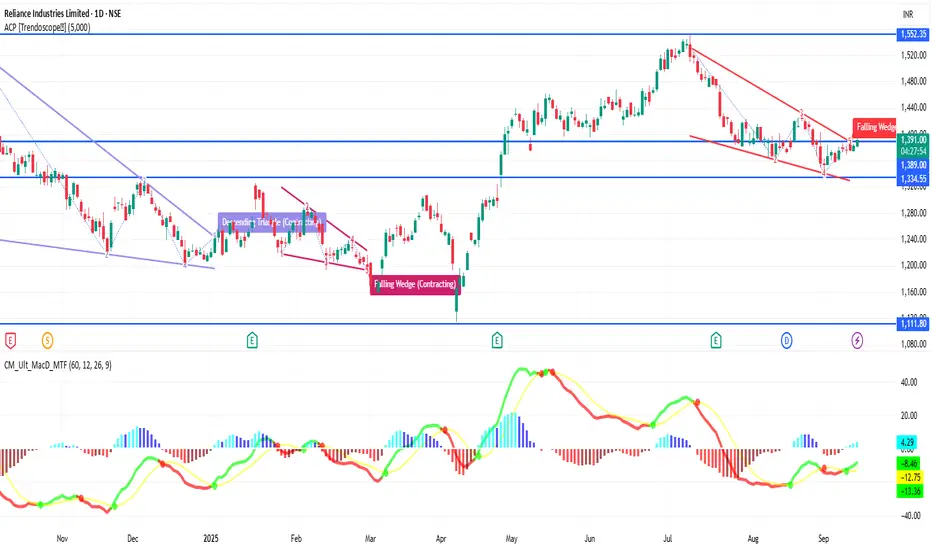
RELIANCE 1D Time frame🔢 Current Level
Trading around ₹1,391.50 - ₹1,395.50
🔑 Key Resistance & Support Levels
Resistance Zones:
₹1,396 – ₹1,400 (recent highs; breakout above this may lead to further upside)
₹1,420 – ₹1,430 (stronger resistance above)
Support Zones:
₹1,380 – ₹1,385 (immediate support; failure to hold above this may lead to a decline)
₹1,370 – ₹1,375 (short-term support; a break below this could indicate weakness)
₹1,350 – ₹1,360 (deeper support zone if price dips further)
📉 Outlook
Bullish Scenario: If Reliance Industries holds above ₹1,385, upward momentum may continue. Break above ₹1,400 can open the way toward ₹1,420+.
Bearish Scenario: If it falls below ₹1,370, risk increases toward ₹1,350 – ₹1,360.
Neutral / Range: Between ₹1,385 – ₹1,400, Reliance Industries may consolidate before a directional move.
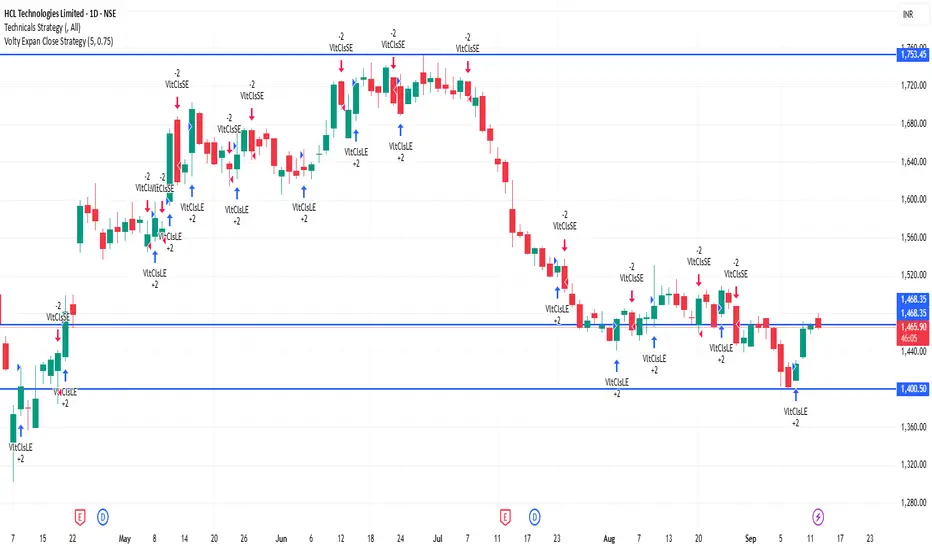
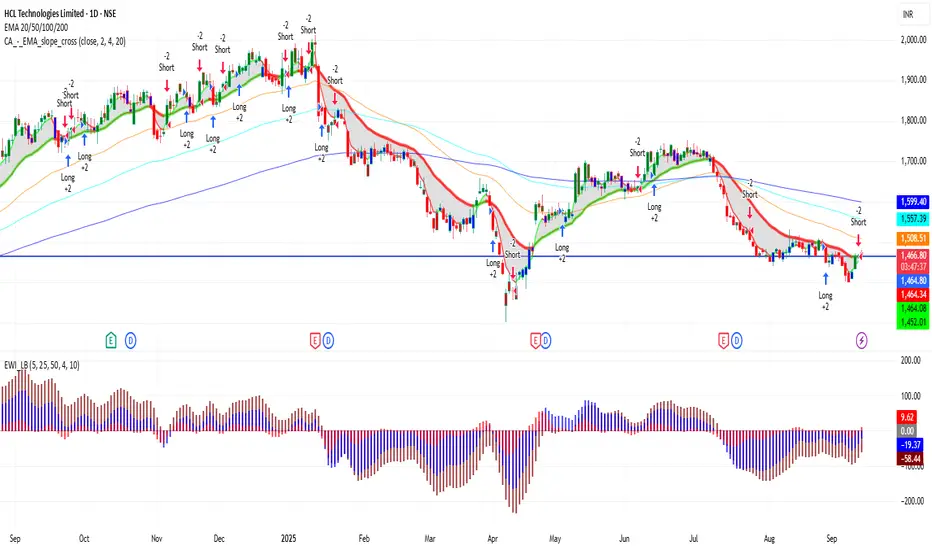
HCLTECH 1D Time frame🔢 Current Level
Trading around ₹1,465.80 - ₹1,467.80
🔑 Key Resistance & Support Levels
Resistance Zones:
₹1,472 – ₹1,475 (recent highs; breakout above this may lead to further upside)
₹1,485 – ₹1,490 (stronger resistance above)
Support Zones:
₹1,460 – ₹1,463 (immediate support; failure to hold above this may lead to a decline)
₹1,450 – ₹1,453 (short-term support; a break below this could indicate weakness)
₹1,440 – ₹1,445 (deeper support zone if price dips further)
📉 Outlook
Bullish Scenario: If HCL Technologies holds above ₹1,463, upward momentum may continue. Break above ₹1,475 can open the way toward ₹1,485+.
Bearish Scenario: If it falls below ₹1,440, risk increases toward ₹1,430 – ₹1,445.
Neutral / Range: Between ₹1,463 – ₹1,475, HCL Technologies may consolidate before a directional move.
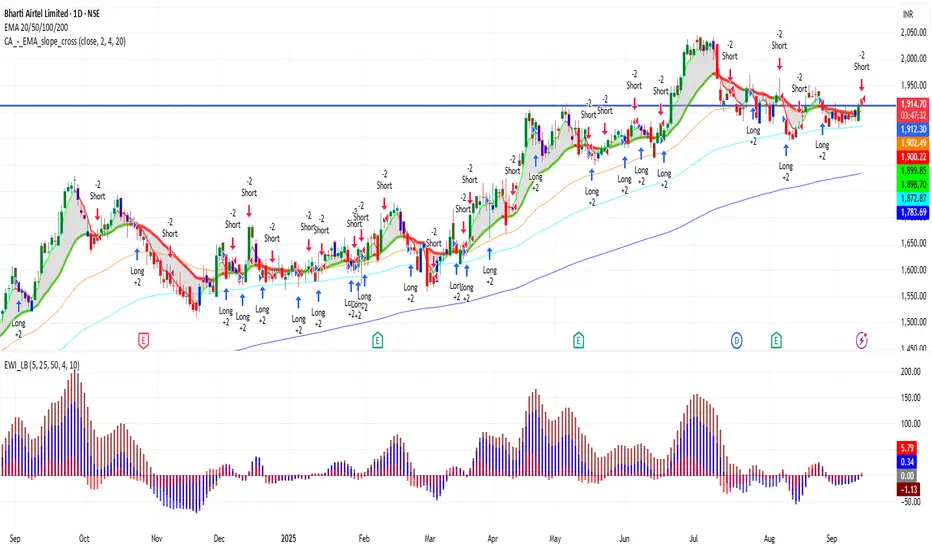
BHARTIARTL 1D Time frame🔢 Current Level
Trading around ₹1,912.00 - ₹1,914.30
🔑 Key Resistance & Support Levels
Resistance Zones:
₹1,925 – ₹1,930 (recent highs; breakout above this may lead to further upside)
₹1,950 (psychological resistance)
₹2,000 (stronger resistance above)
Support Zones:
₹1,900 – ₹1,905 (immediate support; failure to hold above this may lead to a decline)
₹1,880 (short-term support; a break below this could indicate weakness)
₹1,850 – ₹1,860 (deeper support zone if price dips further)
📉 Outlook
Bullish Scenario: If Bharti Airtel holds above ₹1,905, upward momentum may continue. Break above ₹1,930 can open the way toward ₹1,950+.
Bearish Scenario: If it falls below ₹1,880, risk increases toward ₹1,850 – ₹1,860.
Neutral / Range: Between ₹1,905 – ₹1,930, Bharti Airtel may consolidate before a directional move.
HCLTECH 1D Time frame🔢 Current Level
Trading around ₹1,465 – ₹1,470
🔑 Key Resistance & Support Levels
Resistance Zones:
₹1,476 – ₹1,480 (near-term resistance; breakout above this may lead to further upside)
₹1,494 – ₹1,520 (stronger resistance above)
Support Zones:
₹1,460 – ₹1,463 (immediate support; failure to hold above this may lead to a decline)
₹1,450 – ₹1,460 (short-term support; a break below this could indicate weakness)
₹1,431 – ₹1,440 (deeper support zone if price dips further)
📉 Outlook
Bullish Scenario: If HCL Technologies holds above ₹1,463, upward momentum may continue. Break above ₹1,480 can open the way toward ₹1,494 – ₹1,520.
Bearish Scenario: If it falls below ₹1,450, risk increases toward ₹1,431 – ₹1,440.
Neutral / Range: Between ₹1,463 – ₹1,480, HCL Technologies may consolidate before a directional move.
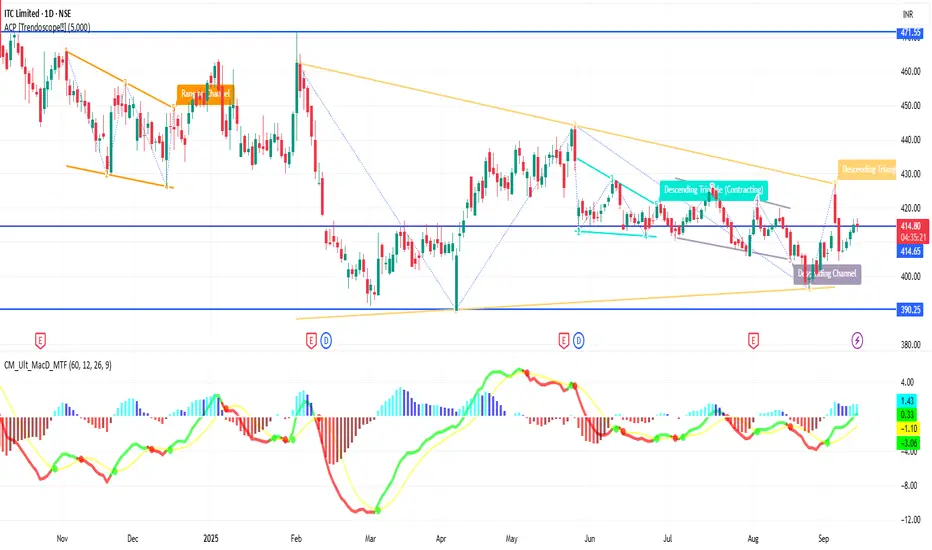
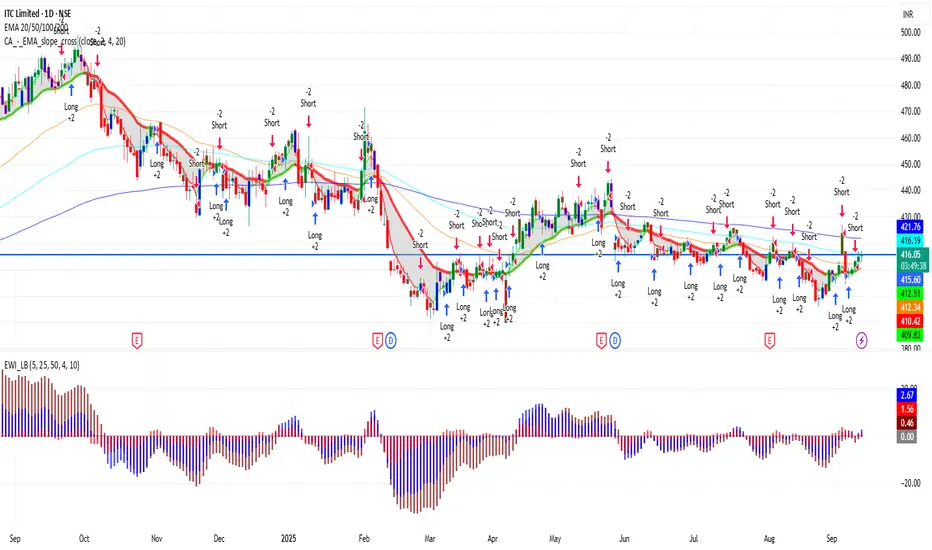
ITC 1D Time frame🔢 Current Level
ITC is trading around ₹413 – ₹416
🔑 Key Resistance & Support Levels
Resistance Zones:
₹416 – ₹421 (near-term resistance; breakout above this may lead to further upside)
₹420 (psychological resistance)
₹428 (stronger resistance above)
Support Zones:
₹412 – ₹413 (immediate support)
₹410 (short-term support; break below may indicate weakness)
₹398 – ₹400 (deeper support zone)
📉 Outlook
Bullish Scenario: If ITC holds above ₹412 – ₹413, upward momentum may continue. Break above ₹417 – ₹420 can open the way toward ₹428+.
Bearish Scenario: If it falls below ₹410, risk increases toward ₹398 – ₹400.
Neutral / Range: Between ₹412 – ₹417, ITC may consolidate before a directional move.
TVSMOTOR 1D Time frame🔢 Current Level
Trading around ₹3,525 – ₹3,530
🔑 Key Resistance & Support Levels
Resistance Zones:
₹3,550 – ₹3,560: Near-term resistance; breakout above this may lead to further upside.
₹3,600: Stronger resistance above.
Support Zones:
₹3,500 – ₹3,510: Immediate support; failure to hold above this may lead to a decline.
₹3,450: Short-term support; a break below this could indicate weakness.
₹3,400: Deeper support zone if price dips further.
📉 Outlook
Bullish Scenario: If TVS Motor holds above ₹3,510, upward momentum may continue. Break above ₹3,560 can open the way toward ₹3,600+.
Bearish Scenario: A drop below ₹3,450 may signal further downside potential.
Neutral Zone: Between ₹3,510 and ₹3,560, TVS Motor may consolidate before a directional move.

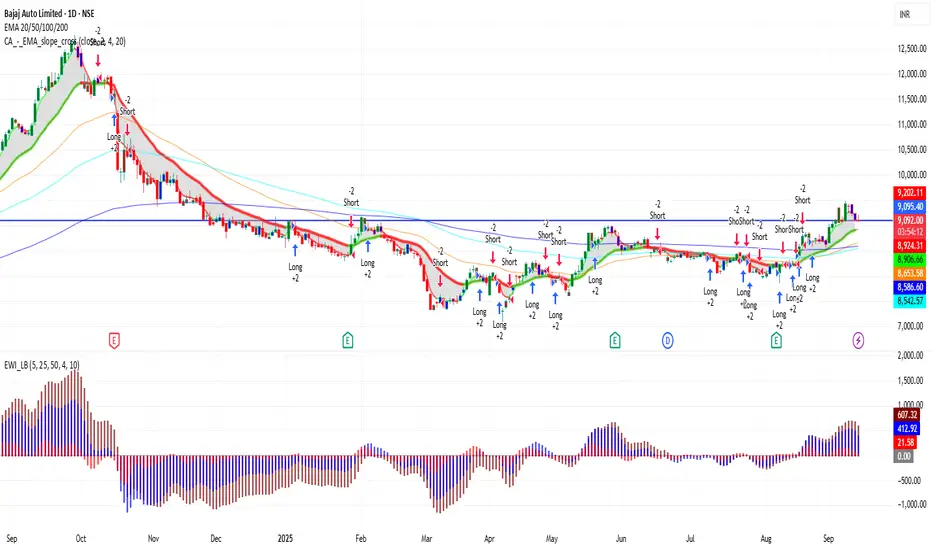
BAJAJ_AUTO 1D Time frame🔢 Current Level
Trading around ₹9,092 – ₹9,110
🔑 Key Resistance & Support Levels
Resistance Zones:
₹9,150 – ₹9,200 (near-term resistance; breakout above this may lead to further upside)
₹9,300 (stronger resistance above)
Support Zones:
₹9,070 – ₹9,090 (immediate support)
₹8,900 (stronger support if price dips further)
₹8,800 (deeper support zone)
📉 Outlook
Bullish Scenario: If Bajaj Auto holds above ₹9,090, upward momentum may continue. Break above ₹9,200 can open the way toward ₹9,300+.
Bearish Scenario: If it falls below ₹8,900, risk increases toward ₹8,800.
Neutral / Range: Between ₹9,090 – ₹9,200, Bajaj Auto may consolidate before a directional move.
RELIANCE 1D Time frame🔢 Current Level
RELIANCE is trading around ₹1,391 – ₹1,392
🔑 Key Resistance & Support Levels
Resistance Zones:
₹1,392 – ₹1,396 (near-term resistance; breakout above this may lead to further upside)
₹1,400 (psychological resistance)
₹1,427 (stronger resistance above)
Support Zones:
₹1,380 – ₹1,385 (immediate support)
₹1,370 (short-term support; break below may indicate weakness)
₹1,350 (deeper support zone if selling pressure continues)
📉 Outlook
Bullish Scenario: If RELIANCE holds above ₹1,385, upward momentum may continue. Break above ₹1,396 can open the way toward ₹1,400+.
Bearish Scenario: If it falls below ₹1,370, risk increases toward ₹1,350.
Neutral / Range: Between ₹1,385 – ₹1,396, RELIANCE may consolidate before a directional move.
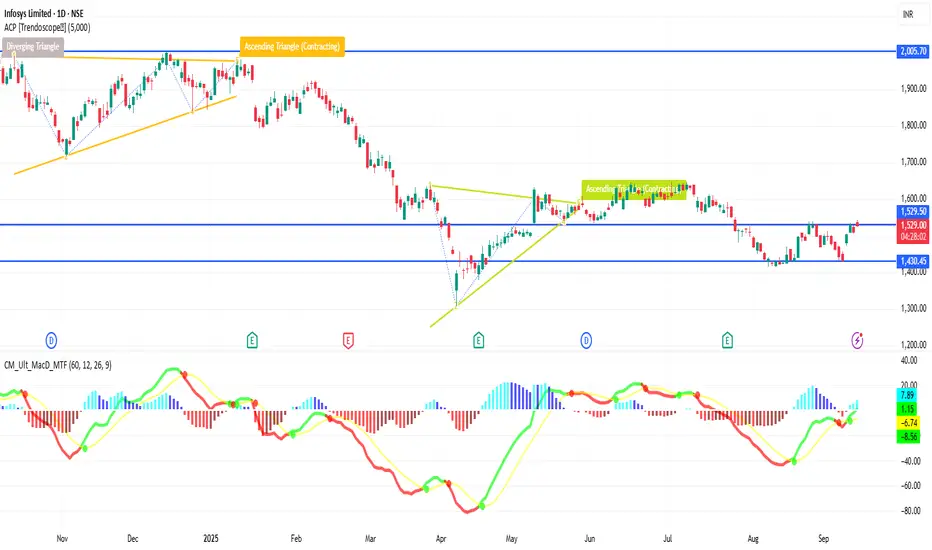
INFY 1D Time frame🔢 Current Level
INFY is trading around ₹1,510 – ₹1,529
🔑 Key Resistance & Support Levels
Resistance Zones:
₹1,518 – ₹1,520 (near-term resistance; breakout above this may lead to further upside)
₹1,530 (stronger resistance above)
Support Zones:
₹1,484 – ₹1,485 (immediate support)
₹1,481 (stronger support if price dips further)
₹1,470 – ₹1,472 (deeper support zone)
📉 Outlook
Bullish Scenario: If INFY holds above ₹1,485, upward momentum may continue.
Breakout Scenario: A move above ₹1,520 can open the way toward ₹1,530+.
Bearish Scenario: If it falls below ₹1,481, risk increases toward ₹1,470 – ₹1,472.
SENSEX 1D Time frame🔢 Current Level
Sensex is around ₹81,800 – ₹81,818
🔑 Key Resistance & Support Levels
Resistance Zones
~ ₹81,900 – ₹82,200 (recent highs / selling pressure zone)
~ ₹82,500 (stronger resistance above)
Support Zones
~ ₹81,300 – ₹81,400 (immediate support)
~ ₹81,100 (stronger support if price dips further)
~ ₹80,800 – ₹80,900 (deeper support zone)
📉 Outlook
If Sensex holds above ~ ₹81,400, bullish scenario remains alive.
Break above ~ ₹82,200 can open upside toward ~ ₹82,500+.
If it loses ~ ₹81,300, then downward risk increases, possibly toward ~ ₹81,100 or lower.

BANKNIFTY 1D Time frame📊 Current Snapshot
Current level: around 54,680 - 54,690
Today’s range: approx. 54,580 – 54,850
🔑 Key Daily Levels
Resistance Zones
54,960 (near-term resistance)
55,172 (major resistance; breakout above this could extend rally)
55,000 (psychological resistance)
Support Zones
54,462 (immediate support)
54,400 – 54,500 (important support band)
54,107 (deeper support if selling pressure continues)
📉 Outlook
Bullish Case: If Bank Nifty sustains above 54,960 – 55,172, it can move higher towards 55,300 – 55,500.
Bearish Case: If it breaks below 54,400, the index may slip toward 54,100 or even lower.
Neutral / Range: Between 54,400 – 54,960, sideways movement is likely until a breakout occurs.

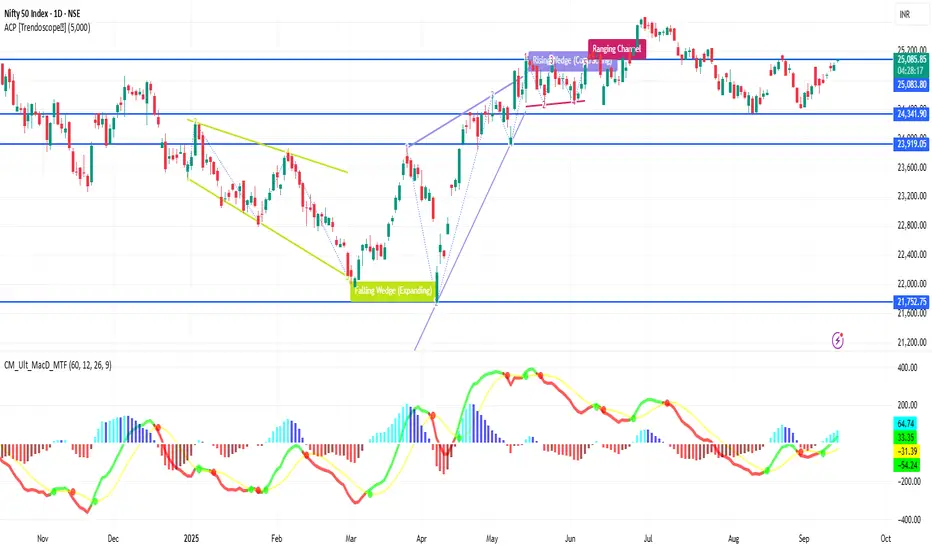
NIFTY 1D Time frame📊 Current Data
Current trading level: around 25,076 – 25,091
Today’s range: approx. 25,038 – 25,095
52-week range: 21,743 – 26,277
🔑 Key Daily Levels
Resistance Zones
25,090 (near-term resistance just above current trading)
25,153 (recent swing high, major resistance level)
Support Zones
24,994 – 24,950 (immediate support range)
24,800 (strong support zone; crucial for trend continuation)
📉 Trend View
Bullish Case: If NIFTY sustains above 25,090 and breaks 25,153, it could push higher towards 25,200+.
Bearish Case: If it fails to hold 24,950–24,994 and slips below 24,800, downside momentum could strengthen.
Neutral Zone: Between 25,000 – 25,050, NIFTY may consolidate before deciding direction.
ITC 1D Time frame🔢 Current Level
Trading around ₹414 – ₹432
🔑 Key Resistance & Support Levels
Resistance Zones:
₹435 – ₹438 (near-term resistance; breakout above this may lead to further upside)
₹442 (stronger resistance above)
Support Zones:
₹425 – ₹428 (immediate support)
₹420 (stronger support if price dips further)
₹415 – ₹417 (deeper support zone)
📉 Outlook
Bullish Scenario: If ITC holds above ₹428, upward momentum may continue. Break above ₹438 can open the way toward ₹442+.
Bearish Scenario: If it falls below ₹420, risk increases toward ₹415 – ₹417.
Neutral / Range: Between ₹428 – ₹438, ITC may consolidate before a directional move.