Hindalco LongHindalco is near the support zone. It has trend line support as well as 50 EMA support.
Stochastic RSI is also showing over sold levels.
By looking at the price action it seems like a minor pull back from recent high and the uptrend is still intact. Fibonacci is also showing 23.6% retracement from recent highs.
I am bullish on metals and Bullish on Hindalco as well.
But if it breaks the 171 levels then the bears may kick in and down fall may come.
Watch out for 171 levels. As long as 171 is protected on the closing basis I am bullish on Hindalco.
HINDALCO

Hindalco Long I hope you can now see how HINDALCO represents an excellent low risk profit entry setup allowing you to trade in the market.Take positions so that the risk/reward is in your favor.
Knowing why, where & when a strong reversal signal is being generated will be the only way to capitalize on your technical analysis .
Disclaimer: It should not be assumed that the methods, techniques, or indicators presented in these chart will be profitable or that they will not result in losses. There is no assurance that the strategies and methods presented will be successful for you. Past results are not necessarily indicative of future results. You should not trade with money that you cannot afford to lose. Examples presented in these charts are for educational purposes only and it should not be assumed that these are indicative of ordinary trades. These setups are not solicitations of any order to buy or sell. The publisher assume no responsibility for your trading results. There is a high degree of risk in trading.

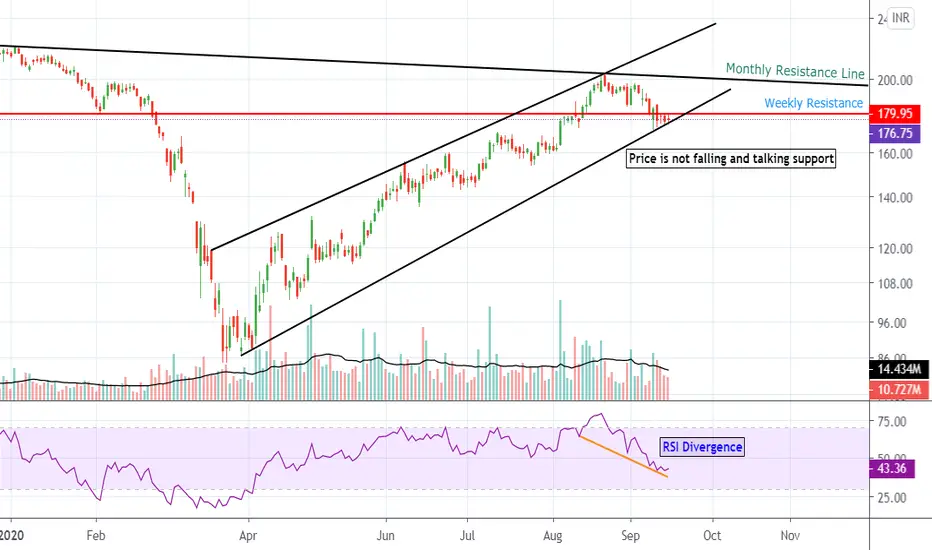
Hindalco Respecting Tendline and making base before another runHindalco is creating base around 175 level. Any closing above 180 may take this towards 200+ levels. Keep an eye on this before the big players take it to new heights. You can also see RSI divergence in the charts
Go long if closes above 180 with SL of 173.
HINDALCO seems bearish ------ Daily Analysis i was BANNED for violating house rule so i am republishing again without any alteration
Sold @ 198.95
Target @ 185.85
Points Earned = 13
lot size = 4300
profit booked =56,330 per lot

Hindalco: In a critical ZoneHead and shoulder formation observed before the big crash. Support of this formation is on 181 rs.
Right shoulder broke the support and a major fall occurred which coincides with Covid situation.
Recovery is happening in a parrallel channel making upper dynamic resistance and lower dynamic support lines.
Today Both the previous support and parallel channel crossed each other.
Hindalco made a High of 186 rs but couldnt sustain the levels & fell sharply to close on 178rs. which is below its critical 181 rs resistance(previous support) line.
Tomorrow's move will decide the further trend of Hindalco.
Nifty is in indecisive mode & most probably a correction will happen soon.
This will give the opportunity to short hindalco.
Nifty correction>> Short Hindalco-- Target 166-168, SL- 185
Nifty Bull Run>>>> Long Hindalco-- Target 196-198, SL- 170


Hindalco short I hope you can now see how Hindalco represents an excellent low risk profit entry setup allowing you to trade in the market.Take positions so that the risk/reward is in your favor.
Knowing why, where & when a strong reversal signal is being generated will be the only way to capitalize on your technical analysis .
Disclaimer: It should not be assumed that the methods, techniques, or indicators presented in these chart will be profitable or that they will not result in losses. There is no assurance that the strategies and methods presented will be successful for you. Past results are not necessarily indicative of future results. You should not trade with money that you cannot afford to lose. Examples presented in these products are for educational purposes only and it should not be assumed that these are indicative of ordinary trades. These setups are not solicitations of any order to buy or sell. The publisher assume no responsibility for your trading results. There is a high degree of risk in trading.

HINDALCO - Shooting Star + Fib RetracementShooting star on daily chart!
Short below 163 for 160 with SL at 164.5

HINDALCO Trading SetupDisclaimer: All charts are purely for educational and information purpose only. Invest or Trade at your own risk.

HINDALCO - BUY TRENDTrend line support - Higher high break out
It will Test a support level.
Support - 160 , 155 , 152
Target - 168 , 174 , 179

Hindalco Setup 28/6/2020Huge resistance at 160 may go long for more than intraday if crosses 152.30 for the target of 160.

Hindalco: Chart setup & strategyHindalco
CMP 148
- The stock has resistance at 156-160 range
- red trend line is broken
- orange trend line if taken out, the stock can come down to 136 / 130 levels
Given the set up one may consider One may consider selling if orange trend line is broken. or consider selling on rise closer to 154 / 156
________________________________________________________________________________________________________________________
Alternatively consider selling Hindalco 160 Call option around 4
Lot size 4300
Max profit potential Rs 17200/- per lot
Yield potential 9.5% approximately
In built Loss protection for a rise up to 164 on 30 July 2020
Take care & safe trading...!!!
Discliamer:
- The view expressed here is my personal view
- Use this for educational purpose
- Any decision you take you need to take responsibility for the same
- It's your hard earned money. Treat it wisely
- Trade / Invest keeping in mind your trading style, goals and objectives, time horizon & risk tolerance
- F&O trading involves risk
- Do take proper risk management measures
- Do your own analysis and consult your financial adviser if need be

Can Go Long in Hindalco As resistance became supportA clear cut breakout happened.
Now the resistance line has been broken hard and the support stands there.
Can go Long because of the confirmation.
Trading Geeks


Hindalco - Bullish breakoutNote: This is for educational purpose only.
There seems to be a bullish breakout with high volume. Moreover, RSI is above 60 which indicates bullish momentum.

HIndalco is on a verge to go all the way down (3rd July 2020)As mentioned it is a rising wedge pattern and hence the downside will be too much if it breaks the wedge pattern.

JINDAL STEEL TRADE SET UP and personal views I will look to sell the stock on a bounce from current levels in areas of 127 to 131 for 121 /114/110/100 targets

POSTIONAL TARGET FOR hINDALCOSETUP LOOKS STRONG, TARGET 155-160
MOMENTUM AND RSI LOOK GOOD.
9 EMA CROSSEDD OVER 40 EMA
VOLUMES ARE GREAT
DELIVERY PERCENTAGE = 22-30 % (ie TRADERS PLAYING)
SWOT = 5/6/4/2 (MILDLY GOOD)
BUTING A FUTURES LOT , ALONG WITH A ITM PE FOR SAFEGUARDING

Tata Steel: Two possibilities ANALYSIS:
While trading never forget the possibilities, each coin has two sides, market too have two sides.
Everything is clear on the chart.
Possibility 1:
Price might touch 317 levels and move towards 322, 326, 328 levels. From this levels it might fall back towards 316, 310, 303 level.
Possibility 2:
Price might touch 317 levels and move towards 322, 326, 328 levels. Once it crosses this level and floats above it, it might move towards 336 and 342 levels.
Everything will be updated on my telegram channel. Ping me for the link.
Please do like, support the idea as well as share your valuable opinion in comment section. Feedbacks are welcome.
Your 1 like= 1000 encouragement.
Thanking you,
Kalpana Burman
Disclaimer:
The data and information provided in this published idea is not an advice and should not be relied upon as such. Neither the information, nor my opinion contained in this idea constitute a solicitation or offer by me to buy or sell any securities, futures , options or other financial instruments.
The content of the idea and the interpretation of data are solely my personal views which being said I do not warrant its completeness or accuracy.
This idea published is purely intended for educational and informative purposes, I urge traders to make their own trading decisions based on their specific trading objectives and financial position.

Facing resistance and distribution.Facing resistance and distribution. I will sell this with a Rs 2 stop loss.

Hindalco Seems weakSell around 151 Target 149.5 Stoploss 152 (Disclaimer: This is my Personal view not an investment advice)
