Hindalco: Play For BounceAlthough I presented the trade on weekly chart yet it would be small swing trade which may take just few days to either hit the targets or stop loss. Partial or full profit booking at first target could be done as overhead supply may hurt the upmove. Some might disagree with my Cypher pattern so I urge them in advance to take it easy :)
All nitty gritty details are mentioned on the chart itself.
The stock is highly volatile so risk averse traders may opt to stay out of this trade.
As per my setup Risk to Reward is not exactly 1:1.
So those who want exactly 1:1 may wait for pullback to 215.50 but only after hitting the 217 entry .
All the best for the week ahead.
Regards
HINDALCO

My Predictive Engine's Intraday call(23-Mar)-Hindalco-Long Off-late I started investigating more on predicting the next candle for the day and seeing enough success by using the patterns of various indicators. Pine scripting in tradingview has helped a lot to automate everything and create necessary signals. Based on the engine's call, tomorrow (23-Mar-2018) will be a super "GREEN" for Hindalco NSE:HINDALCO
Buy above: 217.3
Target-1: 219
Target-2: 220
Target-3: 220.95
Stop loss: 215.4
Note: These calls are based on my own analysis. It may or may not work well for you. So please carefully consider whether it is suitable for you and please do your own research before attempting any. The profit/loss made by you due to this call, is solely your own responsibility. Thanks, All the best. Happy Trading. :-)


hindalco , rallied enough ..now GO BACK!Will like to go short on the above stock , with stop loss of todays high !

HINDALCO Neckline breakoutHindalco has been respecting the neckline for a few months now.Currently on the nckline, after making a higher low.


Hindalco - LoooooongRefer chart : classic Text Book pattern.
No Naked trades , Use strategy :
1) Buy 230 Dec calls , sell 250 Dec calls --- My preference.
2) Buy Dec future , Sell 230 Dec call
3) Sell Dec 240 or 250 Put , Buy 220 Put
4) Buy 2 lot 230 call , Buy 1 lot 230 put
check what strategy suits you ,And execute your trade .
Beware lot size is 3500 , so risk is high , manage your risk ,
If not enough capital don't take F&O trade.
(Consult your financial adviser before taking any trade )

Hindalco - Looking for reversal of very short term trendHindalco is near strong support line and trying to breakout from small trend line, if succeed then can travel back to it's resistance zone 264-266 levels as shown in charts, and once break past 268 expect to see 280+ in fast & furious mode.

HINDALCO BreakoutHINDALCO is moving in a pretty good Symmetry. It first moved 12.5% down, then 25% up, now down to 11% down. backk on the Zero line.

Hindalco headed towards 260 250 levels ?NSE:HINDALCO has been making a channel for last few days suggesting a channel breakout soon. Since it had a bull run previously and results are already out, there are no more buy trigger in the near future. Close below 263.50 on hourly charts can take it further down.


HINDALCO Lifetime BreakoutHindalco just retested its lifetime high AFTER SEVEN YEARS.
currently in breakout/reversal zone.


HINDALCO Triangle BreakoutHindalco approaching the triangle edge, for a breakout or another leg down.

Hindalco - Bullish Formation (Breaks Strong Resistance)It is been observed on the daily chart that the price action breaks above the crucical and important resistance levels and shall further move up from current levels. It also created a bullish inverse head and shoulder pattern.
Target: 210
Stoploss: 200

High probability trade in HINDALCOHi! I trade NSE stocks using Demand and Supply zone strategy, mostly in Weekly time frame.
Here's a trading plan for HINDALCO
Weekly location: Equilibrium
Daily trend: Up (Let's go long)
Hourly zones: Demand zone marked on chart
Trade duration (max): 1 week
Note: Target, Entry and SL on chart

Hindalco : Breakout Off of Daily coupled with 15 Min TFHindalco has been struggling to Break out of the Range since months on Daily TF, but this time theirs high probablity of breaking out of the range looking at the maturity of the pattern on Daily TF.
The Channel as well as The Ichimoku Cloud has been broken out on 15 min TF. After the open on Monday, Hindalco may test the 200-201 level which is a strong area to enter into the trade. Targets can be around 207-210 or one may trail the Stoploss. SL should be at around 198.30. Good R/R Trade.
It may take a day or two to reach the targets.. so I'll keep you all updating on this, Stay Tuned :)

Hindalco struggling at higher level. If it doesn't manage to break its 200 level, soon it come back to its 190 level. Better to keep watch on!

Hindalco - Breaking Out from Long Consolidation It is been observed that the price action is breaking out from a long consolidation range, indicating a strong move to upside.
Target: 215
Stoploss: 200

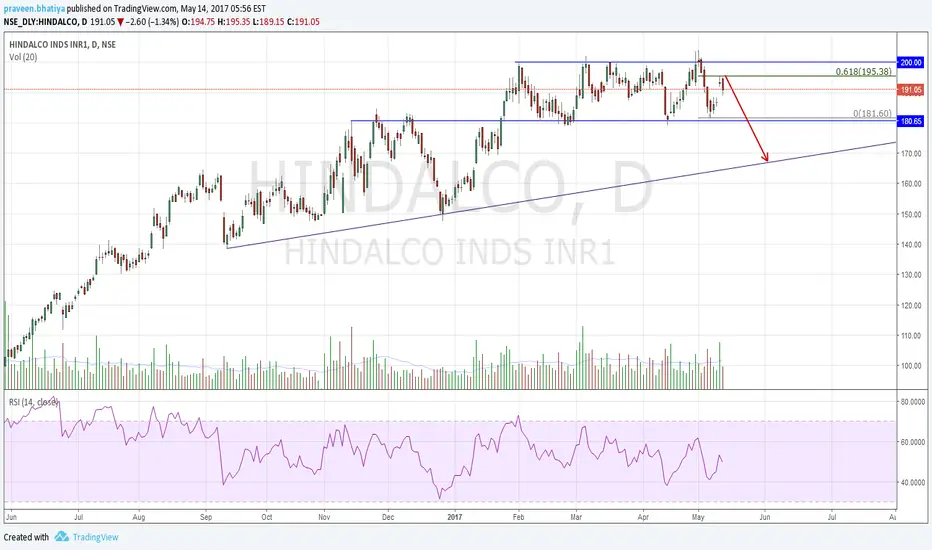
Hindalco Short Engulfing at significant Fib levelThe prices are moving in a parallel channel since 01.02.17. Second last bar seems to be an pseudo Upthrust bar with good volume as last bar was a bearish engulfing and that too at significant 61.8 Fib level. One can short the stock taking the high of this bar as stop loss(closing basis) and look for the lower boundary of channel as first target which is quite reasonable risk to reward. However trader with patience can wait for the move till 170.
Hindalco - Investment stock?Stock has been lingering around long term resistance of 200 for quite some time now. Notice the hidden bullish divergence formed with MACD and RSI. Can it break the triangle and go up?

Hindalco : Rectangular Channeling...i) If you get bullish entry setups on lower timeframe, take that till 200's
ii) If there is bullish breakout, trail stops n enjoy the run. Else book profits, if 200 not broken
