SENSEX 1D Time frame Current Status
Trading around 81,904 points
Showing steady upward move in recent se
Key Levels
Support: 81,600 → 81,400 → 81,000
Resistance: 82,000 → 82,400 → 83,000
Outlook
As long as Sensex holds above 81,400–81,600, trend remains positive. Break above 82,000–82,400 can lead toward higher levels, while falling below 81,000 may trigger correction.
Hul

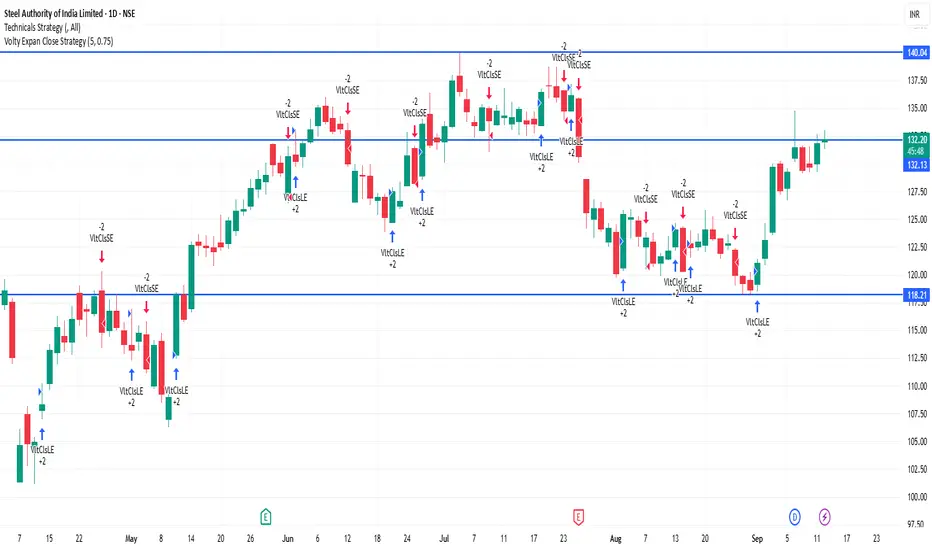
SAIL 1D Time frame🔢 Current Level
Trading around ₹132.28
🔑 Key Resistance & Support Levels
Resistance Zones:
₹133.00 – ₹134.00 (near-term resistance; breakout above this may lead to further upside)
₹135.00 – ₹136.00 (stronger resistance above)
Support Zones:
₹131.50 – ₹132.00 (immediate support; failure to hold above this may lead to a decline)
₹130.00 – ₹130.50 (short-term support; a break below this could indicate weakness)
₹128.00 – ₹129.00 (deeper support zone if price dips further)
📉 Outlook
Bullish Scenario: If SAIL holds above ₹132.00, upward momentum may continue. Break above ₹134.00 can open the way toward ₹135.00+.
Bearish Scenario: If it falls below ₹130.00, risk increases toward ₹128.00 – ₹129.00.
Neutral / Range: Between ₹132.00 – ₹134.00, SAIL may consolidate before a directional move.
BANKNIFTY 1D Time frame🔢 Current Level
Trading around ₹54,823
🔑 Key Resistance & Support Levels
Resistance Zones:
₹54,900 – ₹55,100 (near-term resistance; breakout above this may lead to further upside)
₹55,200 – ₹55,500 (stronger resistance above)
Support Zones:
₹54,600 – ₹54,650 (immediate support; failure to hold above this may lead to a decline)
₹54,400 – ₹54,500 (short-term support; a break below this could indicate weakness)
₹53,900 – ₹54,000 (deeper support zone if price dips further)
📉 Outlook
Bullish Scenario: If BANKNIFTY holds above ₹54,650, upward momentum may continue. Break above ₹55,100 can open the way toward ₹55,500+.
Bearish Scenario: If it falls below ₹54,400, risk increases toward ₹53,900 – ₹54,000.
Neutral / Range: Between ₹54,650 – ₹55,100, BANKNIFTY may consolidate before a directional move.

NIFTY 1D Time frame📍 NIFTY – 1D Important Levels
🔹 Support Zones
22,200 – 22,300 → Immediate daily support
21,900 – 22,000 → Strong support zone; buyers likely to step in here
21,500 – 21,600 → Major support; breakdown may shift trend to bearish
🔹 Resistance Zones
22,700 – 22,800 → Immediate daily resistance
23,000 – 23,100 → Strong resistance; breakout may fuel next leg higher
23,400 – 23,500 → Major resistance; if crossed, long-term bullish momentum strengthens
⚖️ Daily Trend Outlook
Nifty is currently in a bullish trend on the daily chart, making higher lows and sustaining above key moving averages.
Momentum remains strong as long as price holds above 22,200.
A breakout above 22,800 will likely push the index toward 23,000 – 23,500.
A breakdown below 22,200 could invite selling pressure toward 22,000 – 21,600.
NIFTY1!📍 NIFTY1! – 1H Key Levels
🔹 Support Zones
22,450 – 22,500 → Immediate intraday support
22,350 – 22,400 → Stronger support, buyers likely active here
22,200 – 22,250 → Major support zone, breakdown can invite selling pressure
🔹 Resistance Zones
22,650 – 22,700 → Immediate resistance on 1H chart
22,800 – 22,850 → Strong resistance area, breakout may fuel rally
23,000 → Psychological and major resistance zone
⚖️ Quick Summary
Above 22,700, momentum may push Nifty Futures towards 22,850 – 23,000.
Below 22,450, weakness could drag price back to 22,350 – 22,200.
Current 1H trend bias is mildly bullish, but range-bound moves are possible between 22,450 – 22,700 before a breakout.
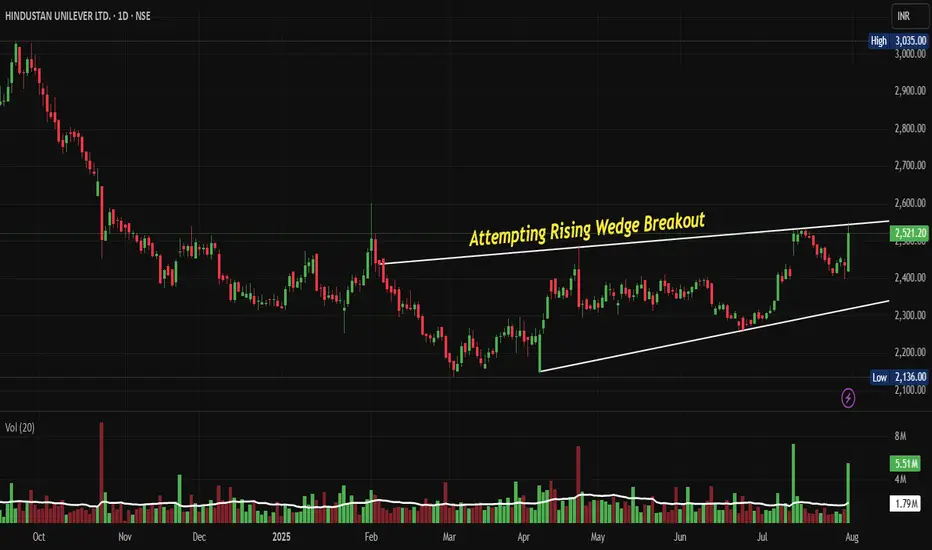
HINDUNILVR: Attempting Rising Wedge Breakout Post Q1 FY 26NSE:HINDUNILVR Attempting Rising Wedge Breakout: A Technical Revival Story Worth Watching Post Decent above Estimate Volume Growth and Q1 FY26 Results.
Price Action:
• Trading within a well-defined rising wedge pattern from February 2025 to July 2025
• The stock experienced a significant decline from its peak around ₹3,035 in September 2024 to a low of ₹2,136 in March 2025
• Currently trading at ₹2,521.20 with a gain of ₹83.80 (+3.44%)
• The stock appears to be attempting a breakout from the upper trendline of the rising wedge
Volume Spread Analysis:
• Volume has been relatively subdued during the consolidation phase within the wedge
• Recent sessions show increased volume activity with 5.51M shares traded, indicating renewed interest
• The volume pattern suggests accumulation during the lower levels of the wedge formation
• Volume spike accompanies the current breakout attempt, confirming the move
Key Technical Levels:
Key Support Levels:
• Immediate support: ₹2,420-₹2,450 (recent consolidation zone)
• Strong support: ₹2,300-₹2,350 (lower trendline of the rising wedge)
• Critical support: ₹2,136 (52-week low established in March 2025)
Resistance Levels:
• Immediate resistance: ₹2,550-₹2,580 (upper trendline breakout zone)
• Next resistance: ₹2,700-₹2,750 (previous swing highs)
• Major resistance: ₹3,035 (52-week high from September 2024)
Technical Patterns:
• Rising Wedge Pattern: A bearish reversal pattern that has been forming since Feb 2025
• Breakout Attempt: The stock is testing the upper boundary of the rising wedge with increased volume
• Higher Lows Formation: Despite the wedge pattern, the stock has been making higher lows since March 2025
Trade Setup:
Entry Strategy:
• Primary Entry: On sustained breakout above ₹2,550 with volume confirmation
• Secondary Entry: On pullback to ₹2,480-₹2,500 after successful breakout
• Aggressive Entry: Current levels around ₹2,520 for short-term traders
Exit Levels:
• Target 1: ₹2,680-₹2,700 (8-10% upside potential)
• Target 2: ₹2,850-₹2,900 (15-18% upside potential)
• Target 3: ₹3,000-₹3,050 (20-25% upside potential)
Stop-Loss Strategy:
• Conservative: ₹2,350 (below the rising wedge support)
• Moderate: ₹2,420 (below immediate support zone)
• Tight: ₹2,480 (for breakout trades)
Position Sizing:
• Conservative investors: 2-3% of portfolio allocation
• Moderate risk appetite: 4-5% of portfolio allocation
• Aggressive traders: 6-8% of portfolio allocation
Risk Management:
• Risk-Reward Ratio: Maintain a minimum 1:2 ratio for all entries
• Trailing Stop: Implement a 5-7% trailing stop after 10% gains
• Partial Profit Booking: Book 30% profits at Target 1, 40% at Target 2, and hold 30% for Target 3
Sectoral and Fundamental Backdrop:
FMCG Sector Overview:
• BSE FMCG index was up 1 per cent, as compared to a 0.5 per cent decline in the BSE Sensex
• The FMCG sector is showing resilience amid broader market volatility
• Rural demand recovery is expected to support sector growth in the coming quarters
Financial Performance:
• TTM Revenue: 63,928 Cr, TTM Profit: 10,827 Cr
• The company has delivered a poor sales growth of 10% over the past five years
• Annual revenue for March 2025 reached Rs 63,121 Crore, up 2%. Net profit rose 3.8% to Rs 10,671 Crore
Valuation Metrics:
• HUL's stock trades at a Price-to-Earnings (P/E) ratio around 55.70x, slightly below its historical averages (~61x over 5 years)
• Stock is trading at 12 times its book value
• Market Cap: 5,92,476 Crore (down -6.82% in 1 year)
Business Fundamentals:
• Promoter Holding: 61.9%
• Strong brand portfolio across multiple FMCG categories
• Extensive distribution network covering both urban and rural markets
• Urban markets contribute 60 per cent to HUL's sales, while rural markets comprise the rest
Recent Developments:
• Motilal Oswal analysts believe that volume growth for HUL has reached its lowest point and foresee a gradual recovery in volumes during FY25
• Brokerages tracked by Business Standard estimate HUL's net profit to decline 1.2 per cent year-on-year (Y-o-Y) on average, to ₹2,540.6 crore
• The company is expected to benefit from improving rural demand and premiumization trends
My Take:
• HUL remains a defensive play in the FMCG space with strong market positioning
• The technical breakout attempt coincides with expectations of volume recovery
• Long-term investors can consider accumulating on dips while traders can play the breakout momentum
Keep in the Watchlist and DOYR.
NO RECO. For Buy/Sell.
📌Thank you for exploring my idea! I hope you found it valuable.
🙏FOLLOW for more
👍BOOST if you found it useful.
✍️COMMENT below with your views.
Meanwhile, check out my other stock ideas on the right side until this trade is activated. I would love your feedback.
Disclaimer: "I am not a SEBI REGISTERED RESEARCH ANALYST AND INVESTMENT ADVISER."
This analysis is intended solely for informational and educational purposes and should not be interpreted as financial advice. It is advisable to consult a qualified financial advisor or conduct thorough research before making investment decisions.
HUL - A snail!Price analysis & overview:
1. Moves are very choppy.
2. Until it breaks ATH, there is nothing to do with this stock.
- Stay tuned for further insights, updates and trade safely!
- If you liked the analysis, don't forget to leave a comment and boost the post. Happy trading!
Disclaimer: This is NOT a buy/sell recommendation. This post is meant for learning purposes only. Please, do your due diligence before investing.
Thanks & Regards,
Anubrata Ray

HUL Make or breakHUL is nearing its support zone of 2370. If it crosses below 2370, expect a fall to 2143 levels. Resistance levels are clearly shown in the Fibonacci extensions.

HUL awaiting breakoutHUL is trading in a triangular channel and awaiting breakout.
Breakout on upper side will take it to previous 52 week high and then 3000 and 3250 are next target.
Stop Loss will be Low of the breakout candle once it happens.
Not a buy recommendation unless breakout occurs and closes above the triangular channel on Monthly charts.

HUL: Channel trade PotentialHUL
Chart set up
- we are looking at weekly chart of HUL
- Stock is trading in a channel since July 2022
- currently at lower end of the channel
View
- Range bound movement
Trading Strategy
- Consider to accumulate at current levels and on dips for a target potential of 2730 odd levels
- If weekly closing is below 2393 then pattern gets invalidated
Understanding Risk :: Reward and Risk Management
Reward potential for the set up approx 250 points from current levels
Have provisions to accumulate further on dips in such a way that RIsk is of around 60 points
giving us a Risk::Reward ratio of 1::4 plus
Take care and safe trading...!!!
If you find the analysis useful do Like and Follow

Breakout in Hindustan Unilever Hindustan Unilever has given a breakout with increased volume after a long period. RSI is also above 60 showing strength. Can add this for short term gain as nifty is trading at all time high with a strict SL.
CMP - 2755
Target 1 - 2890
Target 2 - 3030
SL - 2700 (2%)
Disclaimer : This is for educational purpose only. Take advice from your financial advisor before investing.

Buy Hindustan Unilever BTSTHUL is looking good for buying you can carry your BTST position on Hindustan Unilever
Buy @2699
SL 2673
Target 2791
Good risk reward ratio

BUY WHIRLPOOL OF INDIATargets are mentioned in the chart. But for long term investing. Company financials looks good. Profit down during Covid period, now gets increasing. Coffee can stock.

Buy RelianceTarget : 3000
Long on reliance industries for medium term gains.
Stocks can be bought for this price.
2800 first target.


Hindustan Unilever Bullish Breakout | Swing Trade | Hindustan Unilever Limited (HUL) has given a bullish breakout out of a symmetrical triangle.
FMCG sector looks strong and with this breakout, we can expect price of HUL to go high in coming few days.
Entry can be initiated at current market price.
Stop Loss- Below 2523
Target- 2720
Let me know in the comments section if you want me to analyse any other financial instrument.
WARNING:-
ALWAYS FOLLOW RISK MANAGEMENT AND POSITION SIZING WHILE TAKING ANY TRADE.

HUL short term swing tradeA possible bottom formation in the stock in smaller tfs , looks good in terms of risk to reward ratio , can go long with smallest of stop losses

HUL BREAKING 200EMAHUL breaking 200ema entering in uptrend
target can be 2650
keep ur SL as ur risk
educational idea only

nestle sun set!! it is turning bearish and we may likely see a period of no return in the counter for the upcoming year or so!
a kind of top-out formation which suggest long to be avoided as an investment.
it can test 15200-14900 in coming months/years

HUL LONGHUL LONG
Expecting upmove. Currrently near breaking the resistance levels of 2600.
Once breaks decisively can move to a short term target of 2880.
No recommendations, Just view.


HUL good to watchNSE:HINDUNILVR
Good to keep on the radar
Always respect SL & position sizing
========================
Trade Secrets By Pratik
========================
Disclaimer
SEBI UNREGISTERED
This is our personal view and this analysis
is only for educational purposes
Please consult your advisor before
investing or trading
You are solely responsible for any decisions
you take on basis of our research.

HUL losing 5% in 2 session. What next?Hindustan Unilever has lost 5% in only 2 trading session, taking stock around 2500 figure.
The stock on the daily time frame has broken the 20 DMA and closed just near the support level of 2500.
The support has been tested 4 times and if the support line is broken the stock can plummet to 2450 levels.
Even on the weekly chart analysis, the stock is trading under 20 ema.
3 Point confirmation
1. Close below the 20 DMA (on daily chart).
2. High volume break down.
3. Bearish moving average cross over (on hourly charts).
The stock can be prefered for a sell trade once it start trading below the 2500 level.
Target :- 2450 (200 DMA), 2415
Stop loss :- 2525
Stock option for the next month expiry can be traded in the stock.
Wait for the levels to break down and watch for a price action near the levels before entering the trade.
