GOLDHello & welcome to this analysis
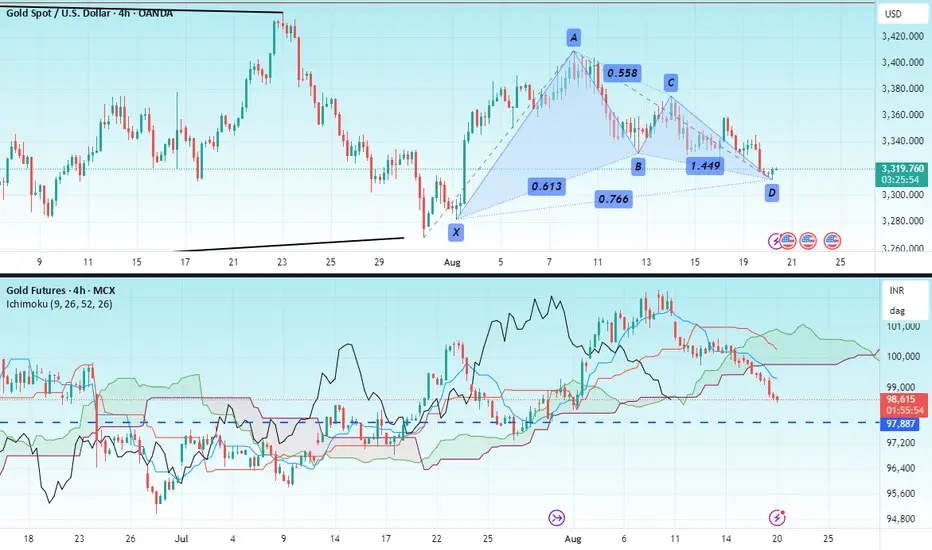
Gold at COMEX has formed a bullish Harmonic Gartley pattern in 4hr time frame suggesting a reversal in trend.
As long as it sustains above $3295 it could give a bounce/rally till $ 3345 - 3370 - 3400 - 3450.
Gold at MCX appears to be ending its pullback but due to INR $ fluctuations a bullish Harmonic pattern has not formed. One could look for bullish trades as long as its above 97900 for upside levels of 99400 - 100000 - 101000 - 102500. Keep in mind levels could alter due to forex changes
Overall GOLD is strong and has an upside triangle breakout target of $3700 open as long as it is above $3250 (refer to my earlier view published on Gold in the link)
All the best
Ichimokutrainig
CRUDEHello & welcome to this analysis
USOIL / CRUDE (MCX) after a very sharp rally till the slanting channel have now retraced to very strong support levels as per the ICHIMOKU indicator in daily time frame.
One could look for a 4hrs reversal candle confirmation between $64.50 - 63.75 / INR 5625 - 5450 for a resumption of rally till $77 / INR 6900 with resistance on its path at $68.50 & $74 / INR 5825 & INR 6400
Remember enter only after you get a bullish candle confirmation from lower time frame.
All the best

NIFTY ITHello & welcome to this analysis
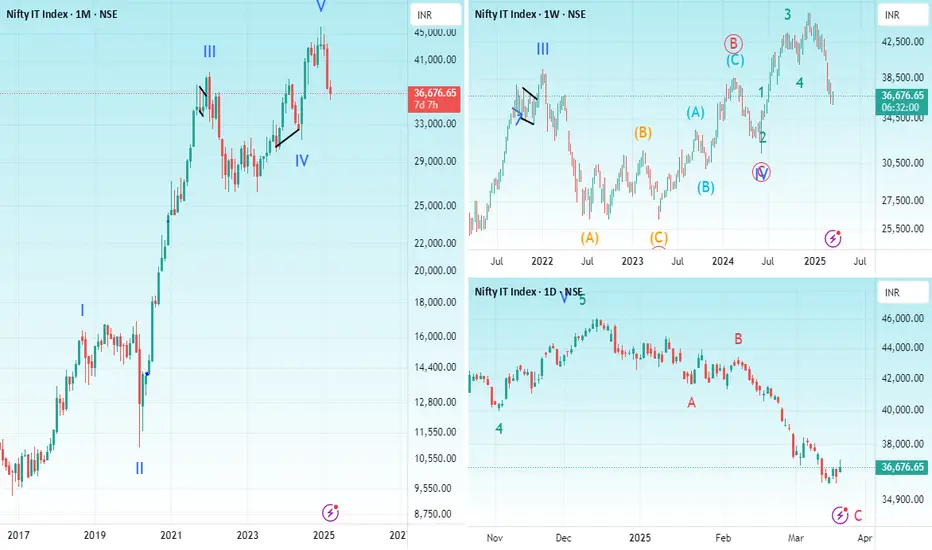
NIFTY IT (CNXIT) appears to have completed in
Monthly from 2016 lows an impulse 5 waves up
Weekly shows a running flat wave 4 followed by sub waves of the terminal 5th wave
Daily indicates post the impulse an ABC corrective ended (ending)
is this A of abc down after a monthly 5 up or is it wave 2 complete with this ABC?
It is too early to say the latter. Normally the corrective tends to retest the start of the preceding sub wave 4 that is around 31000 but that is not mandatory as per Elliott Wave rules.
An early indication of which wave is unfolding will depend on how the sub waves come out now, either they will be corrective, then it would be B of abc or they will be impulse then wave 2 has ended and index is into Wave 3.
Interesting days ahead for IT index
All the best
SMALL CAP INDEXHello & welcome to this analysis
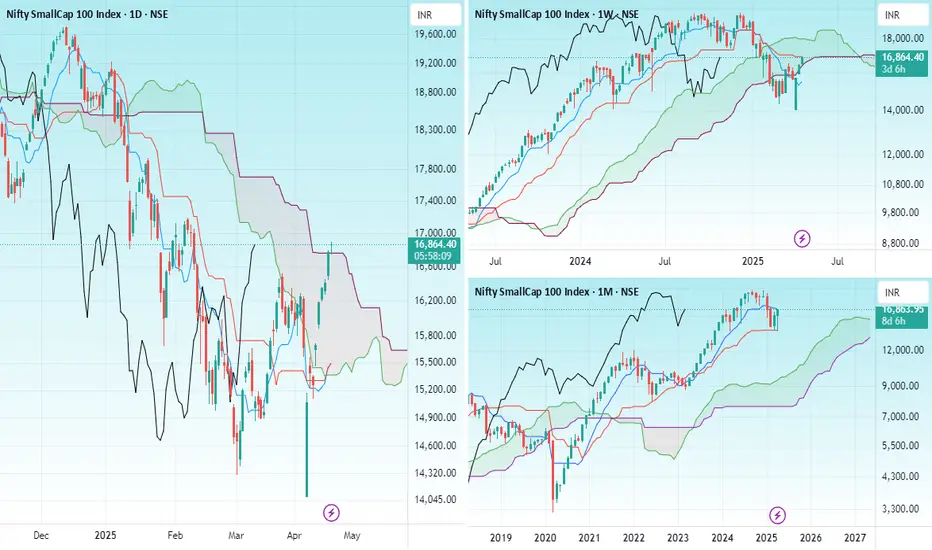
The index gave a sharp bounce back like the rest of the market and is now near a cluster resistance - monthly, weekly & daily @ 16900.
It could consolidate in this zone before trying a breakout for 17500 else dip down to 16000 where it has good support.
Fresh buying in small caps at current levels for short term should be done with caution else wait for breakout above 16900 or dip down to 16000 approx.
DLFHello & welcome to this analysis
In the hourly time frame after a steep correction followed by consolidation its now on the verge of an Inverse Head & Shoulder breakout above 695 for probable upward levels of 740 & 800.
It has very good support near 670 as shown by the Ichimoku Kumo
All the best

IOCHello & welcome to this analysis
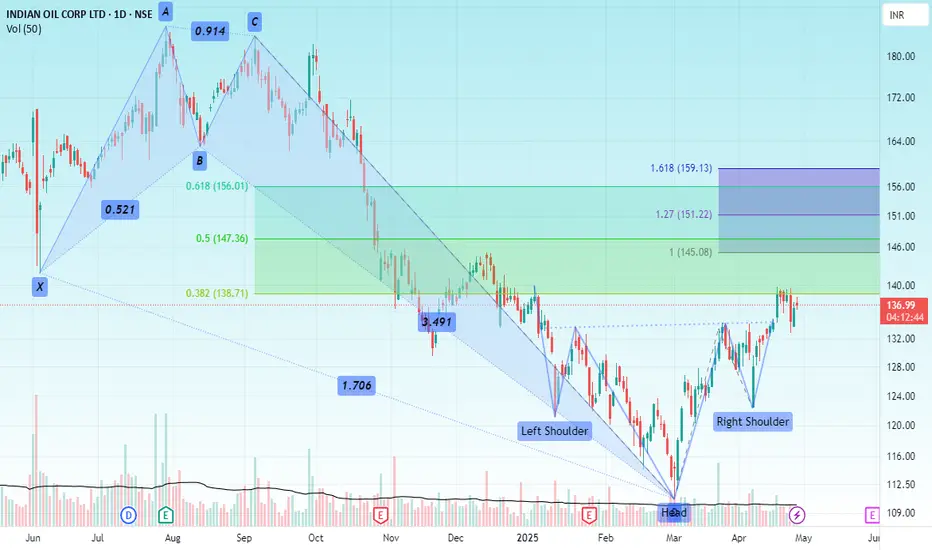
A deep 6 months correction lead to the formation of a Bullish Harmonic Crab pattern in March 2025 post which during accumulation (consolidation) phase formed an Inverse Head & Shoulder.
A 38% retracement of the bullish harmonic pattern has been done and now its completing a pullback of the IHS breakout by retesting the neckline.
Potential upside levels are 145 and 160 for both the IHS & Bullish Harmonic Crab
All the best
ZYDUS LIFE SCIENCEHello & welcome to this analysis
The co gets 50% of its revenue from USA where new policies appear to be hurting the top and bottom line of the stock.
Narrow range 840 - 950, wider range 650 - 1025.
Idea is to buy either after it sustains above 950 or near 650
Happy Investing and all the best with your trading

MphasisHello & welcome to this analysis
Stock could be forming a cup & handle pattern in the monthly time frame with the lower leg of the handle coming to an end.
2000 is an extremely important level for the stock in the short term, while it has loads of resistance between 2300-2800 on the upside as it attempts to complete the handle.
Overall weakness continues below 2000, else one could expect stock to rise steadily towards completion of the bullish pattern

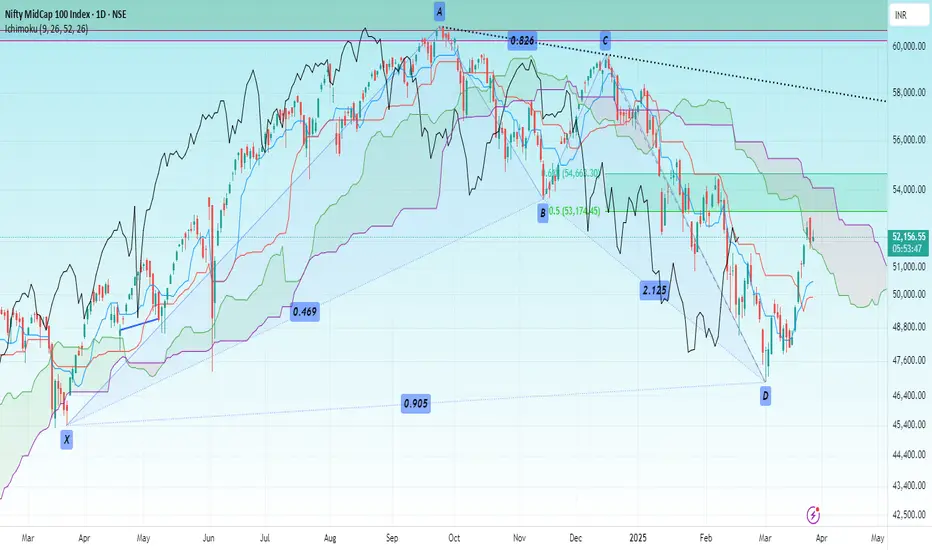
MIDCAP INDEXHello & welcome to this analysis
The index after a steep decline formed a bullish Harmonic Bat reversal pattern.
At the 50% retracement level it has formed a three candlestick bullish signal - Upside Tasuki Gap suggesting further upside.
As long as it sustains above 51500 it could continue its up move till 54500 that is the 62% retracement and above that 57500 that coincides with the trend line resistance.
All the best
SILVERHello & welcome to this analysis
Since May 2024, Silver (Comex) has surpassed $32.5 only once and failed on 4 attempts (including Fri - 14th Feb). Silver (MCX) has surpassed 96500 only once and failed on 3 attempts (one less due to $:INR impact).
Is this setup a complex H&S in the making (multiple shoulders)? I have my doubts on that because the weekly and monthly patterns are of a cup and handle formation with the latter in the process of currently shuffling out weak hands.
A daily close above 32.50 / 96500 would lead to a strong rally. Strong support now at $31 / 93500
Medium to long term view bullish, short term volatile - waiting for breakout
Regards

EMAMI LTDHello & welcome to this analysis
the market has taken a heavy toll across all sectors, not even sparing the defensive sector - FMCG.
What lies ahead for Emami, a fmcg co with established brands across several segments - I have in this video covered the stock across multiple time frames showing likely support areas and probable resistance areas keeping in mind the likelihood of more upside in the medium to long term based on the studies of Ichimoku & Fibonacci
Happy investing

GOLDHello & welcome to this analysis
Will Gold continue to surge ahead or is it set for a pullback now.
In this video I have covered the levels for Gold Comex as well as Gold MCX & Gold ETF
All the best

NiftyHello & welcome to this analysis
The index which attempted a bounce on Tuesday failed to breach above 23250, today it is again witnessing selling pressure.
A bullish Harmonic Alt Shark could pause/stop this decline near 22675 which is the lower trendline of a falling channel apart from it being the monthly Ichimoku support area.
Further decline could take it to 22400 where it has a Bullish Harmonic Gartley.
Short covering as of now is appears to be only above 23175
The risk reward going forward still remains in favour of short side trades

Hindustan UnileverHello & welcome to this analysis
FMCG sector appears to be doing better then other sectors after a very long time with Hindustan Unilever having a large weightage in the sector
Strength signal -
Since 2008 it has never violated the Quarterly Ichimoku Base line nor the Monthly Ichimoku Cloud. Near these support levels it becomes a very attractive value buy. This time also in 2024 it did the same.
After giving a Cup & Handle breakout in the weekly time frame its seen a pullback since October 2024 along with the rest of the market. In the last 3 weeks its gone sideways whereas we have seen other sectors continue to see sharp selling. Once again highlighting that current level is seeing consistent buying support. The pullback appears to have been completed as it bounced back from its rising trend line.
A daily falling wedge breakout has also witnessed a pullback now. As long as it now holds the rising trendline at 2350 it has good potential for upside suggesting a decent low risk high reward set up from short to medium term.
Upside levels one can look out for above 2400 are at 2700 / 3100 / 3300 / 3600
All the best for your trading and investing
My last video on the stock link is shared

PSU BANKSHello & welcome to this analysis
PSU Banks which had been outperforming Private Banks and the broader market since 2020 have since June 2024.
It has for now stopped the lower high formation, for more strength it needs to sustain above 7250 and confirm a higher low formation.
Happy Investing & Trading

SILVERHello & welcome to this analysis
In the short term it appears to be under pressure mainly due to the strength seen in DXY.
In the medium to long term its in the completion of a very large breakout, we might not see the current price level for decades after 1-2 quarters of 2025
All the best for your Investing and Trading

HANG SENG / MIRAE ETFHello & welcome to this analysis
Hang Seng will it turn up from here or will it remain an underperformer compared to other global indexes.
Covered the index and Mirae ETF for HK
Happy Investing

IOCHello & welcome to this analysis
Stock in weekly has made a double top formation. Failure to hold 130 could take it down to 90 which is its breakout area.
Short covering above 142 with resistance at 150 in the short term and 180 in the medium term
Happy investing and good luck with your trading

KOTAK BANKHello and welcome to this analysis
The bank has been an underperformer against both Bank Nifty & Nifty since 2020.
It has been in a sideways range of 1625 - 2000 since the last 40 months.
Short covering above 1760 with a bullish harmonic bat near 1640
Happy Investing

Life Insurance Corporation of IndiaHello & welcome to this analysis
Stock has been very turbulant since its listing.
Initially a sharp disappointment for IPO investors and then a super duper rally from lows giving investors a 100% return.
However in the last few weeks its gone into a sideways zone.
Resistance at 1000-1050 with support at 850-800
Good stock to accumulate if 800 holds for decent upside

Lemon Tree HotelsHello & welcome to this analysis
Stock has gone 10x in the last 4 years (pandemic lows till now)
In between it had seen a correction which was less in terms of price but more in terms of time (4 months)
Currently resistance at 135 and then 150 with support at 110-100
Overall looks good to add on dips for upside.
Happy Investing

SBI CARDSHello & welcome to this analysis
Stock has been a major underperformer continuously making lower high and lower low.
In the immediate short term it needs to start sustaining above 720 to witness short covering and then above 750 it could witness institutional buying.
Failure to hold 690 on daily an 680 on weekly basis could lead to further weakness.
All the best with your investing and trading

UNION BANK OF INDIAHello & welcome to this analysis
Bank stock currently consolidating near a support in short term appears wobbly.
Below 125 it could slip down to 110-90 where it could once again see smart money buying it.
Resistance for now between 145-155, only above that in my opinion it would see any upside momentum
Overall medium to long term outlook appears very bullish, dips would be an opportunity to add.
Happy Investing
