BTCUSDT/ETHUSDT WEEKLY ANALYSIS 17/11/2025 - 23/11/2025Wassup Lads!!
As discussed earlier we wanted BTC to take out the lows on the daily Time frame.
BTC has taken out the lows forming a potential SMT, to confirm this reversal I would like to see price form a swing point on Daily Time Frame with a Fair Value Gap for additional confirmation before looking for longs.
Plan for next week -
1. Wait for price to print more data
2. Wait for daily swing point for longs
3. Look for potential Longs
As always maintain risk and stay disciplined. Keep winning!!
Ict

TRADE JOURNAL GBPUSD LONG 13/11/2025Wassup Lads!!
As discussed earlier we were looking to go long after either eurusd or gbpusd tapped into the daily FVG, so yesterday gbpusd tapped into the daily FVG turtle souping the lows, confirmed long by the strong rejection and formation of a bullish orderflow. I had set an alert on the orderblock candle and decided to enter the next day during London open. Got excited for the entry ⛔ (bad decision) and entered with a higher risk (1.6%) so had to exit on 1R cause my brain is not used to seeing numbers above 1% in profit column (I usually risk 0.5% and target 1% reward), so I exited at 1R around 1.6 % Gain. Enough for me. It's a game of discipline, if I had let it run it would've reinforced bad habits. Good win but overall a bad trade as I didn't stick to my rules (not managing risk).
Good Luck bois, keep winning!!

Trade Journal 13/11/2025 XAUUSD SellsI took the same setup as I took yesterday, Gold took out London Highs and Silver failed to do so. Entered on the close of 15m candle.
As customary exited at 2Rs.
Simple time based divergence model.
This model has formed thrice this week, stopped out once, exited at a small loss yesterday and today hit 🎯
As always, manage your risk and keep winning!!

XAUUSD Short idea 12/11/2025Wassup Lads!!!!! Yeah cmonnnn, we're on a winning streak overall. So this is basically purely a time based model, it's simple nothing complex. Gold has taken out London highs and caused a change in the state of delivery, we'll look to go lower for a 2R Win. C'MON!! Let's keep winning!!

GU Shorts 12/11/2025As discussed earlier looking for price to move into the daily FVG on either EU or GU, there's SMT on Daily Time frame between these bros at the highs, and we're in a bearish orderflow, so I'm looking for a continuation setup in Newyork, selling from the bearish FVG if MY SETUP FORMS THERE.
There's also smt at the lows and if it invalidates the bearish FVG I'll not be taking any trades.
Thank you and manage your risk bois.
Keep Winning!

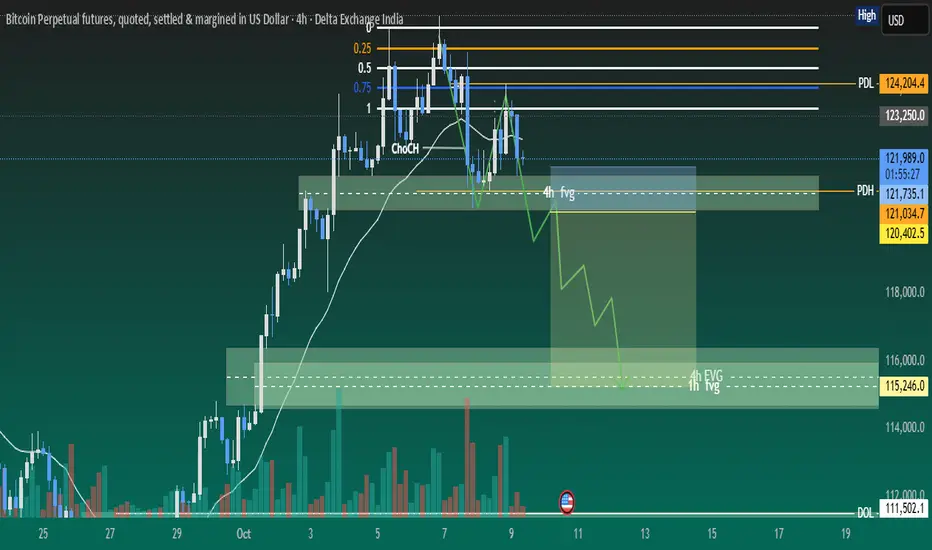
BTC 8R Sell scenario.........BTC is in downtrend in daily timeframe and shown sniper delivery, now it is in pullback mode. We may anticipate a good short term trade on hourly time frame around hourly FVG
1. HTF MSS is already done and price is reverting to FVG after BOS.
2. Daily quadrant cluster is also falling around FVG. Which is giving us some more critical levels of price reversal.
3. RSI has already shown bearish divergence on hourly TF.
4. Most probably price will take liquidity of FVG and create MSS/CISD/TS/iFVG in LTF.
5. Price should show rejection/reversal in respective LTF (5m/15m) at FVG zone.
6. Take the trade only once clear entry model i.e. turtle soup. iFVG break, CDS or MSS happens on LTF
All these combinations are signalling a high probability and ~8R trade scenario.
Note – if you liked this analysis, please boost the idea so that other can also get benefit of it.
Also follow me for notification for incoming ideas.
Also Feel free to comment if you have any input to share.
Disclaimer – This analysis is just for education purpose not any trading suggestion. Please take the trade at your own risk and with the discussion with your financial advisor.

XAU Short 11/11/25 Newyork session I am seeing SMT between Gold and Silver on London Highs and Asian Highs both, combined with a Change in State of Delivery. This is totally a time based setup not using PD Arrays.
Do your own research

EURUSD Trade Idea Shorts Tuesday/Wednesday WASUPPP LADSSS!
Yeah EU/GU are in a bhllish orderflow, I'm expecting them to continue higher but not before retracing back into the daily bullish Fair Value gap. So GU has printed a H4 Bearish FVG and there's smt between EU and GU on the Daily Time Frame. I'm expecting a second smt to push price lower into the daily fair value gap before continuing upwards, so short term i would be looking for sells.
So this is the plan, in London -
If price creates an smt divergence with DXY/GBP/USDCHF I would look for shorts to the daily bullish fair value gap, this is basically an ERL to IRL play.
This is just an idea, it has necessary conditions which need to be met to be acted upon, like smt and a bearish orderflow on the 15m timeframe. If these two conditions are met I would look for shorts, unless price decides to continue going higher. Thank you and keep winning!!!

ETHUSDT/BTCUSDT Short idea 11/11/2025Wassup Lads!
This looks like a very enticing short setup simply because
1. Price in a daily bearish fair value gap
2. We have SMT Divergence between BTC and ETH on the daily time frame
Switching over to the H1 time frame I'm clearly seeing price print out a bearish orderflow, I have not yet entered but will look to enter a sell postion on retracement to the H1 Bearish fair value gap, targeting a basic 1 to 2 risk to reward ratio. So basically, if price retraces to the h1 bearish fair value gap I'll look for shorts or I'm happy waiting on the sidelines for a new setup.
As always -
1. Manage your risk
2. Stay disciplined
3. Do your own research
One wrong trade can spoil months of discipline
Keep winning!!

Trade Journal 4th trade -:10/11/25 - GBP SellWassup Lads!
So this was a trade I took which I exited at B.E., it was a risky sell - basically a counter trade in a bullish orderflow. I took it but exited it on a small profit because I was not feeling confident.
Anyway talking about the trade, this was totally a time based setup -
The reason for the trade -
1. SMT Divergence between EU and GU on the daily time frame
2. Second Stage SMT between EU and GU (London highs)
Two stage SMT confirmed the reversal but I didn't have much confidence considering the overall bullish orderflow.
Keep winning bois!

Trade Journal Trade 3 - EURUSD - 10/11/2025Wassup Lads!
Took this trade today and got a 2R win, good start to the trading week.
Coming to the trade, price was in a bullish orderflow on EURUSD and had tapped the 4H internal liquidity (FVG)
Confirmed the momentum by smt with USDCHF and also in London Open. Time and Price both Aligning.
Target was a simple 2R.
Good Trade. Keep Winning Boys.

Gold weekly Outlook 10/11/2025 - 14/11/2025Wassup Lads!
So Gold, this looks very interesting, gold right now is in a very trappy orderflow, it's supported by a bullish weekly fair value gap on the downside and is facing resistance by a daily bearish fair value gap, if you drop down further to the 4h time frame, no keylevels are respected totally, indicating side ways movement.
So there's three possibilities -
1. We take out buyside and go to the sellside
2. We inverse the daily bearish fair value gap, then retest and continue higher
3. We take out the lows and create a bullish daily fair value gap
Honestly speaking, any of these 3 is possible. So it's a good idea tp stay away from gold for now unless you have an intra day A+ setup at play.
Gold looks interesting let's wait and watch.
Keep in mind to -
1. Stay disciplined
2. Manage your risk
3. Do your own research
Let's win this week

EURUSD Weekly Outlook - 10/11/205 to 14/11/2025Wassup Lads!
So this week we can see that EU closed sharply into the week rejecting the lows, there's a strong rejection candle on the weekly time frame and price has displaced higher forming a daily swing point and a daily fair value gap as well, so what I would be looking for price is to do this -
1. Price range on Monday
2. Manipulte into the daily fair value gap.
3. Look for smt divergence during key times
4. Would look for longs
This is my plan for EU this coming week.
Do your own research, manga risk and stay disciplined bois.
Let's win this week!

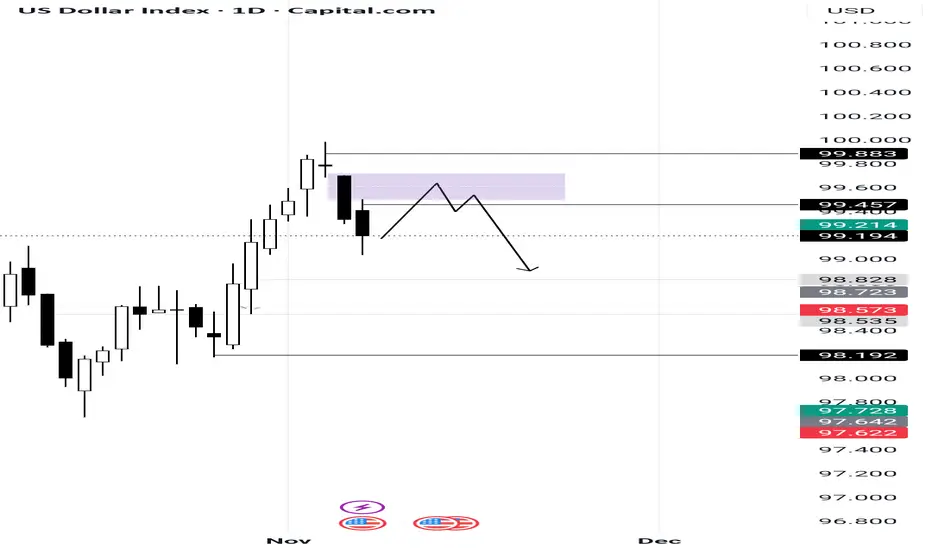
DXY Weekly Outlook 10/11/2025 - 14/11/2025Wassup Lads!
The dollar index has closed sharply into the weekly range and has formed a daily swing point and a strong rejection candle on the weekly time frame. I am expecting dollar to retrace to the bearish daily fair value gap and continue lower.
I recommend you to -
1. Maintain your risk
2. Stay disciplined
3. Do your own research
Let's win the week
My Journal Trade 2 - ETHUSDT LONGThis was a counter trade in a downtrend, low probability and also weekend, however it looked super clean and I took it. Coming to the trade
1. SMT between PDLs b/w ETH and BTC
2. Price tapped into H4 FVG
3. Smt with BTC in the H4 FVG
4. Target a basic 1 to 2 Risk to Reward
So this was a success. A risky one in a downtrend though, took it because it has all the elements of a good trade setup barring the time.

CRYPTO WEEKLY OUTLOOK 10/11/25 - 17/11/25Wassup Lads! So crypto is clearly in a downtrend as of now targeting pending daily sell side liquidity but it's also in a monthly key level that is a fair value gap, so what I am expecting price to do now is take out the pending lows on the daily timeframe on BTCUSDT and inverse the daily fair value gap, this would also cause an SMT Divergence with ETHUSDT signalling a shift in orderflow. So right now it's headed lower.
This is my plan,
1. Sell to the lows
2. Wait for an inversion of the daily bearish fair value gap on BTCUSDT, to confirm a reversal for buys.
Remember to -
1. Manage Risk
2. Do your own research
3. Stay Disciplined

Weekly analysis BTC with 4R trade ideaLast weeks’ trade has performed well and already moved ~15K points and still going on. Further to this week analysis, we expect good reversal trade from the zone of 89700 to 90385. Still we have ~11k points movement pending to reach to this level. Price would be showing weakness in sell side and reversal pattern. We should patiently wait for entry model and confirmation as price is in sell side.
1. 1D FVG and wick is creating strong cluster of their relevant CE levels.
2. We would see exaction in sell side movement and reversal pattern.
3. RSI will also show oversold or bearish divergence on HTF.
4. Most probably price will take liquidity of FVG and create MSS/CISD/TS/iFVG in LTF.
5. Price should show rejection/reversal in respective LTF (1H/15m) at FVG zone.
6. Take the trade only once clear entry model i.e. turtle soup. iFVG break, CDS or MSS happens on LTF
All these combinations are signalling a high probability and ~4R trade scenario.
Note – if you liked this analysis, please boost the idea so that other can also get benefit of it.
Also follow me for notification for incoming ideas.
Also Feel free to comment if you have any input to share.
Disclaimer – This analysis is just for education purpose not any trading suggestion. Please take the trade at your own risk and with the discussion with your financial advisor.
,
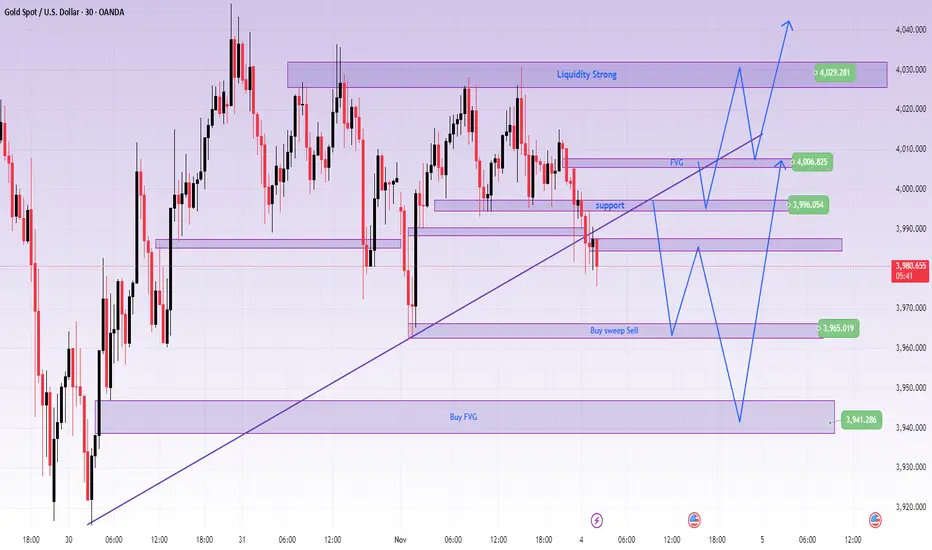
GOLD IS SETTING UP FOR ANOTHER BULLISH RUN — BUY THE DIP BEFORE November 7, 2025 — GOLD Daily Trading Plan 💰
🎯 Bias: LONG Setup (Buy the Dip)
Gold continues to show bullish market structure after multiple BOS (Break of Structure) confirmations on both intraday and H1 charts.
Price has reacted from the previous demand area 3969–3977, leaving a clean FVG below, suggesting unfilled imbalance and potential liquidity resting underneath.
At the moment, XAUUSD is hovering near 4007, approaching a minor supply zone at 4018–4020. I expect price to potentially sweep liquidity above 4018, then retrace back toward 3975–3969 to form a higher low before continuing its bullish leg.
Key confluences supporting the long bias:
✅ Multiple BOS and CHoCH shifts confirm bullish intent.
✅ FVG + Volume Gap below aligns with a discount zone for entries.
✅ Structural higher low formation still intact as long as price holds above 3965.
📌 Trade Plan:
🟩 Buy Zone: 3977 – 3969
⛔ Stop Loss: 3963 (max 6 points)
🎯 Take Profit 1: 4005
🎯 Take Profit 2: 4018
If price decisively breaks above 4020, expect continuation toward 4035–4040, but intraday traders should secure profits around the 4018 zone.
In case of a deeper retracement, watch for liquidity grabs near 3965–3950 FVG before another bullish push.

GOLD TRADING INSIGHTS TODAY WITH LUCYGOLD TRADING INSIGHTS TODAY WITH LUCY 💛
Hello everyone 🌸
The gold market (XAUUSD) today is showing many interesting signals as the price continues to test the crucial trendline area. Traders' sentiment is quite cautious at the moment – both buyers and sellers are “squaring off” around the liquidity balance zone.
🔍 Technical Analysis
On the chart, gold is moving within a narrowing triangle price channel – this indicates momentum is accumulating, and when the price breaks in either direction, the subsequent volatility will be very strong ⚡
Currently, the price is reacting around the main trendline, but there is no clear breakout signal yet.
In my personal view, the probability of a decline remains higher, however, further confirmation is needed before entering a trade.
The important point to note is the support area at 3965, which is the key boundary to confirm a clear downtrend.
If the price breaks through this area, the possibility of extending towards the Fibonacci 2.618 area around 3890 is entirely possible.
⚙️ Price Levels to Watch
Currently, the 3990 – 4012 area is short-term resistance, where sellers may reappear.
Meanwhile, the 3965 – 3945 – 3920 areas are the main supports that need close observation.
If the price continues to hold above 3945, the likelihood of a short-term rebound is quite high.
🎯 Today's Trading Scenario
💼 Buy: 3945
⛔ SL: 3938
🎯 TP: 3958 – 3977 – 3992 – 4012
💼 Sell: When the price clearly breaks below support 3965
⛔ SL: Above the breakout area
🎯 Expected TP: extending towards the Fibonacci 2.618 area around 3890
I still prefer to observe the price reaction at the trendline area, and only act when there is clear confirmation — because in a triangle pattern, the patient one will always be the winner 🌙
⚠️ Note & Conclusion
The above analysis reflects only Lucy's personal perspective, based on Trendline – Fibonacci – ICT factors 📊
This is not investment advice.
Please share your views on gold in the comments section 💬
And don't forget to follow Lucy for daily updates on insightful analyses —
where technical analysis merges with market emotions 💫🌸

GOLD CONFIRMS SHORT-TERM DECLINE AFTER BREAKING TRENDLINEXAUUSD – GOLD CONFIRMS SHORT-TERM DECLINE AFTER BREAKING TRENDLINE
🪞 1. Overview
🌤️ In the Asian session this morning, gold broke the upward trendline even though the selling pressure wasn't particularly strong.
However, this is the first signal indicating that the short-term trend is leaning towards the sellers.
💬 Currently, the 3996 level is a significant resistance, and the price might retest this area before continuing to decline.
If the price surpasses the FVG at 4007, the trend might temporarily rebound in the short term.
💹 2. Technical Analysis (ICT Perspective)
🔸 Market structure: After breaking the trend, the structure temporarily shifts to short-term bearish.
🔸 Liquidity & FVG: Liquidity is drawn to the 3960–3940 area, while FVG 4007 is the first barrier.
🔸 Order Flow: Smart Money may lightly sweep up to the resistance area before pushing the price further down.
🎯 3. Reference Trading Scenarios
💔 MAIN SELL
Entry: 3996 | SL: 4004
TP: 3985 – 3972 – 3948
💢 SELL scalping
Entry: 4007 | SL: 4014
TP: 3998 – 3978
💖 REACTIVE BUY
Entry: 3965 | SL: 3957
TP: 3976 – 3988 – 3999
🌸 DEEP BUY
Entry: 3941 | SL: 3931
TP: 3955 – 3968 – 3988 – 4012 – 4066
🔍 4. Price Levels to Note
✨ 4007 → FVG resistance, short-term trend confirmation area
✨ 3996 → Retest area of the broken trendline
✨ 3965 – 3941 → Strong support area, likely to see reversal reactions
💬 5. Notes & Call for Interaction
⚠️ This is not an investment recommendation, but merely a personal technical perspective following the ICT method.
Observe the price reaction around the trendline carefully before making a decision 💭
If you find this post helpful, please 💛 like – 💬 leave a comment – 🔔 follow LanaM2
to stay updated with daily gold insights and learn more about the Smart Money Concept 🌷✨
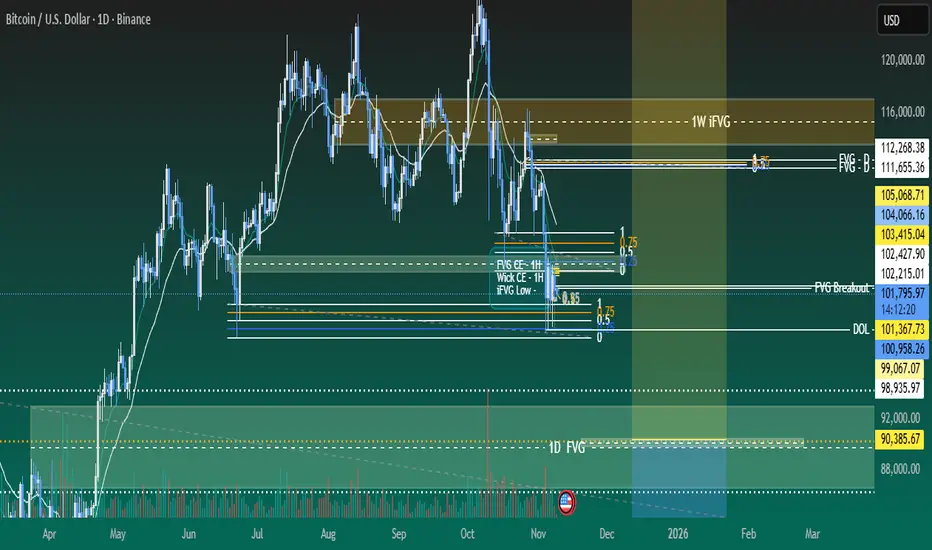
Weekly & Daily BTC analysis of 10R Opportunity........On HTF weekly and daily BTC is forming good scenarios for bearish trade. Price is consolidating at higher levels for last couple of weeks and showing value adjustment in BTC. Price already shot up a lot and we may see a short term pull back.
1. BTC has created CISD after taking liquidity at weekly level and tested weekly iFVG.
2. It has also created 1D FVG and 4H FVG and iFVG over lapping. creating cluster of CEs. Which might be a Good POI for sell side opportunity.
3. Technically we are already into a weekly down side scenario. Further price is approaching Daily and 4 Hourly FVGs for possible re-entry opportunities.
4. RSI has also already shown a bearish divergence on weekly level.
5. Most probably price will take liquidity of FVG and create MSS/CISD/TS/iFVG in LTF.
6. Price should show rejection/reversal in respective LTF (1H/15m) at FVG zone.
7. Take the trade only once clear entry model i.e. turtle soup. iFVG break, CDS or MSS happens on LTF
All these combinations are signalling a high probability and ~10R trade scenario.
Note – if you liked this analysis, please boost the idea so that other can also get benefit of it. Also follow me for notification for incoming ideas.
Also Feel free to comment if you have any input to share.
Disclaimer – This analysis is just for education purpose not any trading suggestion. Please take the trade at your own risk and with the discussion with your financial advisor.

BTC forming wonderful scenarioBTC is forming good scenarios for bullish and subsequently bearish trade. It has created ABC pattern and retracing back to bullish FVG. We need to wait for price getting into right zones. We may also see a sell side trade once reaches to bearish FVG.
1. Currently price has broken ABC pattern neckline and retracing towards 1h FVG.
2. We may also see a sell side trade once price tap into bearish FVG and shows reversal pattern.
3. Most probably price will take liquidity of FVG and create MSS/CISD/TS/iFVG in LTF.
4. Price should show rejection/reversal in LTF (5m,1m) at FVG zone.
5. Take the trade only once clear entry model i.e. turtle soup. iFVG break, CDS or MSS happens on LTF
All these combinations are signalling a high probability and ~4R trade scenario.
Note – if you liked this analysis, please boost the idea so that other can also get benefit of it. Also follow me for notification for incoming ideas.
Also Feel free to comment if you have any input to share.
Disclaimer – This analysis is just for education purpose not any trading suggestion. Please take the trade at your own risk and with the discussion with your financial advisor.

BTC is developing ~4R down side tradeBTC has done MSS on 4h time frame and showing rejection at 4H FVG after displacement. We can see a good downside trade once below FVG is mitigated and changed to iFVG. We need to wait for price getting into right zones.
1. Currently price is moving inside 4H FVG after displacement and showing rejection as well.
2. Price should break below FVG and retest.
3. There are several SIBIs which may be target for it and further buy side reversal trade.
4. RSI has already shown bearish divergence. Which support coming down move.
5. Most probably price will take liquidity of FVG and create MSS/CISD/TS/iFVG in LTF.
6. Price should show rejection/reversal in LTF (5m,1m) at FVG zone.
7. Take the trade only once clear any of the entry model i.e. turtle soup. iFVG break, CDS or MSS happens on LTF
All these combinations are signalling a high probability and ~4R trade scenario.
Note – if you liked this analysis, please boost the idea so that other can also get benefit of it. Also follow me for notification for incoming ideas.
Also Feel free to comment if you have any input to share.
Disclaimer – This analysis is just for education purpose not any trading suggestion. Please take the trade at your own risk and with the discussion with your financial advisor.