XAUUSD – H1 Outlook: New All-Time HighXAUUSD – H1 Outlook: New ATH, Now Watch the Pullback Structure | Lana ✨
Gold has printed fresh all-time highs and is now trading near the $5,100 psychological area. After six consecutive bullish sessions, the trend is still strong — but at these levels, the market often needs a controlled pullback to rebalance liquidity before the next expansion.
📌 Quick Summary
Trend: Bullish (strong momentum, new ATH)
Timeframe: H1
Focus: Don’t chase highs → wait for pullback into structure
Key idea: Pullback → hold support → continuation toward upper supply
📈 Market Structure & Price Action
Price is moving inside a bullish expansion leg, and the current area is a typical “extended” zone where volatility can increase.
A pullback toward the first clean structural support is healthy and often needed after a steep rally.
As long as price holds above key supports, the bias remains continuation, not reversal.
🔍 Key Zones From the Chart
1) Upper Supply / Profit-taking Area
5100–5130 (approx.)
This is the area where price is likely to face selling pressure / profit-taking, especially after a vertical rally.
2) Primary Support (Pullback Buy Zone)
5000–5020
This is the most important “structure retest” area on the chart — a logical zone for price to rebalance before continuation.
3) Deeper Value Zone (If Pullback Extends)
4750–4800 (Fibo value cluster on chart)
If the market pulls deeper, this becomes the more attractive value zone to watch for stronger reactions.
4) Major Demand Zone (Extreme Support)
4590–4630 (lower purple demand area)
This is a deeper base zone if the market shifts into a larger correction.
🎯 Trading Scenarios (Structure-Based)
✅ Scenario A (Primary): Buy the Pullback Into Structure
Buy Entry: 5005 – 5015
SL: 4995 – 5000 (8–10 points below entry)
TP Targets (scale out):
TP1: 5065 – 5075 (retest of recent high)
TP2: 5100 (psychological milestone)
TP3: 5125 – 5135 (upper supply / extension zone)
TP4: 5150+ (if breakout accepts)
Idea: Let price come back to support, confirm, then ride the trend — no chasing.
✅ Scenario B (Alternative): Deeper Pullback Into Value
If price fails to hold 5000–5020 and dips deeper:
Buy Entry: 4760 – 4790
SL: 4750 – 4755
TP Targets:
TP1: 4900
TP2: 5000
TP3: 5100
TP4: 5125 – 5135
🌍 Macro Context (Short & Relevant)
Gold’s upside momentum is being supported by:
Safe-haven flows amid ongoing geopolitical and trade uncertainty
Expectations of further Fed easing
Continued central bank buying
Strong inflows into ETFs
This backdrop helps explain why pullbacks are more likely to be profit-taking and positioning, not a structural trend change.
✨ Lana’s View
Gold is bullish — but the best trades usually come from patience, not excitement.
At ATH levels, Lana prefers buying pullbacks into structure, scaling out into targets, and letting the market do the work.
Ictconcepts

Weekly Analysis of BTC - Detailed Another week and price still moved as expected in same range. No major view change since last prediction for long term trades.
Further short-term view.
Week is closed bearish and may target recent draw on liquidities of ~84K. Price may move in choppy mode for some time. So, the best idea is to look for small trade rather than long swing trades.
As the market in rangebound/Choppy, so we should keep eye on both side Opps but focus on down side as next high-level draw on liquidity is at downside.
Refer previous details below for larger perspective…
We analysed three weeks back that BTC would be in range for some time before taking any further move, And BTC is following same analysis and trapped within a small range since then. BTC prediction of last week also worked perfectly well and market kept in consolidation mode itself. BTC is still in consolidation zone and may spend some more days. It may develop ABC pattern or reversal at identified daily FVG level, if price has to change its delivery and take turn from here. This zone is kind of make or break. If price is not able to sustain and breakdown, then it may witness ~65-70K levels as well.
We hope for reversal from this level as price is developing the pattern at higher time frame.
1. Price has taken liquidity or 82K and almost touched 80K.
2. It has inversed 1Day FVG and now price is consolidating in the range between EMAs.
3. We may expect price retracement till 1D iFVG and then reversal.
4. Before to that we may see sweep of 92900 (1D CISD) level and then a retracement short trade till 1D FVG
5. Most probably price will take liquidity of FVG/RDRB level and create MSS/CISD/TS/iFVG in LTF.
6. Price should show rejection/reversal in respective LTF (5m/15m) at FVG zone.
7. Take the trade only once clear entry model i.e. turtle soup. iFVG break, CDS or MSS happens on LTF
All these combinations are signalling a high probability trade scenario.
Note – if you liked this analysis, please boost the idea so that other can also get benefit of it.
Also follow me for notification for incoming ideas.
Also Feel free to comment if you have any input to share.
Disclaimer: This analysis is for educational purposes only and does not constitute investment advice. Please do your own research (DYOR) and check with your financial advisor before making any trading decisions.

XAUUSD – H1: Strong UptrendXAUUSD – H1 Technical Outlook: Extension Risk Near Highs as Geopolitical Tension Builds | Lana ✨
Gold continues to trade in a strong bullish structure, with price pushing higher along an ascending trendline. However, as the market approaches upper resistance zones, price action suggests the rally may be entering a more sensitive phase, where extension risk and volatility increase.
📈 Market Structure & Price Action
The short-term trend remains bullish, with price respecting the rising trendline.
Recent price action shows strong impulsive buying, followed by shallow pullbacks — a sign of aggressive demand.
However, price is now trading near the upper boundary of the trend channel, where upside continuation often becomes less efficient and more reactive.
The current structure favors continuation, but risk increases as price stretches further from value.
🔍 Key Technical Zones on H1
Immediate resistance / reaction zone: 4987 – 5000
This area represents a short-term ceiling where price may hesitate or form a temporary consolidation.
Sell zone (extension area): 5053 – 5070
A premium zone where upside becomes increasingly extended and profit-taking or corrective reactions are more likely.
Key support & value zones below:
4663 – 4629 (prior acceptance + structural support)
4595 – 4570 (deeper value area aligned with Fibonacci retracement)
These lower zones remain important reference points if price transitions from extension into correction.
🎯 Trading Scenarios
Primary scenario (bullish continuation):
If price consolidates above 4987 and accepts higher, the market may extend into the 5053–5070 zone. Any move into this area should be monitored closely for exhaustion signals rather than late breakout chasing.
Alternative scenario (pullback into structure):
Failure to hold above 4987–5000 could trigger a corrective move back toward 4663–4629, where buyers may look to re-engage at better value.
Lana prefers waiting for reactions at key zones, not chasing price when it is already extended.
🌍 Geopolitical Context (Why Volatility Matters Now)
Recent reports indicate that the USS Abraham Lincoln carrier strike group has entered the Indian Ocean, with expectations of moving toward the Arabian Sea in the coming days. The increased U.S. military presence in the Middle East, amid concerns of potential escalation involving Iran, adds a layer of geopolitical uncertainty.
Historically, such developments tend to:
Increase short-term volatility in gold
Support gold as a hedge, while also triggering sharp profit-taking swings
This backdrop reinforces the importance of risk management and patience, especially when price is trading near premium zones.
🧠 Lana’s Perspective
Gold remains bullish, but not every bullish phase is a good place to buy. As price trades higher into premium and extension zones, Lana focuses on structure, value, and reaction, not emotional momentum.
✨ Respect the trend, manage extension risk, and let price come to your levels.

XAUUSD (H3) – Liam PlanXAUUSD (H3) – Liam Plan
Late-stage expansion | Look for distribution and sell reactions
Quick summary
Gold has rallied aggressively and is now trading in late-stage bullish expansion, sitting near premium pricing after multiple impulsive legs.
On the macro side, political commentary from Europe highlights a structural shift in global power:
Europe’s influence is weakening as US–Russia discussions bypass Brussels.
BRICS and SCO now represent over half of the world’s population.
Calls for renewed EU–Russia energy cooperation underline long-term uncertainty in Europe’s geopolitical positioning.
This backdrop keeps gold structurally supported, but at current levels, risk shifts toward distribution rather than clean continuation.
Macro context (supportive, but asymmetric risk)
The global balance of power continues to shift from West to East, reinforcing long-term demand for hard assets.
However, much of the near-term geopolitical premium is already priced in after the recent vertical move.
Result: upside continuation is possible, but risk/reward now favors reaction sells over fresh buys.
➡️ Conclusion: don’t fight the macro trend, but don’t chase price either.
Technical view (H3 – based on the chart)
Gold remains in a broader uptrend, but price action shows signs of deceleration and potential distribution near the highs.
Key levels from the chart:
✅ Premium sell zone: 5000 – 5050 (upper range / distribution area)
✅ Sell reaction zone: 4920 – 4950 (local highs / rejection area)
✅ Bullish retracement support: 4700 – 4750 (fib + structure)
✅ Major liquidity / deep support: 4350 – 4450
Price is trading far above equilibrium, increasing the probability of rotation back into value or sell-side liquidity.
Trading scenarios (Liam style: trade the level)
1️⃣ SELL scenarios (priority – late-stage reaction)
A. SELL at premium / distribution zone
✅ Sell: 5000 – 5050
Condition: clear rejection / loss of momentum on M15–H1
SL: above the high
TP1: 4920
TP2: 4750
TP3: 4450 (if distribution expands)
Logic: Late-stage rallies often form rounded tops or distribution patterns before rotating lower. This zone favors risk-defined shorts, not breakout buys.
B. SELL lower high / reaction
✅ Sell: 4920 – 4950
Condition: failure to hold highs + bearish shift on lower TF
TP: 4750 → 4450
Logic: This area acts as a reaction zone inside the distribution range — ideal for tactical sells.
2️⃣ BUY scenario (secondary – value only)
BUY only at deep retracement
✅ Buy zone: 4350 – 4450
Condition: liquidity sweep + strong bullish reaction
TP: 4700 → 4920
Logic: This is the first area where long-term buyers regain a clear R:R edge. No interest in buying above value.
Key notes
Late-stage trends punish impatience.
Avoid mid-range entries.
Expect false breakouts near the highs.
Confirmation > conviction.
What’s your bias here:
selling distribution near the highs, or waiting patiently for a deeper pullback into 4700–4450 value?
— Liam

XAUUSD (H4) – Liam Buying StrategyXAUUSD (H4) – Liam Continuation Plan
Trend remains strong, but price is extended | Buy pullbacks, not highs
Quick summary
Gold continues to trade firmly within a strong bullish structure. Macro pressure on safe-haven demand has eased slightly as US–EU geopolitical and trade tensions cool, while rising oil prices (supported by Saudi Aramco’s demand outlook) keep inflation expectations alive.
Despite the bullish trend, price is currently extended near the upper range, so execution today should focus on buying pullbacks at structure, not chasing breakouts.
Macro context (supportive, but less explosive)
Reduced geopolitical friction between the US and Europe has eased panic-driven flows.
Oil prices pushing higher keeps inflation expectations sticky, limiting downside pressure on gold.
USD remains relatively stable (USD/CAD holding firm), suggesting gold strength is structure-driven rather than pure fear trade.
➡️ Conclusion: trend-friendly environment, but volatility is now more technical than headline-driven.
Technical view (H4 – based on the chart)
Gold is respecting a clean ascending trendline, with impulsive legs followed by shallow pullbacks.
Key levels from the chart:
✅ Upper extension / continuation target: 5000+ zone
✅ Bullish continuation buy zone: 4580 – 4620 (previous breakout + fib support)
✅ Trendline support: dynamic (ascending)
✅ Deeper correction support: 4400 – 4450
Price is currently trading above the 1.618 fib expansion, which increases the probability of short-term consolidation or pullback before continuation.
Trading scenarios (Liam style: trade the level)
1️⃣ BUY scenarios (priority – trend continuation)
A. BUY pullback into structure (preferred setup)
✅ Buy zone: 4580 – 4620
Condition: hold above trendline + bullish reaction on M15–H1
SL: below structure / trendline
TP1: recent high
TP2: 4900
TP3: extension toward 5000+
Logic: This zone aligns with prior resistance turned support and fib retracement — a higher-probability continuation entry than buying highs.
B. BUY deeper dip (only if volatility increases)
✅ Buy zone: 4400 – 4450
Condition: strong rejection / liquidity sweep
TP: 4580 → 4800+
Logic: This is the last clean structural support within the current trend. A dip here would likely be corrective, not trend-ending.
2️⃣ SELL scenario (counter-trend, tactical only)
❌ No swing SELL bias while price holds above the ascending trendline. Shorts only make sense as very short-term scalps at highs with clear lower-TF rejection.
Key notes
Strong trends punish impatience — wait for pullbacks.
Avoid entries mid-leg after impulsive candles.
If price accelerates vertically without retrace, stand aside.
What’s your approach: waiting for the 4580–4620 pullback to join the trend, or staying flat until a deeper correction toward 4450?
— Liam

XAUUSD – H2 Technical AnalysisXAUUSD – H2 Technical Outlook: Liquidity Pullback Within a Strong Bullish Structure | Lana ✨
Gold continues to trade within a well-defined bullish structure on the H2 timeframe. The recent surge was impulsive, followed by a healthy retracement that appears to be rebalancing liquidity rather than signaling a trend reversal.
Price action remains constructive as long as the market respects key structural levels and the ascending trendline.
📈 Market Structure & Trend Context
The overall trend remains bullish, with higher highs and higher lows still intact.
Price continues to respect the ascending trendline, which has acted as reliable dynamic support throughout the uptrend.
The recent pullback occurred after an aggressive upside expansion, fitting the classic sequence:
Impulse → Pullback → Continuation
No clear distribution pattern is visible at this stage. As long as structural support holds, the bias remains BUY on pullbacks, not selling strength.
🔍 Key Technical Zones & Value Areas
Primary Buy POC Zone: 4764 – 4770
This area represents a high-volume node (POC) and aligns closely with the rising trendline.
It is a natural zone where price may rebalance before resuming the bullish trend.
Secondary Value Area (VAL–VAH): 4714 – 4718
A deeper liquidity zone that could act as support if sell pressure temporarily increases.
Near-term resistance: 4843
Acceptance above this level strengthens the continuation scenario.
Psychological reaction zone: 4900
Likely to generate short-term hesitation or profit-taking.
Higher-timeframe expansion targets:
5000 (psychological level)
2.618 Fibonacci extension, where major liquidity may be resting.
🎯 Trading Plan – H2 Structure-Based
✅ Primary Scenario: BUY the Pullback
Buy Entry:
👉 4766 – 4770
Lana prefers to engage only if price pulls back into the POC zone and shows bullish confirmation on H1–H2 (trendline hold, strong rejection of lower prices, or bullish follow-through).
Stop Loss:
👉 4756 – 4758
(Placed ~8–10 points below entry, beneath the POC zone and the ascending trendline)
🎯 Take Profit Targets (Scaled Exits)
TP1: 4843
First resistance zone — partial profit-taking recommended.
TP2: 4900
Psychological level with potential short-term reactions.
TP3: 5000
Major psychological milestone and upside expansion target.
TP4 (extension): 5050 – 5080
Area aligned with the 2.618 Fibonacci extension and higher-timeframe liquidity.
The preferred approach is to scale out gradually and protect the position, adjusting risk as price confirms continuation.
🌍 Macro Context (Brief)
According to Goldman Sachs, central banks in emerging markets are expected to continue diversifying reserves away from traditional assets and into gold.
Average annual central bank gold purchases are projected to reach around 60 tons by 2026, reinforcing structural demand for gold.
This ongoing accumulation supports the idea that pullbacks are more likely driven by positioning and profit-taking, rather than a shift in long-term fundamentals.
🧠 Lana’s View
This remains a pullback within a bullish trend, not a bearish reversal.
The focus stays on buying value at key liquidity zones, not chasing price at highs.
Patience, structure, and disciplined execution remain the edge.
✨ Respect the trend, trade the structure, and let price come to your zone.

XAUUSD – H2 Technical AnalysisXAUUSD – H2 Technical Outlook: Pullback Builds Value Before the Next Expansion | Lana ✨
Gold continues to trade within a strong bullish structure on the H2 timeframe. The recent rally was clearly impulsive, and the current move looks like a technical pullback to rebalance liquidity, not a trend reversal.
📈 Market Structure & Trend Context
XAUUSD remains bullish, with the higher-high / higher-low structure still intact. Price is also respecting the ascending trendline, which has acted as key dynamic support throughout this uptrend.
The current sequence aligns well with a classic bullish cycle: Impulse → Pullback → Continuation. As long as structural support holds, Lana’s primary bias remains: BUY with the trend, not sell against it.
🔍 Key Technical Zones & Value Areas
Buy POC (Value Zone): 4764 – 4770 This area aligns with a high-volume node (POC/VAH) and the rising trendline, making it a strong value zone for dip-buying opportunities.
Near-term resistance: 4843 A key level that needs to be re-accepted to confirm the next continuation leg.
Psychological reaction zone: 4900 Likely to produce hesitation, profit-taking, or short-term volatility.
Upper expansion targets: 5000 and potentially the 2.618 Fibonacci extension, where higher-timeframe liquidity may be resting.
🎯 Trading Plan (H2 Structure-Based) ✅ Primary Scenario: BUY the Pullback
Buy entry: 👉 4766 – 4770
Lana prefers to engage only if price pulls back into the POC zone and shows bullish confirmation on H1–H2 (trendline hold, clear rebound / rejection of lower prices).
Stop Loss: 👉 4756 – 4758 (Placed ~8–10 points below entry, under the POC zone and below the ascending trendline)
🎯 Take Profit Targets (Scaled Exits)
TP1: 4843 First resistance — scale partial profits and reduce risk.
TP2: 4900 Psychological level — expect possible reactions.
TP3: 5000 Major psychological objective and expansion milestone.
TP4 (extension): 5050 – 5080 Potential 2.618 Fibonacci extension / higher-timeframe liquidity zone.
Lana’s approach is to scale out into targets, then protect the position by managing risk (e.g., moving SL to breakeven once price confirms continuation).
🌍 Macro Context (Brief)
Gold remains supported by its role as a safe-haven and strategic reserve asset amid ongoing geopolitical and financial uncertainty. Recent headlines highlighting the rise in the value of large gold reserves reinforce that institutional demand for gold as a long-term hedge remains active, which supports the medium-term bullish bias.
🧠 Lana’s View
This is a pullback within an uptrend, not a bearish reversal. Lana focuses on buying value, not chasing highs. Stay patient, trade the structure, and let price come into your zone.
✨ Respect the trend, stay disciplined, and let the market come to your levels.

XAUUSD – Trend-Following StrategyXAUUSD – Trend-Following Plan: Prefer Buying the Dip (H1)
Gold is still holding a bullish short-term structure with higher highs and higher lows. The recent push up shows buyers are in control, so my main focus is NOT chasing price, but waiting for a clean pullback into key support to join the trend with controlled risk.
🎯 MAIN SCENARIO – BUY THE DIP (Priority)
Buy Zone: 4687 – 4690
Stop Loss: Below 4655
Take Profits:
TP1: 4735 – 4745
TP2: 4780
TP3: 4804 – 4808
Why this zone?
4687–4690 is the key area highlighted on the chart as a major level. After price pushed above it, this zone can act as new support (previous resistance becomes support). If price retests and holds with clear rejection (wicks, bullish engulfing, strong bounce), this is the higher-probability buy location in line with the trend.
🔁 SECONDARY SCENARIO – DEEP BUY AT LIQUIDITY / IMBALANCE
Buy Zone: 4620 – 4600 (Liquidity Imbalance area)
Stop Loss: Below 4575
Take Profits:
TP1: 4687
TP2: 4735
TP3: 4780+
Why this zone?
The chart shows a clear liquidity imbalance below price that has not been fully filled. If the market performs a deeper sweep (stop-hunt / flush), this zone becomes a strong candidate for a trend continuation buy with better R:R.
📊 TECHNICAL VIEW (What the chart is telling us)
Price is still trading within a bullish structure and respecting the rising trendline.
The latest impulse up suggests active demand, not just a weak drift.
The most logical approach is to let price come to you: buy support, not breakout candles.
The upside magnet remains the 4804–4808 area, which is also the next major reaction zone.
🌍 MACRO CONTEXT (Keep it simple)
Gold remains supported in the broader environment where risk sentiment can shift quickly.
Unless USD strength returns aggressively, pullbacks are more likely to be bought than to start a full bearish reversal.
That’s why the plan stays trend-following: wait for dips and execute with discipline.
🧠 EXECUTION RULES (Discipline > Opinions)
No FOMO buys at extended highs.
Only take the trade inside the planned zones and only with confirmation.
Risk per trade stays controlled (1–2% max). If the idea is wrong, cut it fast and reassess—no “hope trading.”
📌 SUMMARY
Bias: Bullish (H1)
Strategy: Buy the dip at 4687–4690, or deeper at 4620–4600
Targets: 4735–4745 → 4780 → 4804–4808
If you want, I can also rewrite this in a shorter TradingView-post style (more punchy, fewer words) while keeping the same levels and rules.

Greenland Tension Escalates – Gold Finds Its N Market Context (News → Capital Flow)
Escalating tensions around the “Greenland purchase” narrative are increasing geopolitical risk.
Markets are responding in a familiar pattern:
USD weakens as political uncertainty rises
Equities face corrective pressure amid risk-off sentiment
Safe-haven flows return to Gold, supporting further upside
In this environment, Gold is not rising on technicals alone,
but because defensive capital is rotating back into the market.
Technical Structure (H1 – SMC)
Price previously executed a downside Liquidity Sweep
A bullish Market Structure Shift (MSS) followed
The impulsive leg created a clear bullish FVG, signaling supply–demand imbalance
Price is currently holding above the FVG, keeping the bullish structure intact
➡️ A familiar model in play:
Liquidity Sweep → FVG → Continuation
Key Zones (Decision Levels)
Upper FVG: 4,642.447
Lower FVG: 4,622.238
Deeper support (OB): around 4,596.733
These are reaction zones, not FOMO areas.
Scenarios (If – Then)
Primary Scenario – Continuation (~70%)
If price holds above 4,622.238
The FVG is considered defended
Bullish continuation toward higher levels remains favored
Aligned with USD weakness + risk-off environment
Alternative Scenario – Pullback (~30%)
If price loses 4,622.238
A corrective move toward the OB near 4,596.733 becomes likely
Only an H1 close below the OB would materially weaken the bullish outlook
Summary
Geopolitical headlines are amplifying volatility,
but the final decision lies in price reaction at the FVG.
Gold is not chasing headlines —
it is following capital seeking safety.

XAUUSD – Intraday retracementXAUUSD – Intraday Pullback & Continuation Setup | Lana ✨
Gold is entering a technical correction phase after testing the ATH zone, while the medium-term bullish structure remains intact. Today’s move looks more like a controlled pullback to rebalance liquidity, not a trend reversal.
📉 Current Price Behaviour
Price has reacted from the ATH supply zone, forming a short-term lower high.
The market is currently testing the rising trendline, which is a key dynamic support in this bullish cycle.
As long as price holds above structural support, the broader bias stays bullish.
This correction is technically healthy after a strong impulsive leg.
🔑 Key Technical Zones to Watch
Sell test / rejection zone: ATH area
Short-term sellers are active here, causing the current pullback.
Buy zone 1: 4495 – 4498
A former value level and trendline confluence zone, suitable for reaction buys.
Buy zone 2: 4442 – 4446
Stronger support and deeper liquidity area if the pullback extends.
These zones are where buyers are expected to step back in.
📈 Trading Scenarios
Primary scenario:
Wait for price to complete the pullback into 4495–4498, then look for bullish confirmation to rejoin the trend.
Alternative scenario:
If sell pressure increases, the 4442–4446 zone becomes the key level to watch for stronger buy reactions.
A clean hold above the trendline keeps the upside structure valid, with ATH retest as the next objective.
🌍 Fundamental Context
According to CME FedWatch, the market is pricing in a 95% probability that the Fed keeps interest rates unchanged in January.
The probability of a January rate cut remains very low at 5%.
Expectations for March also lean toward no change, with rate cuts still uncertain.
This reinforces a stable macro backdrop for gold, where pullbacks are more likely to be driven by profit-taking and positioning, rather than a shift in monetary policy.
🧠 Notes
This is a pullback within an uptrend, not a bearish reversal.
Focus on buying value, not chasing highs.
Let price confirm at key zones before entering.
✨ Stay patient, respect the structure, and let the market come to your levels.

XAUUSD – Uptrend remains intactXAUUSD – The uptrend is still intact; we just need that decisive break.
Gold is maintaining a strong bullish momentum within the rising channel, consistently printing higher lows. However, price is now approaching a psychological resistance cluster, so the next move could easily include a sharp shakeout to sweep liquidity before the market commits to direction.
Macro context
In periods where markets are sensitive to news flow and interest-rate expectations, gold often finds support from safe-haven demand. But when price is trading at elevated levels, the optimal approach remains the same: don’t chase candles — only act when price reaches key technical zones.
Technical view (H1)
The primary trend remains bullish, with price respecting the rising trendline.
The current area sits in a “premium” zone (prone to profit-taking / sharp pullbacks).
Two key clusters stand out on the chart:
Near psychological resistance: 4630–4640
Next psychological resistance: 4765 (expanded upside target)
Key levels
Near resistance: 4630–4640
Major resistance: 4760–4765
Support / pivot level: 4540 (previous resistance, now potential support)
Deeper support: 4400 (base zone, only relevant if a strong reversal develops)
Trading scenarios
Scenario 1: Trend BUY (priority)
Condition: Price holds above 4630–4640 and continues forming bullish structure.
Entry: Buy the pullback at 4605–4615
SL: 4595
TP1: 4685–4700
TP2: 4760–4765
This is the cleanest setup: a mild retracement, then continuation with the trend.
Scenario 2: Safer BUY on support retest
If price spikes down to sweep liquidity:
Entry: Buy 4540–4545
SL: 4528
TP: 4630 → 4685 → 4765
4540 is a key line in the sand — as long as it holds, the uptrend stays strong.
Scenario 3: Reaction SELL (short-term only)
Only consider sells if there’s clear rejection at resistance:
Sell: 4760–4765
SL: 4778
TP: 4685 → 4635 → 4540
Or, if price fails to hold 4630–4640 and closes weak:
Sell: 4625–4635
SL: 4650
TP: 4545
Conclusion
The dominant trend remains bullish, but price is pressing into psychological resistance — so execution must be “right level, right reaction.” The priority remains buying with the trend, and only selling if there’s a clean rejection at 4765 or a confirmed failure to hold 4630–4640.
👉 If this plan helps, follow LiamTradingFX for daily XAUUSD updates as early as possible.

XAUUSD – H2 Technical OutlookXAUUSD – H2 Technical Outlook | Lana ✨
Gold continues to trade within a strong bullish structure, and price action is confirming that the market is still respecting the ascending trend channel on the H2 timeframe.
📈 Market Structure & Trend Context
The overall trend remains bullish, with higher highs and higher lows clearly intact.
Price has successfully flipped the 4445–4450 zone from resistance into support, confirming strong buyer commitment.
The impulsive leg toward the current highs suggests we are still in a continuation phase, not a distribution phase.
🔍 Key Technical Zones & Liquidity
Buy resistance flip: 4445–4450
This zone has already shown clean reactions and acts as a structural base for further upside.
POC Buy zone: 4595–4600
This is a high-volume node where price is likely to rebalance liquidity before the next expansion.
Sellside liquidity sits just below current price, making a shallow pullback into value very possible before continuation.
🎯 Bullish Scenarios
Primary plan: Look for BUY setups on pullbacks into 4595–4600 (POC) with bullish confirmation.
Continuation target: If price accepts above current highs, the next upside objective sits around 4747, where higher-timeframe liquidity is resting.
A clean hold above the trendline keeps the bullish thesis valid.
🧠 Notes
Avoid chasing price at highs; wait for pullbacks into value and liquidity zones.
Trade in alignment with trend + structure, not short-term noise.
Patience is key while the market builds liquidity before the next expansion.
✨ Stay disciplined, trade the structure, and let price come to your zone.

XAUUSD (15M) – Liquidity Sweep → Distribution SetupPrice is currently trading inside a clearly defined range.
Previous sell-side liquidity has already been swept from the equal lows, triggering a sharp displacement to the upside. This move looks corrective rather than impulsive.
Key observations:
Upside move is targeting equal highs / range high liquidity.
Area near the range high aligns with premium zone + likely supply.
Expecting buy-side liquidity grab above highs to trap late longs.
Plan & Bias:
Allow price to run the highs and complete the liquidity sweep.
Watch for bearish shift in market structure (MSS) on lower timeframe near the range high.
Look for short entries on retest of supply / FVG after MSS.
Target is a range rotation back to sell-side liquidity near the range lows.
Narrative:
Classic range manipulation. Market clears the downside, entices breakout buyers at the highs, then distributes and reverses. Patience until liquidity is taken, then execution.
📌 Bias remains short after buy-side liquidity is swept.

XAUUSD (H1) – Powell Subpoena ImpactXAUUSD (H1) – Powell Subpoena Shock: Gold enters a high-volatility week, trade liquidity zones
News that the US Department of Justice has issued a criminal subpoena involving Fed Chair Jerome Powell is an extremely rare type of headline. When the market’s confidence in the Fed and US policy stability gets questioned, gold and silver can surge fast — but the price action often comes with violent two-way swings: a sharp push to grab liquidity, a hard pullback, then the real direction shows.
That’s why this week I’m not chasing candles. The best approach is to trade reactions at key liquidity / support-resistance zones and let the market come to your levels.
Macro context: why gold is moving differently right now
Pressure on the Fed (and its independence) can reprice expectations for rates, which directly hits USD and US yields.
If the market starts pricing aggressive cuts, gold tends to stay supported. But if yields whip around, gold can whipsaw too — fast.
So instead of predicting the headline outcome, the priority is simple: wait for price to hit clean technical zones.
Technical view (H1): uptrend structure holds, but price is trading in “premium”
The structure still sits inside an ascending channel. After a strong impulsive leg up, price is consolidating near the top — a common setup before another expansion, but also a zone where liquidity grabs are frequent.
Key zones to focus on
Sell zone (premium): 4655 – 4660
Buy zone (value): 4413 – 4417
Mid-range resistance (chop zone): around the 45xx area
Trading scenarios (Liam style: trade the level)
1) Primary plan: BUY the pullback into value
If price retraces into the major value support:
Buy: 4413 – 4417
SL: 4403
TP1: 4500 – 4520
TP2: 4655 – 4660
This is the “clean structure” setup: a reset into value, then continuation with the channel.
2) Short-term scalp: SELL the premium reaction
If price pushes into the major supply/liquidity zone:
Sell (scalp): 4655 – 4660 (only with clear rejection on H1/M15)
SL: 4670
TP: 4580 → 4520
This is a reaction sell — a common “profit-taking” area after headline-driven pumps.
3) Continuation setup: BUY after a confirmed hold above mid resistance
If price breaks and holds above the mid resistance (45xx area):
Look for a pullback after breakout to buy
Targets remain towards 4655–4660, then higher along the channel.
Conclusion
This is a headline-risk week, so the key is no FOMO and no entries in the middle of the range. The two zones that matter most:
Buy value: 4413 – 4417
Sell premium (short-term): 4655 – 4660
Which side are you leaning towards — waiting for the dip into 4415 to buy, or hunting a rejection near 4660 to sell?
👉 If this plan helps, follow LiamTradingFX to get the next XAUUSD updates early.

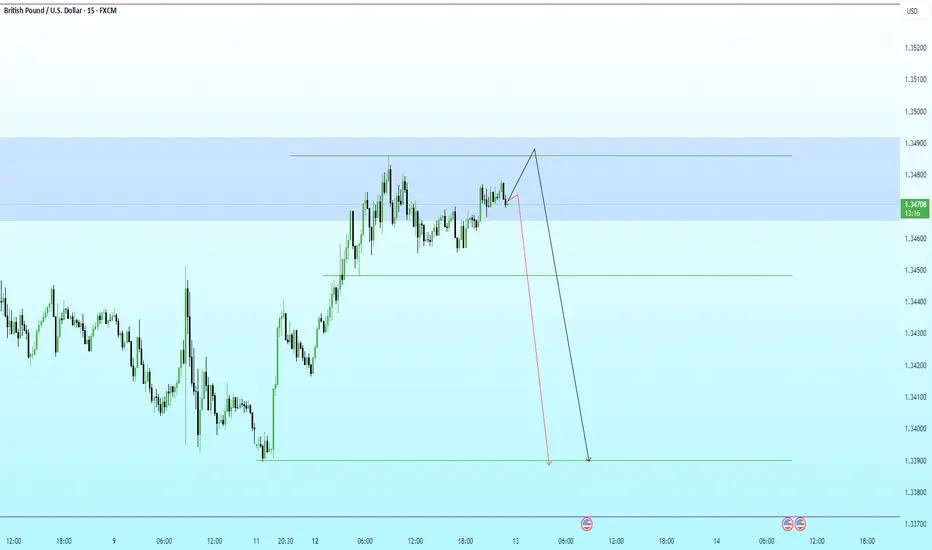
GBPUSD · 15M · SMC OutlookPrice is trading deep into premium, pressing against a well-defined HTF supply zone.
HTF Framework
Clear bullish leg already completed.
Buy-side liquidity resting above recent highs.
Premium zone aligns with prior distribution and weak highs.
LTF Structure
Momentum is slowing near the highs.
Price is consolidating under resistance, hinting at distribution.
Minor pullbacks are being absorbed, classic liquidity buildup behavior.
Expectation
A final push higher to sweep buy-side liquidity.
Reaction from supply after the sweep.
Strong bearish displacement targeting:
Internal range low
Prior demand imbalance
HTF discount zone below
Execution Plan
Avoid longs in premium.
Wait for:
Liquidity sweep above highs
Bearish displacement
LTF MSS for confirmation
Shorts favored post-confirmation.
Partial profits at range low, runners into discount.
BTCUSD · 15M · SMC BiasPrice is currently compressing inside a higher-timeframe premium discount equilibrium, respecting a clear range structure.
HTF Context
Equal highs / liquidity resting above the range highs.
Premium zone overhead aligned with prior supply + inducement.
Discount zone below marked by clean HTF demand.
LTF Narrative
Market already delivered a strong impulsive leg up.
Current consolidation suggests liquidity engineering, not continuation.
Upside push toward the equal highs is likely a liquidity grab, not acceptance.
Expectation
Sweep of buy-side liquidity into the premium zone.
Immediate reaction from supply.
Sharp displacement to the downside targeting:
Range low
Discount imbalance
HTF demand below
Execution Plan
No chasing longs in premium.
Wait for:
Liquidity sweep above highs
Bearish displacement
LTF MSS confirmation
Shorts favored post confirmation.
Targets trail into discount until opposing demand shows intent.

USDCHF – M15 | Sell-Side Sweep → Reactive Bounce Price engineered a clean sell-side liquidity run, flushing range lows with displacement. The reaction that followed is corrective, not impulsive. What we’re seeing now is relief buying into discount, not a trend reversal.
Current bounce is unfolding inside prior inefficiency / mitigation, with structure still bearish on the execution timeframe.
Market Read
Range distribution → sharp sell-side sweep
Bounce = mitigation of bearish orderflow
No bullish displacement, only overlap
Execution Bias
Shorts favored on retracement into the marked supply / imbalance
Invalidation only on strong M15 acceptance above the green high
Targets
Recent sell-side lows
Extension into external liquidity below
Deeper discount if momentum expands

BTCUSD – 1H | Liquidity Run → Distribution →Mean Reversion ScenePrice delivered an impulsive expansion into premium after sweeping internal liquidity from the range lows. That move was displacement, not acceptance.
We are now stalling at a prior H1 supply / EQH zone near the range high. Structure here is weak: wicks, overlap, and loss of momentum hint at distribution rather than continuation.
Narrative
Liquidity taken above recent highs
Price taps premium supply
Expect a lower high / range failure
Smart money likely reallocating shorts
Execution Bias
Shorts favored below the blue level
Invalidation only on clean H1 acceptance above supply
Downside Targets
Range mid → internal liquidity
Range lows
External sell-side resting near deep discount zone
Until price shows acceptance above supply, this remains a sell-the-rally environment.
Expansion up was the trap. Mean reversion is the play.

EURUSD – 15M | Liquidity Sweep → Demand Reaction →Mean ReversionPrice delivered a clean sell-side liquidity sweep into a higher-timeframe demand zone.
Displacement down exhausted, followed by acceptance and stabilization inside value.
Current structure suggests:
Sell-side taken ✔️
Price reacting from HTF demand ✔️
Expectation: mean reversion toward premium / EQ highs
Plan:
Longs favored only after confirmation on LTF
Ideal entry: sweep + reclaim of intraday lows
Targets aligned toward prior supply / liquidity resting above
Invalidation: clean breakdown and acceptance below demand
Bias stays bullish as long as demand holds.

Weekly Analysis with buy/Sell scenarios in BTCAnother week and price is moved as expected in same range. No view change since last prediction.
Refer previous details below…
We analyzed three weeks back that BTC would be in range for some time before taking any further move, And BTC is following same analysis and trapped within a small range since then. BTC prediction of last week also worked perfectly well and market kept in consolidation mode itself. BTC is still in consolidation zone and may spend some more days. It may develop ABC pattern or reversal at identified daily FVG level, if price has to change its delivery and take turn from here. This zone is kind of make or break. If price is not able to sustain and breakdown, then it may witness ~65-70K levels as well.
We hope for reversal from this level as price is developing the pattern at higher time frame.
1. Price has taken liquidity or 82K and almost touched 80K.
2. It has inversed 1Day FVG and now price is consolidating in the range between EMAs.
3. We may expect price retracement till 1D iFVG and then reversal.
4. Before to that we may see sweep of 92900 (1D CISD) level and then a retracement short trade till 1D FVG
5. Most probably price will take liquidity of FVG/RDRB level and create MSS/CISD/TS/iFVG in LTF.
6. Price should show rejection/reversal in respective LTF (5m/15m) at FVG zone.
7. Take the trade only once clear entry model i.e. turtle soup. iFVG break, CDS or MSS happens on LTF
All these combinations are signalling a high probability trade scenario.
Note – if you liked this analysis, please boost the idea so that other can also get benefit of it.
Also follow me for notification for incoming ideas.
Also Feel free to comment if you have any input to share.
Disclaimer: This analysis is for educational purposes only and does not constitute investment advice. Please do your own research (DYOR) and check with your financial advisor before making any trading decisions.

Weekly Analysis with buy/Sell scenarios in Gold/XAUUSDAt weekly time frame Gold has shown sharp and strong reversal candle and closing below the low of previous week. This is signifying change in delivery to downside. Monday has created a strong downside side fall and remaining days went in consolidation mode. Consolidation has effect of year end as well. Price has created SIBI at daily time frame. So we can expect a pullback till SIBI and downfall till DOL (Draw on Liquidity). If price breaks new high, we can expect up move towards the levels of 4720 and 4900.
We should keep eye on both the scenario.
Critical notes.
1. Price may show some consolidation or direct pull back till daily SIBI.
2. If price retraced till SIBI and develop LTF entry model. This may be a good sell scenario.
3. If price breaks and sustains above SIBI and/or all-time high. We may witness further up move till the levels mentioned above.
4. Most probably price will take liquidity of FVG/RDRB level and create MSS/CISD/TS/iFVG in LTF.
5. Price should show rejection/reversal in respective LTF (1h/15m) at FVG zone.
6. Take the trade only once clear entry model i.e. turtle soup. iFVG break, CDS or MSS happens on LTF
All these combinations are signaling a high probability and ~8/10R trade scenario.
Note – if you liked this analysis, please boost the idea so that other can also get benefit of it.
Also follow me for notification for incoming ideas.
Also Feel free to comment if you have any input to share.
Disclaimer: This analysis is for educational purposes only and does not constitute investment advice. Please do your own research (DYOR) and check with your financial advisor before making any trading decisions.

XAUUSD – 3H Technical AnalysisXAUUSD – 3H Technical Analysis
✅ Lana is waiting for a pullback to enter safer BUY positions 💛
Trend: Strong bullish trend, continuously printing new highs
Timeframe: 3H
Current status: Price is moving vertically with no meaningful correction so far
Strategy: Do not chase price. Wait for a pullback into liquidity zones to look for BUY setups.
Market Context
During today’s Asian session, gold surged aggressively and moved close to the 4,500 level — a price area never seen before. The rally has been extremely steep, with almost no pauses or minor pullbacks, clearly showing that buying pressure is dominating the market.
From a fundamental perspective, expectations of a continued dovish stance from the Fed are weakening the USD. At the same time, escalating geopolitical tensions are strengthening gold’s role as a safe-haven asset. The clean breakout above 4,375–4,380, followed by 4,400, has attracted additional momentum-driven and speculative flows into the bullish trend.
3H Technical Outlook
On the 3H timeframe, the bullish market structure remains very clear, and price continues to respect the rising channel. However, after such an extended and sharp move, entering trades at elevated levels becomes increasingly risky.
From Lana’s perspective, during phases like this, patience is far more important than chasing the market. Waiting for a proper pullback offers better risk-to-reward opportunities.
If buying pressure remains strong after a consolidation or corrective phase, higher upside targets around 4,580 are entirely possible.
Key Price Zones Lana Is Watching
🔹 Near-term BUY zone – Liquidity area
Buy around: 4,415
This is the nearest liquidity zone where price may return to “reload” before continuing higher. Lana will closely monitor price reaction and structure at this level.
🔹 Longer-term BUY zone – Deeper correction
Long-term Buy: 4,38x
If the market delivers a clearer and deeper pullback, this zone becomes a higher-probability area for safer medium-term BUY opportunities.
Trading Notes
Avoid chasing price during periods of excessive volatility
Only enter trades when lower timeframes form a clear structure in line with Dow Theory
Reduce position size and prioritise risk management during highly euphoric market conditions
📌 Follow Lana as we analyse XAUUSD together on a daily basis.

XAUUSD (H1) – Liquidity-Based Trading XAUUSD (H1) – Liquidity-Based Trading
Price has broken the channel, but buying momentum is weakening – waiting for a pullback to the trendline for entries
Today’s Strategy Summary
Gold has broken out of its price channel, but the key point is that buying pressure is fading after the strong acceleration. With the market approaching the holiday period and liquidity thinning, the focus is on trading at the right liquidity zones rather than chasing price or FOMO.
Plan:
Look for Buy opportunities on pullbacks into the trendline / old channel
Look for Sell reactions at the Fibonacci liquidity zone 4474–4478
1) Key Levels Today (from the chart)
✅ BUY zones (liquidity pullback)
Buy Zone 1: 4379 – 4382
SL: 4373
Buy Zone 2: 4361 – 4358
SL: 4353
These are clean liquidity areas to wait for price to retrace into – true liquidity-based trading: let price come back to reaction zones, do not chase highs.
✅ SELL zone (Fibonacci liquidity)
Sell zone: 4474 – 4478
SL: 4482
This is a premium + liquidity area. If price reaches this zone and fails to hold, the probability of profit-taking or a short-term reversal is high.
2) Main Scenario: Wait for a Pullback to the Channel/Trendline to Buy
After a breakout, the market often retests the old trendline or channel to confirm genuine buying strength.
As buying momentum is weakening, the likelihood of choppy moves and liquidity sweeps is high. Patience is key – wait for 4379–4382, or a deeper pullback into 4361–4358.
Expected targets (scalp / short swing):
Capture 8–15 USD moves depending on volatility, taking partial profits as price reacts according to plan.
3) Alternative Scenario: Sell Reaction at 4474–4478
If price continues to push higher into the Fibonacci zone, priority is to Sell on reaction rather than chasing Buy entries.
Only sell if there are signs of loss of momentum (long wicks, rejection, failure to close strongly above the zone).
4) News & Market Context: Thin Liquidity = Easy Sweeps
With the market nearing the holiday period, liquidity is weak, increasing the chances of spikes and stop-hunts.
Political and economic developments related to policy and tax matters are influencing corporate positioning, but at this stage, price is more likely to react to short-term capital flows rather than a sustainable trend.
Conclusion:
Today’s focus is “right zone – strict discipline”, avoiding mid-range entries and emotional trades.
5) Risk Management
Risk per trade: maximum 1–2%
Avoid trading when spreads widen or candles spike abnormally
Which scenario do you lean towards today?
A pullback to 4379 / 4361 for Buy, or a push to 4474–4478 for a Sell reaction?
