APOLLO: Structural Reversal from Key Support Zone🚀 Long Setup: NSE:APOLLO Micro Systems (APOLLO)
Trade Parameters
Entry Zone: ₹245.00 – ₹255.00 (Current breakout level)
Stop Loss (SL): ₹214.00 (Weekly close basis / below structural support)
Target 1: ₹300.00 (Psychological & Analyst Consensus)
Target 2: ₹355.00 (All-Time High retest)
Risk/Reward Ratio: ~1:2.8
Technical Analysis
Support Rebound: The stock has successfully defended the ₹210–₹220 horizontal support zone, which acted as a major resistance-turned-support from mid-2025.
Momentum Shift: Today's 5% Upper Circuit hit at ₹249.80, accompanied by a spike in volume, signals the end of a 3-month correction/accumulation phase.
Trend Confirmation: The price has reclaimed the 20-week EMA, shifting the medium-term bias back to bullish.
RSI Recovery: RSI is turning up from the 40-level floor, suggesting the "oversold" energy is being replaced by fresh buying interest.
Fundamental Driver
The technical move is backed by the company's Q2 FY26 performance (highest-ever quarterly income of ₹226 Cr) and a massive ₹1,500 Cr order book. The recent licensing for high-energy explosives provides the long-term thematic tailwind for the Aerospace & Defense sector.
India

INFY | Weekly Bullish Options Setup | 30 Dec ExpiryTrade Structure:
• Sell 1640 PE
• Buy 1600 PE
• Defined-risk bull put spread
Why this setup works for NSE:INFY
INFY is showing a clear recovery from the lower band with improving momentum. RSI has turned up from the mid-zone and ROC is trending higher, suggesting strength is building rather than fading.
Price holding above the 1620–1640 support zone keeps downside limited, while steady IV makes short-premium structures efficient for the week.
View
Moderately bullish — expecting INFY to hold above support and grind higher.
This video is for education only. It’s not financial advice or a recommendation to trade.
#INFY #NiftyIT #WeeklyOptions #OptionsTrading #IndiaFNO #BullPutSpread #OptionSeller #PriceAction #NSEStocks #MarketAnalysis

Sensex INDEXSensex is in bearish trend
We can see strong RESISTANCE in between 84,800 & 85,000 range. If SENSEX breaksdown 84,800 level we can expect sensex at 84,600 and further down side till 83,100 level
Strong support regions are at 84,900, 84,500, and 83,950.
After reaching 84,600 we can expect retracement till 84,900 and if resistance was not taken then only it can move till 84,000 level
This is just my analysis to best of my knowledge

NIFTY MIDCAPNIFTY MIDCAP formed with DOUBLE TOP with DIVERGENCE with first target 14,403, and next support at 13,995. If it didn't take supports at 13,995 we can see further downside with FINAL TRAGET 13,900.

HDFC BANK LTD PARALLEL CHANNEL BREAKOUTHDFC BANK was traded in channel from past few years and made a breakout with good volume. Entry price at ₹990, with a STOPLOSS ₹940 and TARGET ₹1,190

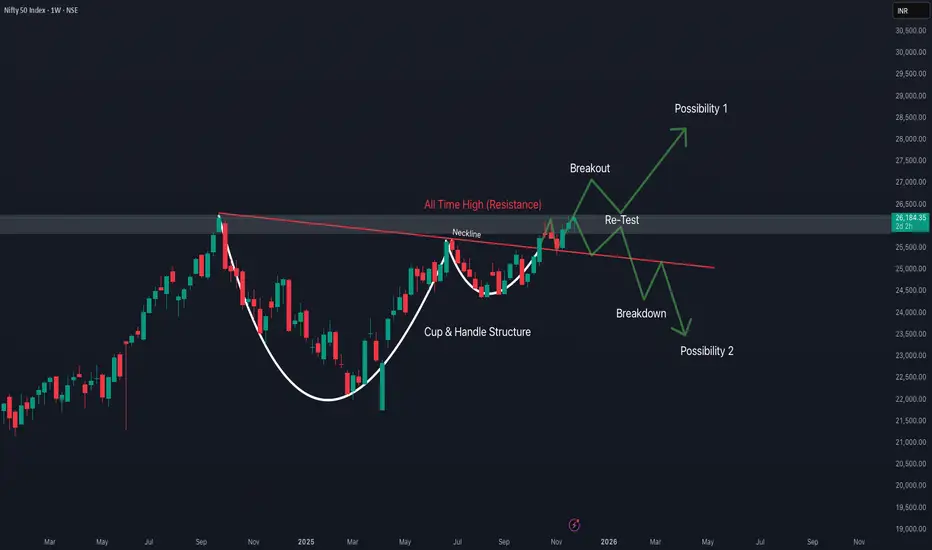
Weekly Price Action in Nifty 50The chart shows a classic Cup & Handle pattern
The cup is wide and smooth – a strong long-term accumulation pattern.
The handle is small, healthy, and formed near resistance → a sign of strength.
These patterns on the weekly chart typically lead to multi-month rallies.
The chart structure is strongly bullish unless Nifty falls below 25,500.
Consumption Trends in the Indian Trading Market1. Introduction
Consumption trends refer to the patterns and behaviors exhibited by consumers in terms of purchasing goods and services over time. In India, with a population exceeding 1.4 billion, consumption plays a pivotal role in driving economic growth. Retail, e-commerce, FMCG (Fast-Moving Consumer Goods), luxury goods, and digital services are some of the major sectors influenced by consumer spending patterns.
In recent years, consumption trends in India have shifted due to urbanization, rising disposable incomes, digital penetration, and changing lifestyles. Analyzing these trends provides valuable insights for traders and businesses to align their strategies with market demands.
2. Factors Driving Consumption Trends
Several macro and microeconomic factors influence consumption in India:
2.1 Rising Disposable Income
India’s growing middle class has more disposable income than ever before. With steady economic growth and higher employment rates, consumers are spending more on discretionary items like electronics, fashion, entertainment, and travel.
2.2 Urbanization
Rapid urbanization has created a surge in modern retail consumption. Tier-1 and Tier-2 cities have witnessed increased demand for branded products, premium services, and online retail platforms.
2.3 Digital Transformation
Digital technology has reshaped consumer behavior in India. E-commerce platforms such as Amazon, Flipkart, and Myntra have transformed the way people shop. Digital payments, mobile apps, and online promotions have contributed to convenience and impulse buying.
2.4 Lifestyle Changes
The younger generation, especially millennials and Gen Z, prioritize experiences over material goods. Their consumption patterns lean towards travel, wellness, fitness, and technology-driven products.
2.5 Government Policies
Government initiatives like Digital India, Make in India, and financial inclusion programs have increased accessibility to products and services across urban and rural regions, boosting overall consumption.
3. Consumption Patterns by Sector
3.1 FMCG (Fast-Moving Consumer Goods)
FMCG remains a cornerstone of Indian consumption. Staples like food, beverages, personal care products, and household goods dominate spending. Recent trends show a shift toward organic, health-oriented, and premium products.
Rising Health Awareness: Consumers prefer products with natural ingredients and low sugar/fat content.
E-commerce Impact: Online grocery shopping has surged, with platforms like BigBasket and Grofers leading the way.
3.2 E-commerce and Digital Consumption
E-commerce has revolutionized the Indian market, making products accessible beyond urban areas.
Growth of Mobile Commerce: Mobile apps drive more than 70% of e-commerce transactions.
Discount Culture: Festive sales and heavy discounts influence consumer behavior, leading to higher transaction volumes.
Niche Segments: Fashion, electronics, beauty products, and digital content subscriptions are seeing high online demand.
3.3 Luxury and Lifestyle Products
Luxury goods consumption has grown steadily among urban Indians, reflecting aspirations and status symbols.
Premium Brands: Demand for high-end automobiles, watches, and fashion brands is rising.
Experiential Consumption: People prefer experiences like fine dining, vacations, and wellness retreats over material possessions.
3.4 Technology and Electronics
Digital adoption drives significant consumption in electronics, including smartphones, laptops, and smart home devices.
Affordability: Competitive pricing of smartphones and appliances has widened consumer reach.
Integration with Lifestyle: Smart devices now complement entertainment, work, and fitness trends.
3.5 Rural Consumption
Rural India represents a massive consumption base, accounting for nearly half of total consumer spending.
Staple Goods: Food, FMCG, and agricultural products dominate.
Emerging Demand: Appliances, motorcycles, mobile phones, and digital services are becoming popular as connectivity improves.
4. Emerging Consumption Trends
4.1 Sustainability and Eco-consciousness
Consumers increasingly prefer sustainable and eco-friendly products. Brands focusing on packaging, renewable resources, and green initiatives gain trust.
4.2 Subscription-Based Models
Subscription services for streaming, meal kits, and curated products are gaining traction. Consumers appreciate convenience and customization.
4.3 Omni-channel Retail
Consumers expect a seamless experience across offline and online channels. Retailers offering click-and-collect, virtual try-ons, and personalized services are benefiting.
4.4 Experiential Spending
Experience-driven consumption, including travel, fitness, and leisure, is surpassing traditional material spending, especially among millennials.
4.5 Influence of Social Media
Social media platforms heavily influence purchasing decisions. Influencer marketing, short video apps, and online reviews have become key drivers of consumption.
5. Impact on Indian Trading Market
5.1 Growth of Retail and E-commerce
The retail sector is witnessing unprecedented growth due to changing consumption trends. Organized retail chains, supermarkets, and online platforms are expanding rapidly.
5.2 Increased Investor Interest
High consumption fuels business revenues, making sectors like FMCG, e-commerce, and technology attractive for investors. Stock performance of companies catering to changing consumer behavior is closely tied to these trends.
5.3 Supply Chain Evolution
Consumption trends are reshaping supply chain strategies. Efficient logistics, warehouse networks, and last-mile delivery are critical to meet demand.
5.4 Dynamic Pricing and Promotions
Companies adopt dynamic pricing and targeted promotions to influence buying patterns, particularly in e-commerce and FMCG sectors.
5.5 Product Innovation
Consumer expectations push companies to innovate continuously, focusing on personalization, convenience, and sustainability.
6. Challenges and Risks
Despite robust growth, consumption trends face challenges:
Economic Uncertainty: Inflation, interest rates, and global economic conditions can impact consumer spending.
Rural Penetration Barriers: Limited infrastructure and financial literacy may restrict rural consumption growth.
Regulatory Hurdles: Taxation and compliance requirements can affect pricing and margins.
Changing Preferences: Rapid shifts in consumer preferences may lead to inventory and investment risks for businesses.
7. Future Outlook
India’s consumption trends indicate a promising future for traders, investors, and companies. Key predictions include:
Rising Digital Consumption: Continued growth in e-commerce and online services.
Premiumization: Increased demand for premium, lifestyle, and health-oriented products.
Rural Market Expansion: Improved infrastructure and digital access will unlock rural consumption potential.
Sustainable Consumption: Brands focusing on eco-friendly products will capture long-term consumer loyalty.
Technology Integration: AI-driven personalization, AR/VR retail experiences, and smart devices will reshape buying patterns.
Overall, India’s consumption-driven market will remain a critical engine of economic growth, innovation, and global trading opportunities. Businesses and investors who anticipate these trends and adapt accordingly are likely to gain a significant competitive advantage.
8. Conclusion
The Indian trading market is evolving rapidly, with consumption trends at its core. From urban tech-savvy buyers to rural emerging consumers, the diversity of preferences demands that traders and companies remain agile. Understanding these trends enables businesses to innovate, investors to strategize, and policymakers to facilitate sustainable growth.
India’s consumption story is one of opportunity, fueled by demographic advantage, technological adoption, and a culture of aspiration. The next decade promises to redefine how goods and services are traded, consumed, and valued across the subcontinent.

Trends in the Equity Market1. Rise of Retail Participation
One of the most significant trends in recent years has been the surge of retail investors in the equity market. Traditionally dominated by institutional players, retail participation has grown due to:
Easy access through online trading platforms – Apps like Zerodha, Upstox, and Groww in India, and Robinhood in the US, have democratized investing.
Low brokerage fees and fractional investing – Small investors can now invest with minimal capital, diversifying their portfolios effectively.
Social media and community-driven investing – Platforms like Twitter, Reddit, and YouTube have fueled investment communities, leading to phenomena like meme stocks and coordinated retail rallies.
Impact: Retail participation increases market liquidity, adds volatility in certain stocks, and changes market sentiment faster than ever.
2. Technology-Driven Trading
Technological advancements have reshaped equity market operations, giving rise to new trading strategies:
Algorithmic trading: High-frequency trading (HFT) leverages algorithms to execute trades in milliseconds, impacting liquidity and price efficiency.
AI and machine learning: Predictive analytics and AI-driven stock recommendations help investors make data-backed decisions.
Blockchain and tokenized assets: Decentralized finance (DeFi) introduces tokenized stocks and fractional ownership, expanding access.
Impact: Technology accelerates decision-making, increases efficiency, and reduces human bias, but can also amplify sudden market moves during high volatility periods.
3. Sectoral Shifts and Investment Preferences
Equity markets evolve in response to macroeconomic cycles and technological innovation. Current sectoral trends include:
Technology and software: Cloud computing, AI, and fintech dominate investor attention.
Green energy and ESG: Renewable energy, electric vehicles, and ESG-compliant companies attract sustainable investment funds.
Consumer and healthcare: As disposable incomes rise and aging populations expand, consumer staples and healthcare continue to see robust growth.
Impact: Understanding sectoral shifts is crucial for portfolio diversification and identifying growth opportunities.
4. Global Influences on Domestic Markets
Equity markets no longer operate in isolation. Global factors significantly affect domestic equities:
Interest rate movements: Central bank policies in major economies influence capital flows and risk appetite.
Geopolitical developments: Conflicts, trade agreements, and sanctions can trigger sector-specific volatility.
Global economic cycles: Inflation, recessions, or commodity price swings can reshape equity valuations worldwide.
Impact: Investors must adopt a global perspective and hedge against systemic risks to protect portfolios.
5. Increased Focus on ESG Investing
Environmental, Social, and Governance (ESG) investing has moved from niche to mainstream:
Companies demonstrating strong ESG metrics often enjoy higher valuation premiums.
ESG-focused funds attract both retail and institutional money.
Regulatory frameworks in regions like Europe and India are increasingly mandating ESG disclosures.
Impact: ESG considerations now influence stock selection, corporate behavior, and long-term market trends.
6. Volatility and Market Sentiment
Equity markets are inherently volatile, but recent trends have amplified sentiment-driven fluctuations:
Behavioral finance influence: Fear, greed, and herd behavior can cause sudden price swings.
Events-driven volatility: Earnings surprises, policy changes, or economic shocks affect short-term trading patterns.
Use of derivatives: Options and futures increase market leverage, influencing volatility patterns.
Impact: Investors must combine technical analysis with market sentiment to navigate swings effectively.
7. Rise of Passive Investing and ETFs
Another major trend is the increasing dominance of passive investing:
Exchange-Traded Funds (ETFs) and index funds attract inflows due to low costs and broad market exposure.
Passive strategies reduce the influence of individual stock picking, shifting markets toward index-driven movements.
Institutional adoption of passive strategies has altered liquidity and valuation dynamics.
Impact: Passive investing has stabilized long-term returns but can lead to concentrated risk during market downturns.
8. Regulatory and Policy Trends
Government regulations play a critical role in shaping equity markets:
Capital market reforms: Simplified IPO processes, demat accounts, and trading technology have encouraged participation.
Tax incentives: Policies like long-term capital gains tax reforms influence investor behavior.
Global compliance: Regulations like MiFID II in Europe and SEBI guidelines in India ensure transparency and protect investors.
Impact: Regulatory trends influence market confidence, compliance costs, and investment strategies.
9. Market Integration and Cross-Border Investing
Investors increasingly diversify across geographies:
Mutual funds, global ETFs, and foreign portfolio investments enable exposure to international equities.
Correlation between global markets has increased; for instance, US Federal Reserve decisions affect Indian and Asian equities.
Currency fluctuations now directly impact returns for foreign investors.
Impact: Cross-border investing provides diversification but introduces currency and geopolitical risks.
10. Emerging Technologies and AI in Equity Analysis
The integration of AI and Big Data is transforming how equity markets operate:
Predictive analytics: Forecasting earnings, detecting anomalies, and assessing risk in real time.
Natural Language Processing (NLP): Analyzing news, earnings calls, and social media sentiment to predict market reactions.
Robo-advisors: Automated portfolio management using AI-driven insights.
Impact: AI reduces human error, enhances research efficiency, and allows more informed investment decisions.
11. Behavioral and Social Media Influences
Equity markets are increasingly influenced by social media trends:
Platforms like Reddit’s WallStreetBets can cause rapid price movements.
Viral investment stories often impact stocks without fundamental changes.
Public perception, amplified by social media, now drives trading behavior alongside traditional financial metrics.
Impact: Social-driven market movements highlight the importance of monitoring both fundamentals and sentiment indicators.
12. Future Outlook
The equity market continues to evolve:
Integration of technology and finance: AI, blockchain, and algorithmic trading will define market structure.
Sustainable investing: ESG and impact investing will guide corporate and investor decisions.
Global interconnectivity: Investors will increasingly need to monitor global macro trends, interest rates, and geopolitical developments.
Conclusion: Understanding trends in the equity market is crucial for successful investing. Retail participation, technological innovation, ESG focus, and global integration are reshaping how markets operate. Investors who adapt to these trends can position themselves for long-term growth while managing volatility and risk.

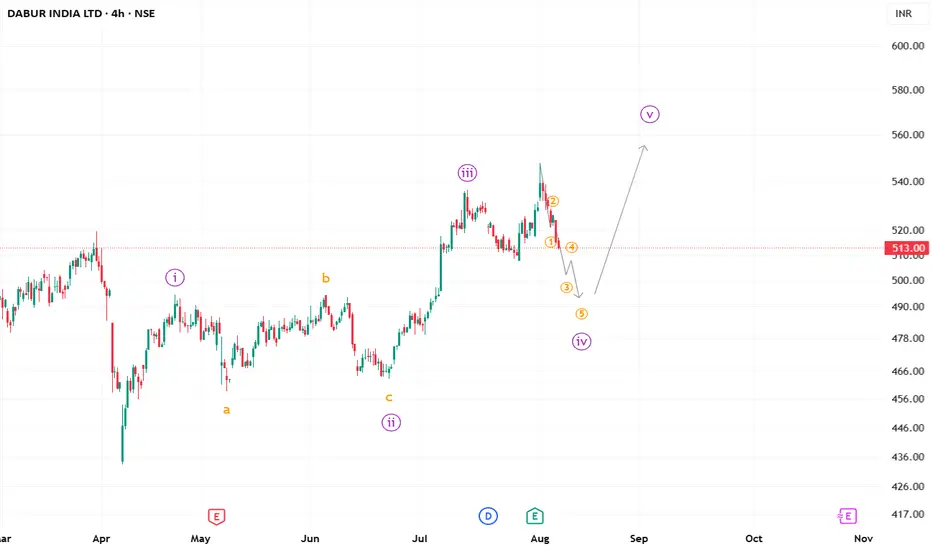
#Dabur ending correction soon?Dabur can be a good pick if you are looking for some medium-term investment in sometime, as the ongoing correction looks to be in the last stage of it impulse.
We may then possible see it soaring higher.
P.S. Always trade on price confirmation.
**This is an educational market outlook, not investment advice. Please consult a SEBI-registered advisor before taking any investment decisions.**
APTUS Swing Trade (20% upside)Simple swing trade setup based on institutional buying footprint.
No indicators, no silly chart patterns.
Pure buyer/seller psychology and trend based setup.
Risk Management for setups like these:
This is a high probability setup. The only thing to take care of is the position sizing in case the overall market ( Nifty ) is bearish for some weeks. Decrease position and increase SL size to maintain your Risk. Have patience.
Message me for more such setups and learning insights and to know how to find such setups and properly ride the complete trend fors trades like these.
Risk Reward for these setups are very good so you have to manage the risk before the next up-trend move kicks in. Part of the game.
Any question or want to have any convo over stock market ? Do message. Happy to help and connect with fellow traders.
Thanks.
Gaurav

Swiggy Ltd. Reserch ReportBuy/Sell/Hold Recommendation:
Given Swiggy’s strong revenue growth but continued losses and negative cash flows, the stock currently represents a high-risk, high-reward opportunity. Unless you have a high risk appetite and a long-term horizon, a "Hold" stance is appropriate—wait for visible margin improvement and positive cash flows before considering aggressive buying. For conservative investors, it’s best to avoid new buys until profitability and sustainable cash generation are in sight. Only enter or add if Swiggy shows concrete signs of turning profitable and scaling successfully.
HOld (Overvalued)
Swiggy Investment Report: Independent Strategic & Financial Outlook
Introduction
Swiggy, a leading player in India’s food delivery and quick commerce industry, continues to pursue aggressive growth and operational dominance, shaping its own strategic path amid sector challenges.
Financial Metrics
In FY25, Swiggy posted revenue of ₹15,227Cr but remained loss-making with a net deficit of ₹3,117Cr and negative EBITDA margins, reflecting heavy investment in technology, logistics, and expansion—especially in its Instamart quick commerce division. Capital expenditures and higher working capital are keeping free cash flows negative (-₹2,693Cr in FY25), underscoring the company’s high-growth, cash-consuming phase.
Strategic Progress & DCF Valuation
Swiggy’s management aims for positive cash flows and margin turnaround, with plans to steadily improve profitability by scaling operations and increasing efficiency. A detailed DCF analysis, based on realistic growth and margin improvement assumptions (cost of equity 11.79%, terminal growth 10%), implies an intrinsic value of around ₹143 per share—indicating the current market cap still prices in optimism about future execution.
Key Takeaways
Swiggy operates in a capital-intensive, competitive market, facing margin pressure but also strong revenue momentum.
Ongoing board and policy reforms reflect the company’s drive for operational maturity.
Long-term success hinges on rapid margin improvement, successful turnaround of Instamart, and conversion of scale into sustainable profits.
Conclusion
Swiggy’s independent outlook shows promise with its robust platform and growth potential, but significant risks remain until losses are narrowed and cash flows turn consistently positive. For investors, Swiggy presents a high-risk, high-reward bet—success will be determined by its pace of execution and ability to transition from investment-driven growth to profitable leadership in India’s booming delivery market.

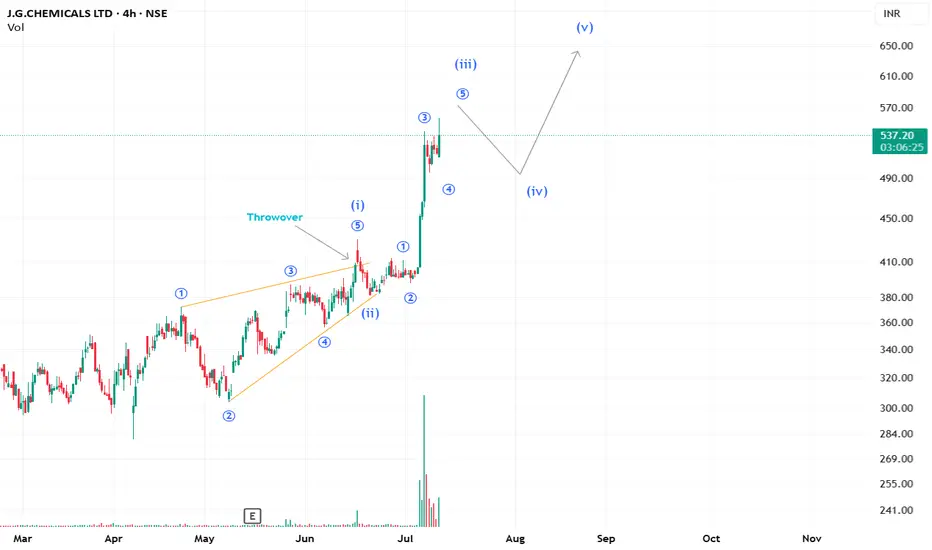
A good 5 wave patterns unfolding in J.G.ChemicalsCurrently, it seems that J.G. Chemicals is unfolding into a clear extended 3rd wave move. We may see a retracement and then a resumption of the trend.
Love,
PipVoyager
**This analysis is based on the Elliott Wave Principle.
This analysis is for educational purposes only and not investment advice.
Please consult your SEBI-registered advisor before making any investment decisions. Markets are subject to risk.**
TATA MOTORS – Textbook CT Breakout on Weekly Chart🔍 Key Technical Highlights:
✅ CT Breakout: Clean break above a long-standing counter-trendline drawn from the November 2024 highs. The breakout is decisive, with the latest weekly candle closing convincingly above the CT.
✅ Volume Confirmation: Weekly volume surged to ~9M, confirming strong participation behind the breakout — a critical condition for higher timeframe setups.
✅ Simple Base at 200 EMA: Price formed a simple base right at the 200-week EMA, absorbing selling pressure and building strength before the breakout. This acts as a reliable launchpad, often seen in high-quality setups.
✅ EMA Recovery: The breakout candle reclaims the 200 EMA, a strong sign of trend reversal and institutional interest.

BANK NIFTY(NIFTY BANK) FALL COMING IN COMING MONTHS UPTO 50K WEEKLY TRENDLINE CHANNEL WE ARE AT JUST TIP OF THE UPPER TRENDLINE CURRENT GLOBAL SCENARIO AND UNCERTAIN MARKET CONDITIONS ANYTHING CAN BE REASON.
Note: This view will be invalid if we break this long weekly trendline channel, which looks highly unlikely.
~10x Bulls
Courtesy: 10x Bulls (An educational platform for investors and traders to find the best investment decisions, faculty trained by ex-fund managers, such as JP Morgan Chase and Goldman Sachs)
Classic Forecast: COINBASE:BTCUSD $15000 to $100000 in 2021 completed in 2024.

GMBREW Sell Trade with 1:8 RRGMBREW Sell Trade with 1:8 Risk to Reward.
Simple buyer - seller psychology based trade.
Retail buyers got trapped, in a down-trending stock which can fuel next downwards move.
Follow for more such setups.

Bharti Airtel Swing TradeBharti Airtel has grabbed monthly liquidity and is ready to make ATH if overall market holds current level ie Nifty holds 22000.

Gold's Strong Recovery: Key Levels to Watch in XAU/USDXAU/USD Technical Analysis: Gold Shows Strong Recovery Amid Global Economic Optimism 💰📊
Introduction: Gold (XAU/USD) is currently experiencing a strong recovery, supported by several key factors in the global economic landscape. One notable factor is the 90-day tariff suspension for major countries worldwide, which has created a more positive sentiment among investors. Additionally, U.S. stock markets saw a strong boost as this news was announced. The recent FOMC meeting also highlighted the potential for interest rate cuts later this year, further boosting optimism across financial markets. 📈
Technical Analysis: On the XAU/USD chart, gold is showing a solid recovery from recent lows. The price has broken through key resistance levels and is now approaching new highs. Here are the important resistance and support levels that traders should keep an eye on:
Key Resistance Levels:
3146
3162
3168
Key Support Levels:
3096
3078
3066
3052
Moving Averages (MA):
MA 13 (Orange Line): This short-term moving average is supporting the upward trend and providing BUY entry signals when the price is above MA 13.
MA 34 (Yellow Line): The medium-term MA is positioned above the price, further supporting the bullish trend.
MA 200 (Red Line): The long-term MA is confirming a strong uptrend as the price remains above MA 200, reinforcing the positive outlook for gold.
Trading Plan:
BUY ZONE 📈:
Buy Zone: 3096 - 3094
SL (Stop Loss): 3090
TP (Take Profit): 3100 - 3104 - 3108 - 3112 - 3116 - 3120
SELL ZONE 🔽:
Sell Zone: 3164 - 3166
SL (Stop Loss): 3170
TP (Take Profit): 3160 - 3156 - 3152 - 3148 - 3144 - 3140
Fundamental Analysis: Yesterday was a positive day for gold, with various fundamental factors supporting the short-term and medium-term bullish outlook. The suspension of tariffs for 90 days among major countries has created a positive sentiment, and the possibility of interest rate cuts from the FOMC has strengthened the expectation of gold's recovery. 📈💡
Risk Management Advice: Given the current market momentum, the strategy is to focus on BUY entries near key support levels. However, traders should be cautious when selling, as the bullish trend may continue strongly if the price breaks through key resistance levels. Always apply proper risk management by using stop loss and only trade with capital you can afford to lose.
Conclusion: Gold is currently in a strong recovery cycle, with both fundamental and technical factors supporting the uptrend. Traders should watch for key support and resistance levels to implement their trading strategies effectively. Be prepared for BUY opportunities near support zones and watch the resistance levels for potential sell signals as the market moves forward. 📊📉
What are your thoughts on Gold's movement? Share your analysis and trade ideas in the comments below! 💬👇

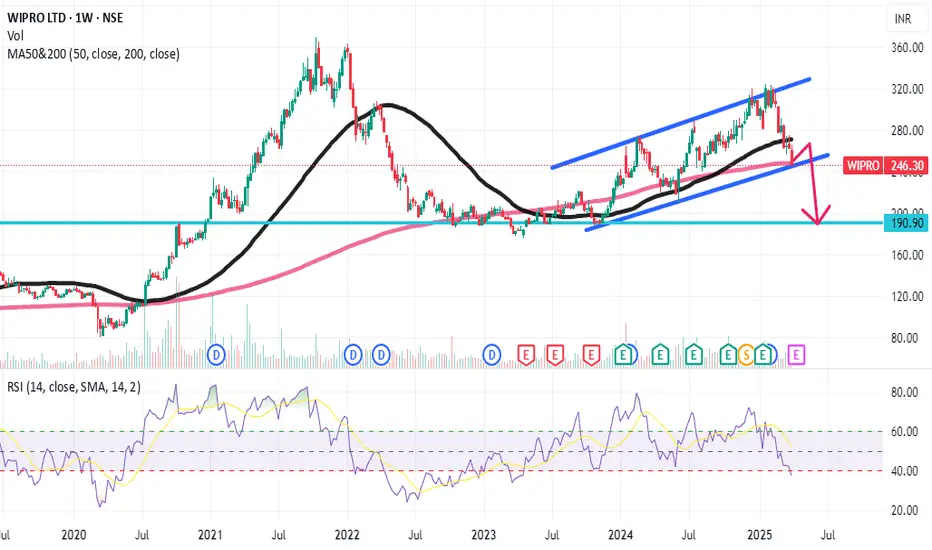
Wipro breakdown Higher probality?A very high probability that stock of Wipro can breakdown from the level. This says channel break. RSI also below 40 levels. This is for your educational purpose only.
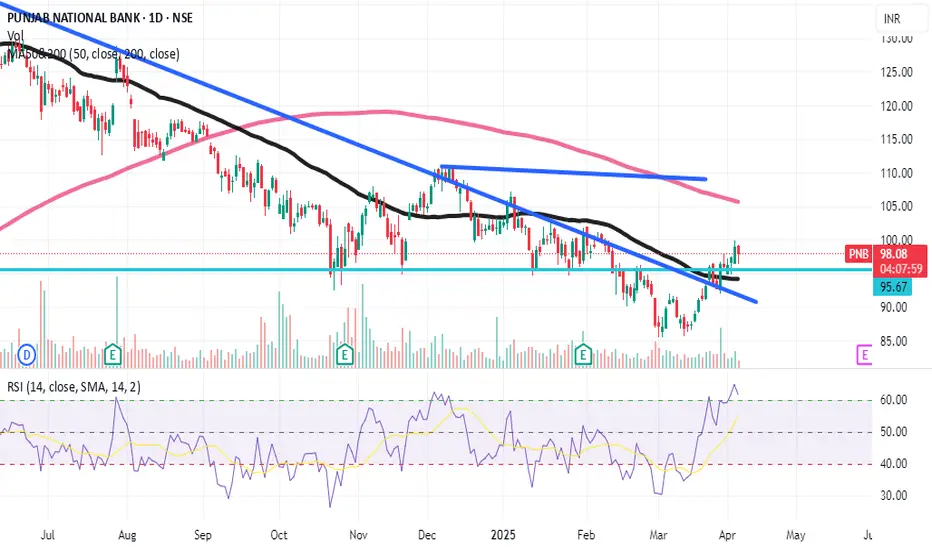
PNB is really Trend shifting?High probability that trend shifting can be seen in PNB bank. On daily chart high probability of trend reversing with the support of 50 EMA. Also stock is trading above the resistance area. Can take long entry above 99 for the first target between 112-115. later we can trail the SL .This is for your educational purpose only.
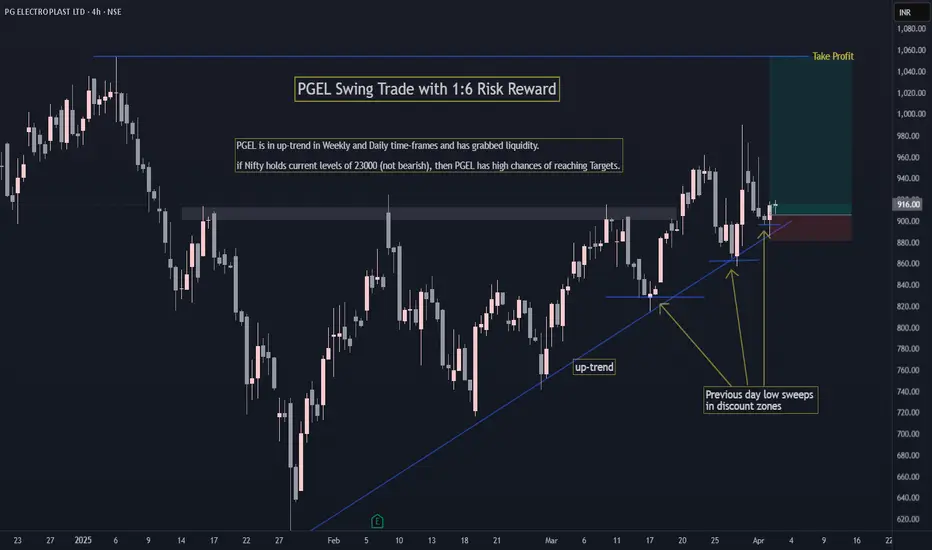
PGEL Swing Trade with 1:6 RRPGEL is in up-trend in Weekly and Daily time-frames.
It has grabbed liquidity from previous day low.
1:6 Risk to Reward. (on a safer side you can take 1:5 RR trade by increasing your SL a bit).
if Nifty holds current levels of 23000 (ie. not bearish), then PGEL has high chances of reaching Targets.
Happy trading!
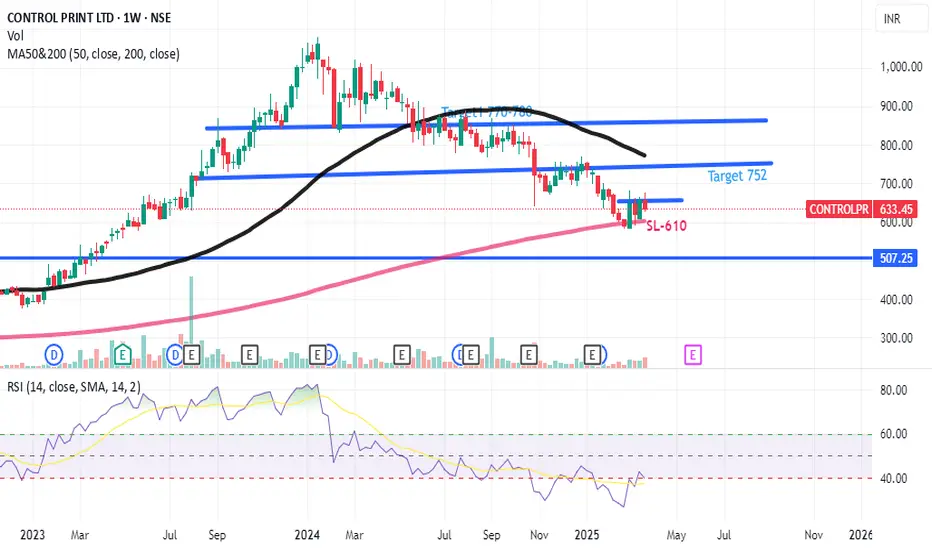
Control Print stock to take Long entryLong Control Print above 640 for the 1st target of 750 with SL 611. A very good setup with risk to reward ratio. After a long time stock is touching the 200 EMA & consolidating at the level. On shorter time frame we can go long. This is for your educational purpose only.
Gold Awaits – A Major Move Is Just Around the CornerGold has shown consistent structure since the start of this week.
Today, there are no major economic events, so price is likely to continue moving sideways within the current range, as previously analyzed in AD’s plan.
📌 Important Events Coming Up:
🔸 Thursday: US Quarterly GDP data
🔸 Friday: PCE Inflation Report (Key inflation indicator)
👉 These are the two most impactful news releases this week, and essentially wrap up Q1/month-end flows.
→ Global traders will be closely watching Thursday & Friday, so stay extra cautious during these two sessions.
🔄 Today’s Market Behavior:
Gold continues to range within the same channel shared earlier this week.
There is no clear breakout or strong directional move yet.
The market is essentially waiting for Thursday & Friday's data — which could act as the catalyst for a stronger bearish correction, in line with AD’s mid-term outlook.
🔍 Current Trading Strategy:
As shared from the beginning of the week, AD continues to trade reactions at key support and resistance zones.
Without a confirmed breakout, the approach remains:
→ Trade the range. React to both ends of the zone.
🧭 KEY LEVELS TO WATCH:
🔺 Resistance: 3,010 – 3,036 – 3,046 – 3,057
🔻 Support: 3,010 – 3,001 – 2,988
🎯 TRADE ZONES:
BUY ZONE: 2988 – 2986
SL: 2982
TP: 2992 – 2996 – 3000 – 3004 – 3008 – 3015
SELL ZONE: 3045 – 3047
SL: 3051
TP: 3042 – 3038 – 3034 – 3030 – 3026 – 3020
🧠 Final Reminder:
There is no breakout confirmation yet → market is still in accumulation mode.
Be patient, avoid FOMO, and watch price reaction closely at each zone.
➡️ Trade clean levels. Enter only when setups are clear — stay out if not.
Protecting your capital always comes first.
— AD | Money Market Flow

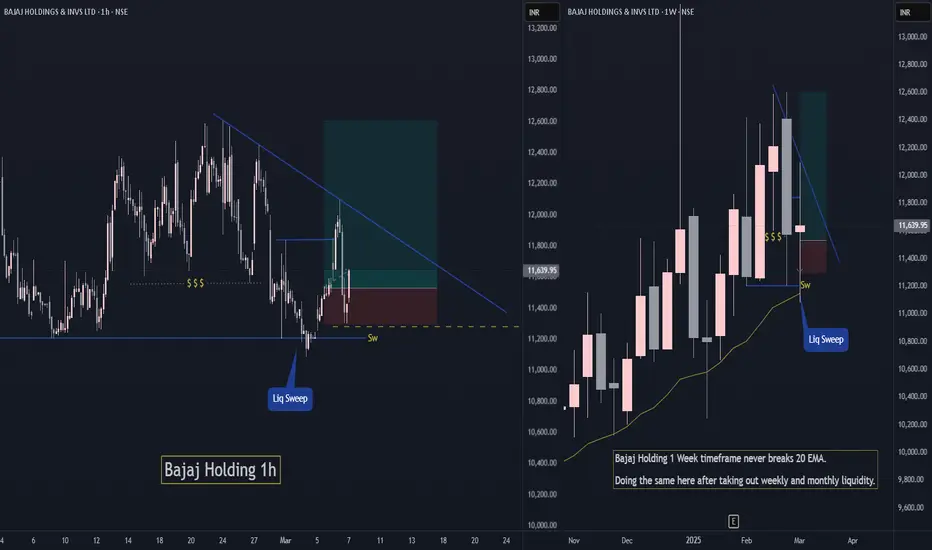
Bajaj Holding Short Term Swing TradeBajaj holding has grabbed monthly and weekly liquidity while maintaining is uptrend.
If Nifty holds current levels ie. above 22400 then Bajaj Holding has high chances to move up and continue its trend.
Do like or follow for more Trading ideas like these. You can comment your views on this analysis.