Axis Bank | Gann Square of 9 Intraday Observation | 11 March 202Disclaimer:
This analysis is for educational purposes only. I am not a SEBI-registered advisor. This is not financial advice.
Symbol: AXISBANK (NSE)
Date Observed: 11 March 2024
Time Frame: 15-Minute Chart
Method: Gann Square of 9 (Price Capacity & Time Alignment)
This post shares a historical intraday observation showing how price interacted with a normal Square of 9 capacity level, leading to a temporary reaction when time and price aligned.
📊 Market Context & Reference Selection
Axis Bank displayed upward momentum after the completion of the first 15-minute candle.
In such market conditions, the low of the first 15-minute candle (~1104) was treated as the 0-degree reference level, following Gann methodology.
This reference point was used to study the session’s expected price expansion.
Correct identification of the reference level is critical for objective Square of 9 analysis.
🔢 Square of 9 Level Mapping
Based on the selected reference:
0 Degree: ~1104
45 Degree (Observed Normal Capacity): ~1121
The 45-degree level often represents the normal intraday movement range under regular market conditions.
⏱️ Observed Price–Time Behavior
Price approached the 45-degree level well before the later part of the trading session.
Early completion of normal price capacity has historically been associated with short-term trend fatigue.
After interacting with this zone, price showed temporary selling pressure and moved lower.
A minor variation around the calculated level was observed, which is common in live market conditions.
This aligns with a widely observed Gann concept:
When expected price capacity is completed early in time, the probability of a reaction may increase.
📘 Educational Takeaways
Square of 9 helps define logical intraday price limits
Early capacity completion can indicate temporary exhaustion
Time plays a supporting role in validating price-degree levels
Small price deviations are normal and should be viewed structurally
The method promotes rule-based observation over prediction
📌 Shared strictly for educational and historical chart-study purposes.
#AxisBank #GannSquareOf9 #WDGann #IntradayAnalysis #MarketEducation #PriceTime #TechnicalAnalysis
Investment

Axis Bank | Gann Square of 9 Intraday Observation | 15 March 202Disclaimer:
This analysis is for educational purposes only. I am not a SEBI-registered advisor. This is not financial advice.
Symbol: AXISBANK (NSE)
Date Observed: 15 March 2024
Time Frame: 15-Minute Chart
Method: Gann Square of 9 (Price Capacity & Time Study)
This post documents a historical intraday market observation using the Gann Square of 9, focusing on how price capacity, trend context, and time alignment can highlight potential intraday reaction zones.
📉 Market Context & Reference Point Selection
Axis Bank showed downside pressure from the opening 15-minute candle.
In such conditions, the high of the first 15-minute candle (~1050) was treated as the 0-degree reference level, following Gann methodology.
This level acts as the starting point for measuring the intraday downward price cycle.
Correct trend identification and reference selection are essential before applying Square of 9 calculations.
🔢 Square of 9 Price Mapping
Based on the selected reference:
0 Degree: ~1050
45 Degree (Observed Normal Capacity): ~1034
The 45-degree level often represents the normal intraday price expansion range under regular market conditions.
⏱️ Price–Time Interaction (Observed Behavior)
Price interacted with the 45-degree level early in the session (around the third 15-minute candle).
Completion of normal price capacity well before the later part of the trading day has historically shown signs of temporary downside exhaustion.
After reaching this zone, the market displayed short-term stabilization followed by upward expansion.
This aligns with a commonly observed Gann concept:
When expected price capacity is completed early in time, the probability of a directional reaction may increase.
📘 Educational Takeaways
Gann Square of 9 helps define intraday price limits in advance
Trend context determines how reference points are selected
Time alignment adds confirmation to price-degree levels
Normal (45-degree) reactions are more frequent than rare cases
The approach encourages rule-based observation over emotional reaction
📌 Shared strictly for educational and historical chart-study purposes.
#AxisBank #GannSquareOf9 #WDGann #IntradayAnalysis #MarketEducation #PriceTime #TechnicalAnalysis

Axis Bank | Gann Square of 9 Intraday Observation | 18 March 202Disclaimer:
This analysis is for educational purposes only. I am not a SEBI-registered advisor. This is not financial advice.
Symbol: AXISBANK (NSE)
Date Observed: 18 March 2024
Time Frame: 15-Minute Chart
Method Used: Gann Square of 9 (Price–Time Study)
This post documents a historical intraday market observation using the Gann Square of 9, focusing on how price movement capacity and time alignment can highlight potential intraday reaction zones.
📊 Initial Market Structure
Axis Bank displayed upward momentum from the opening 15-minute candle.
The low of the first 15-minute candle (~1043) was treated as the 0-degree reference level.
This reference point marks the start of the intraday price cycle and is used for further Square of 9 calculations.
Correct identification of the 0-degree level is a key requirement for consistent Square of 9 analysis.
🔢 Square of 9 Level Mapping
Using Square of 9 price-degree relationships, the following levels were observed:
0 Degree: ~1043
45 Degree (Observed Normal Capacity): ~1057
The 45-degree level often reflects the normal intraday price expansion range under regular market conditions.
⏱️ Price & Time Interaction (Observed Behavior)
Price interacted with the 45-degree level early in the session (around the second 15-minute candle).
Completion of the normal price capacity well before the later part of the trading day has historically shown temporary price pressure.
After reaching this zone, the market displayed rejection behavior followed by short-term downside expansion.
This observation aligns with a commonly studied Gann principle:
Early completion of expected price capacity may increase the probability of a market reaction.
📘 Educational Takeaways
Gann Square of 9 helps define logical intraday price limits
Normal (45-degree) reactions occur more frequently than exceptional cases
Time context adds important confirmation to price levels
Minor price deviations around calculated levels are part of normal market behavior
The method supports rule-based observation, not prediction
📌 Shared strictly for educational and historical chart-study purposes.
#AxisBank #GannSquareOf9 #WDGann #IntradayAnalysis #MarketEducation #PriceTime #TechnicalAnalysis

Mold Tech - At SupportCMP 558.60 on 04.02.26
The stock price has come down to 530 from 890 in the last 5 months. This time taking a halt and seems to be on support, as shown on the chart. If it bounces back from these levels, it may go into a bullish phase. Consider the risk-reward ratio.
Possible targets are 645/720. The setup fails if the price sustains below 520 on the daily chart.
All these illustrations are only for learning and educational purposes. This is not buying or selling advice. Do your own research before entering a trade.
All the best.

How ₹2 Lakh Can Be Invested in Gold & Silver Using SIP + GTTLet’s take a simple example of an investor who wants to invest ₹2,00,000 in Gold and Silver, but does not want to invest everything at one price.
Instead of predicting the bottom, the investor follows a rule-based SIP + GTT (dip buying) strategy.
📉 Market Context (At the Time of Planning)
Gold has already corrected ~22% from its all-time high
Silver has already corrected ~40% from its all-time high
Prices have cooled down, but further correction is still possible.
So the strategy is designed to work even if prices fall further.
📊 Current ETF Prices (Reference)
Gold ETF (GoldBeES): ₹115
Silver ETF (SilverBeES): ₹206
(Exact prices are not important — the strategy is percentage-based.)
💰 Total Capital in This Example
Total Investment Amount: ₹2,00,000
Investment Mode: ETFs (low cost, high liquidity)
Allocation
Gold ETF: ₹1,20,000
Silver ETF: ₹80,000
🪜 GTT “Dip Buying” Plan (Price-Based Buying)
In this example, the investor decides:
“I will invest more only when price falls, not based on news or emotions.”
So, GTT (Good Till Triggered) orders are placed at every 5% price fall.
🪙 Gold ETF – GTT Ladder (Example)
Current price: ₹115
Further possible correction assumed: 20%
Level Price (₹) Amount Invested
Current level 115 ₹30,000
5% fall 109 ₹25,000
10% fall 103 ₹25,000
15% fall 98 ₹20,000
20% fall 92 ₹20,000
Total Gold Investment — ₹1,20,000
👉 Result: Average price improves automatically if the market falls.
🥈 Silver ETF – GTT Ladder (Example)
Current price: ₹206
Further possible correction assumed: 30%
Level Price (₹) Amount Invested
Current level 206 ₹15,000
5% fall 196 ₹15,000
10% fall 185 ₹15,000
15% fall 175 ₹12,000
20% fall 165 ₹12,000
25% fall 155 ₹6,000
30% fall 144 ₹5,000
Total Silver Investment — ₹80,000
👉 Silver is more volatile, so the investment is spread across more levels.
📅 SIP + GTT Hybrid Plan (Example)
Along with dip buying, the investor also uses monthly SIPs for discipline.
🔁 Monthly SIP Setup
ETF Monthly SIP
Gold ETF ₹4,000
Silver ETF ₹2,000
👉 Total monthly SIP = ₹6,000
SIP runs every month (market up or down)
GTT orders activate only when price falls
This creates a balance of consistency + opportunity.
📈 Expected Outcome (Realistic Range)
Based on historical behaviour:
After 2 years: ~₹2.4 – ₹2.5 lakh
After 3 years: ~₹2.8 – ₹3.0 lakh
(Actual returns depend on global cycles and market conditions.)
🔄 Profit Booking Rules Used in This Example
Gold ETF:
At ~25–30% profit → sell 20–30% of units
Silver ETF:
At ~40–50% profit → sell 40–50% of units
Partial profit booking helps lock gains and reduce volatility risk.
🧾 Tax Treatment (India)
Holding less than 3 years:
Profit taxed as per income slab
Holding 3 years or more:
20% tax with indexation
Long-term holding improves tax efficiency.
🧠 Key Takeaway from This Example
This ₹2 lakh example shows that:
You don’t need to predict the bottom
Discipline matters more than timing
SIP builds consistency
GTT removes emotion
Averaging happens automatically
Plan the investment.
Let the market do the rest.
⚠️ Disclaimer
This content is shared strictly for educational and informational purposes only.
It is not investment advice or a recommendation to buy or sell any security.
Markets involve risk, and returns are not guaranteed.
Investors should do their own research or consult a qualified financial advisor before making any investment decisions.

Bharat Electronics Ltd (BEL) – Bullish Structure BreakoutNSE:BEL
🔹 Technical View
Price has decisively broken above a major supply / resistance zone (~₹428–432) after multiple rejections in the past.
Strong bullish momentum candle indicates institutional participation and demand dominance.
Previous resistance now likely to act as strong support on any pullback.
Structure shows higher highs & higher lows, confirming an ongoing uptrend.
Immediate levels to watch:
Support: ₹428–420
Upside potential: ₹460 → ₹480 (positional)
🔹 Volume & Price Action
Breakout supported by healthy volume expansion, validating the move.
No major selling pressure visible near breakout zone so far.
🔹 Fundamental View
BEL is a Navratna PSU and a key player in defence electronics.
Strong order book driven by:
Defence modernization
Indigenous manufacturing (Make in India / Atmanirbhar Bharat)
Consistent revenue visibility, healthy margins, and improving ROE.
Virtually debt-free balance sheet adds financial stability.
🔹 Future Growth Prospects
Long-term beneficiary of India’s rising defence spending.
Increasing focus on:
Radar systems
Electronic warfare
Missile & naval electronics
Export opportunities and private-defence collaboration act as additional growth triggers.
Well-positioned for sustainable compounding over the next few years.
🔹 Conclusion
Technically strong breakout + fundamentally robust business.
Suitable for positional & long-term investors on dips near support.
Trend remains bullish as long as price sustains above ₹420–428 zone.
==============
⚠️ Disclaimer:
==============
This content is shared strictly for educational and informational purposes.
We are not SEBI-registered investment advisors or analysts.
The views expressed are personal opinions, based on publicly available data and market observations.
Please consult a SEBI-registered investment advisor before taking any investment or trading decisions.
Any actions taken based on this content are entirely at your own risk and responsibility.
========================
Trade Secrets By Pratik
========================

Axis Bank | Intraday Price Behavior Using Square-Based GeometryDisclaimer:
This analysis is for educational purposes only. I am not a SEBI-registered advisor. This is not financial advice.
Educational Case Study | 1 April 2024
This idea shares an educational intraday case study on Axis Bank, focusing on how price capacity and time awareness were observed using square-based geometric methods discussed in classical market studies.
The objective is to study historical chart behavior, not to suggest trades or outcomes.
📊 Chart Context
Instrument: Axis Bank Ltd. (NSE)
Date: 1 April 2024
Timeframe: 15-minute (Intraday)
During the early part of the session, Axis Bank showed upward movement. A structured framework was applied to observe how price interacted with predefined reference levels as the session progressed.
🔍 Observational Framework Used
The low of the initial intraday structure was treated as a reference point (around 1048)
From this reference, square-based projections were observed
A level near 1064 aligned with a 45-degree projection, often associated with normal intraday price reach in historical studies
A higher projection was noted only as a contextual boundary, not an expectation
All levels were considered potential reaction zones, not fixed resistance points.
📈 Observed Intraday Behavior
Price gradually moved toward the projected zone during the session
Near this area, the market showed temporary pressure and difficulty sustaining above the level
A short-term response was observed around the projected zone
Minor price variation around the level was consistent with normal market behavior
This observation aligns with how price has historically interacted with similar geometric areas.
📘 Educational Takeaways
Square-based geometry can help outline logical intraday price capacity
The 45-degree projection often acts as an area of interest, not a precise barrier
Time awareness adds structure when observing intraday movement
Small deviations around projected zones are normal and expected
This approach encourages rule-based observation rather than precision fixation
All insights are based on historical chart study only.
📌 Important Note
This case study is shared strictly for learning and research purposes.
Geometric levels and time windows do not guarantee outcomes and should be treated as contextual analytical tools.
Market behavior may include:
Temporary pauses
Short-term pressure
Continuation or expansion depending on broader structure
🚀 Summary
This intraday case study demonstrates how price geometry and time alignment can be used to observe market behavior objectively and systematically.
More educational chart studies will follow.

Axis Bank | Intraday Price Behavior Near Square-Based LevelsDisclaimer:
This analysis is for educational purposes only. I am not a SEBI-registered advisor. This is not financial advice.
Educational Case Study | 8 April 2024
This idea documents an educational intraday case study on Axis Bank, focusing on how price–degree alignment and time awareness were observed using square-based geometric methods commonly referenced in classical market studies.
The purpose of this post is to study chart behavior, not to suggest or validate trades.
📊 Chart Context
Instrument: Axis Bank Ltd. (NSE)
Date: 8 April 2024
Timeframe: 15-minute (Intraday)
During the session, Axis Bank showed early upward momentum. A structured geometric framework was applied to observe how price behaved relative to predefined reference levels throughout the day.
🔍 Methodology (Observational Framework)
The session low was treated as a reference point for structure
From this reference, square-based projections were observed
A level near 1079 aligned with a 45-degree projection, often associated with normal intraday price reach in historical studies
Higher projections were noted only as contextual markers, not expectations
All levels were treated as potential reaction zones, not fixed barriers.
📈 Observed Intraday Behavior
Price approached the projected zone during mid-session
Near this area, the market showed temporary pressure and difficulty sustaining above the level
The broader intraday range remained contained within the projected boundary
This behavior aligned with previously observed historical responses around similar geometric zones
No execution, trade direction, or outcome is implied.
📘 Educational Takeaways
Square-based geometry can help define logical intraday price boundaries
Certain angles may act as areas of interest, depending on market context
Time awareness adds structure when observing intraday movement
This approach emphasizes price structure over indicators or signals
All insights are derived from historical chart observation only.
📌 Important Note
This case study is shared solely for learning and research purposes.
Geometric levels do not guarantee outcomes and should always be used as contextual tools.
Market behavior may include:
Temporary pauses
Short-term pressure
Range expansion or contraction depending on conditions
🚀 Summary
This intraday case study highlights how price geometry and time alignment can be used to observe market behavior in a structured and objective manner.
More educational chart studies will follow.

Bitcoin Investment strategyTime-Based Accumulation & Distribution Idea
Bitcoin has historically respected long-term time cycles. Rather than focusing on short-term price noise, this idea explores a time-window approach that aligns with structural supply shocks and market psychology.
The concept is simple but powerful:
identify a accumulation phase well before the event, and a distribution window once the cycle matures. These windows are not about exact tops or bottoms, but about positioning within a broader asymmetric opportunity.
This approach assumes volatility, drawdowns, and false signals along the way — but the edge lies in time in the market, not timing the market.
With the next accumulation already on the clock, the question isn’t if the cycle repeats — but how it expresses itself this time.
More insights as we get the next signal

NIFTY 2Hr ChannelNSE:NIFTY
NIFTY 50 – 2H Structure Update
Nifty is trading within a well-defined rising channel, indicating an intact medium-term bullish structure.
Price has taken support from the demand zone (blue zone) and bounced strongly, confirming buyers’ presence at lower levels.
Currently, price is consolidating above the previous breakout zone (~26,100), which now acts as an important support.
As long as this support holds, the higher-high higher-low structure remains valid.
🔹 Immediate Support: 26,100–26,000
🔹 Resistance / Supply: Near upper channel zone
🔹 Trend Bias: Buy on dips while above demand
🔹 Risk Area: Sustained breakdown below the blue zone can invite deeper retracement
Market is in a healthy pause after a sharp rally, not weakness.
Patience and level-based trading is the key here.
==============
⚠️ Disclaimer:
==============
This content is shared strictly for educational and informational purposes.
We are not SEBI-registered investment advisors or analysts.
The views expressed are personal opinions, based on publicly available data and market observations.
Please consult a SEBI-registered investment advisor before taking any investment or trading decisions.
Any actions taken based on this content are entirely at your own risk and responsibility.
========================
Trade Secrets By Pratik
========================

HEROMOTOCO – Wave 5 Setup Unfolding After Ideal Wave 4 📘 HERO MOTOCORP – Wave 5 Setup from Textbook Elliott Structure
Timeframe: Weekly
Structure: Impulsive (1–2–3–4 complete) → Preparing for Wave 5
Type: Positional Swing Setup | Elliott Wave Based
🔍 1. Elliott Wave Structure Breakdown:
Wave 1: ₹1,475 to ₹3,629
Wave 2: Retraced to ₹2,146.85 (between 50%–78.6% Fib of Wave 1)
Wave 3: Impulse to ₹6,246.25
Wave 4: Currently correcting between 38.2%–61.8% Fib of Wave 3 (₹4,680–₹3,712)
✅ Price found support near ₹3,344, which is just below 61.8% retracement – a common zone for Wave 4 completion.
🟫 2. Wave 4 Support Zone – ₹3,712 to ₹3,344:
This zone is acting as a potential reversal base with:
Fib retracement confluence: 38.2%–61.8% of Wave 3
Failed breakdown attempts followed by recovery candles
CHoCH observed in lower timeframes – suggests momentum shift
🟩 3. Breakout Confirmation Level – ₹4,680:
Breaking above ₹4,680–₹4,800 range would confirm Wave 5 activation
Indicates structure validation + bullish resumption
Close above this zone = strength & momentum breakout
📈 4. Wave 5 Target Projection – ₹6,595 to ₹7,019:
Calculated using:
113%–127% Fibonacci extension of Wave 3
Historical rally symmetry from Wave 1 and 3
Target zone offers positional upside potential of ~55%+
🛑 5. Stop Loss & Invalidation Level:
SL Zone: ₹3,344
Sustained breakdown below this invalidates Wave 4 base
Can lead to sharp drop toward ₹2,600–2,900 (next Fib cluster)
✅ 6. Trade Plan (Swing):
Accumulation Zone: ₹3,700 – ₹4,300 (if support structure holds)
Breakout Entry: Close above ₹4,680–4,800
Stop Loss: ₹3,344
Target: ₹6,595–7,019 (Wave 5 zone)
🧠 7. Why This Setup Matters:
Elliott Wave Confluence: Clean 1–2–3–4 formation
Textbook Fib Behavior: Wave 2 and Wave 4 within ideal retracement ranges
Defined R:R Structure: Tight invalidation + 1:2+ reward
Momentum Setup: Wave 5 can unfold rapidly once confirmed
📌 Conclusion:
HERO MOTOCORP is poised for a potential Wave 5 rally after a well-behaved corrective Wave 4.
A breakout above ₹4,680 could trigger bullish continuation toward ₹7,000+.
This is a classic trend continuation setup for wave-based swing traders.

AlbertDavid - At supportsCMP 752.70 on 05.01.26
All important levels are marked on the chart. The stock price is on the 5-year-old support levels. If it bounces from these levels, it may go into a bullish phase. Possible targets may be 900/1000/1100, and even more, depending on forthcoming parameters.
The setup fails if the price sustains below the 720-710 levels.
The risk-reward ratio is quite good at the moment.
One must determine the position size according to the risk capacity. Always keep your stop-loss confirmed.
All these illustrations are only for educational and learning purposes, it should not be considered as a buy or sell recommendation. Please do your research before any trade or consult your financial advisor.
All the best.

UCO BANK- BIG INVESTMENT OPPORTUNITYUCO BANK have currently taken support of HYDZ+QDZ+MDZ
LONGTERM TARGET should be at least 70 which is around 100% from current market price
have shared the QDZ chart
this stock should be added for regular trading opportunities as well

RR KABEL : Breakout Soon Candidate NSE:RRKABEL
🔹 Technical View
Strong recovery from ₹900 zone
Price testing major resistance at ₹1,500–1,510
Above ₹1,510 (weekly close): Breakout → ₹1,650–1,800
Support: ₹1,380–1,400
Structure turning higher high–higher low → bullish bias
🔹 Fundamental Snapshot
Strong brand in wires & cables
Consistent growth, improving margins
Beneficiary of housing, infra & electrification demand
🔹 Outlook
Above ₹1,510: Momentum trade active
Below ₹1,380: Consolidation risk
Medium–Long term: Structurally bullish
Disclaimer:
This content is shared strictly for educational and informational purposes.
We are not SEBI-registered investment advisors or analysts.
The views expressed are personal opinions, based on publicly available data and market observations.
Please consult a SEBI-registered investment advisor before taking any investment or trading decisions. Any actions taken based on this
content are entirely at your own risk and responsibility.
Trade Secrets By Pratik

KEI : Strong Business, Breakout Loading..??NSE:KEI
🔹 Technical Analysis
Price approaching long-term falling trendline
Break & sustain above ₹4,300 → bullish breakout confirmation
Resistance: ₹4,300–4,350
Support: ₹3,790
Above ₹4,300 → ₹4,600–4,900 possible
Below ₹3,790 → consolidation / pullback risk
🔹 Fundamental Snapshot
Strong player in cables & wires
Consistent revenue & profit growth
Healthy ROE, strong execution track record
Beneficiary of power, infra & real estate capex
🔹 Future Growth Outlook
Demand tailwinds from:
Power transmission
Renewables
Infrastructure push
Capacity expansion supports long-term growth
Structurally bullish business
🔹 View
Short term: Breakout watch above ₹4,300
Medium–Long term: Bullish on dips
Risk: Failure near trendline → range-bound move
==============
⚠️ Disclaimer:
==============
This content is shared strictly for educational and informational purposes.
We are not SEBI-registered investment advisors or analysts.
The views expressed are personal opinions, based on publicly available data and market observations.
Please consult a SEBI-registered investment advisor before taking any investment or trading decisions.
Any actions taken based on this content are entirely at your own risk and responsibility.
========================
Trade Secrets By Pratik
========================

JIOFIN : Strong Story, Weak Chart — Waiting for the Breakout.NSE:JIOFIN
📊 Jio Financial Services – Quick Analysis (Weekly)
CMP: ~₹297
🔹 Technical
Above ₹301, price may see a technical rebound with pullback buyers becoming active.
Primary trend bearish (lower highs–lower lows)
Price inside descending channel / falling wedge
Resistance: ₹330–335
Support: ₹288
Above ₹335 (weekly close): Trend reversal
Below ₹288: Downside risk to ₹260–240
🔹 Fundamental
Debt-free NBFC backed by Reliance Group
Strong balance sheet, execution still evolving
Valuation driven by future potential, not current earnings
🔹 Future Growth
Entry into lending, payments, AMC, digital finance
Leverages Jio ecosystem & data advantage
Growth depends on speed of monetization & execution
🔹 Outlook
Short term: Range-bound / weak
Medium term: Neutral till ₹335 breakout
Long term: Positive with patience
==============
⚠️ Disclaimer:
==============
This content is shared strictly for educational and informational purposes.
We are not SEBI-registered investment advisors or analysts.
The views expressed are personal opinions, based on publicly available data and market observations.
Please consult a SEBI-registered investment advisor before taking any investment or trading decisions.
Any actions taken based on this content are entirely at your own risk and responsibility.
========================
Trade Secrets By Pratik
========================

TRENT : When price corrects, smart money observes — not panics.NSE:TRENT
Technical View (Monthly)
Long-term trend bullish, currently in a healthy correction
0.618 Fibonacci support: ₹3,900–4,100 → key demand zone
Resistance: ₹4,900–5,000 (must cross for fresh uptrend)
Trend damage only if: Monthly close below ₹3,800
Expect sideways consolidation before the next big move
Fundamental View
Strong retail brands, aggressive store expansion
Earnings growth is strong, but the valuation was stretched
Current correction = valuation & time adjustment, not business issue
Future Growth Outlook
Positive long-term drivers: consumption growth + scale benefits
Near-term returns may stay muted; 3–5 year story intact
Actionable Summary
Investors: Accumulate near ₹4,000 with patience
Traders: Bullish only above ₹5,000
Risk: Breakdown below ₹3,800
Verdict: High-quality stock in correction phase, not a trend reversal.
==============
⚠️ Disclaimer:
==============
This content is shared strictly for educational and informational purposes.
We are not SEBI-registered investment advisors or analysts.
The views expressed are personal opinions, based on publicly available data and market observations.
Please consult a SEBI-registered investment advisor before taking any investment or trading decisions.
Any actions taken based on this content are entirely at your own risk and responsibility.
========================
Trade Secrets By Pratik
========================

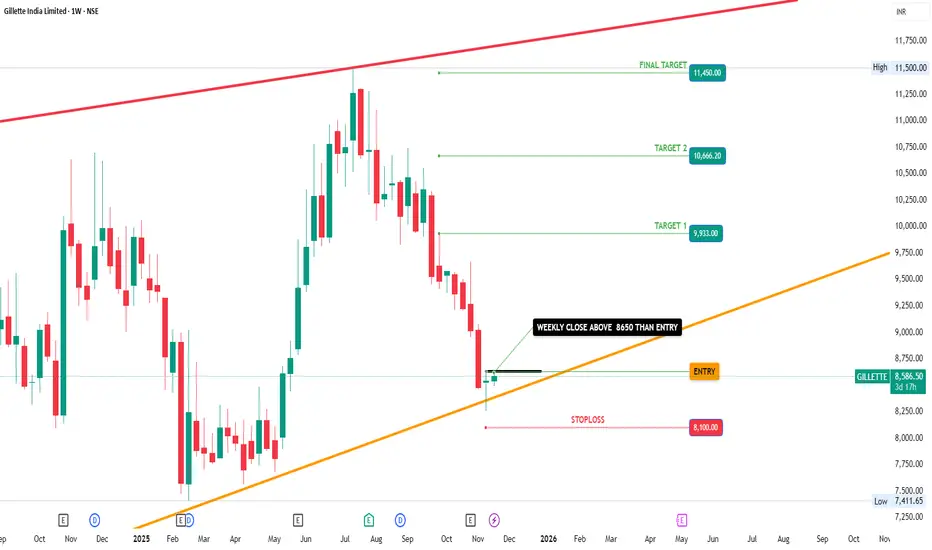
GILLETTE INDIA IN KEEP IN RADARGILLETTE now at strong trend line support on weekly time frame. Very small risk and good reward levels almost 1:4 to 1:5 so its good stock for investment for long term. So keep on watchlist for investment purpose.
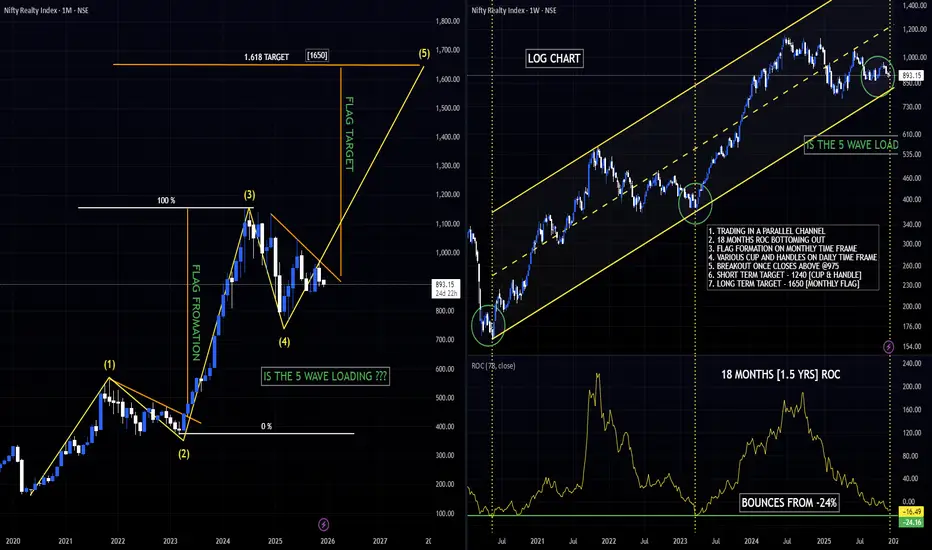
NIFTY REALTY [CNXREALTY] ABOUT TO GIVE THE BIGGEST RALLY?Technical Setup 🚀
1. Trading in a parallel channel
2. 18-month ROC bottoming out
3. Flag formation on the monthly time frame
4. Multiple cup-and-handle patterns on the daily time frame
5. Breakout expected once it closes above ₹975
6. Short-term target: ₹1,240 (Cup & Handle)
7. Long-term target: ₹1,650 (Monthly Flag)
Feel free to share your thoughts in the comments!
Not SEBI-registered ⏐ All views are personal ⏐ Not investment advice
DRAGONFLY LTDDRAGONFLY INC, as per chart view it formed FALLING WEDGE PATTERN and made breakout with entry level $6.88 with EMA crossover. We can expect the Final target to $13.

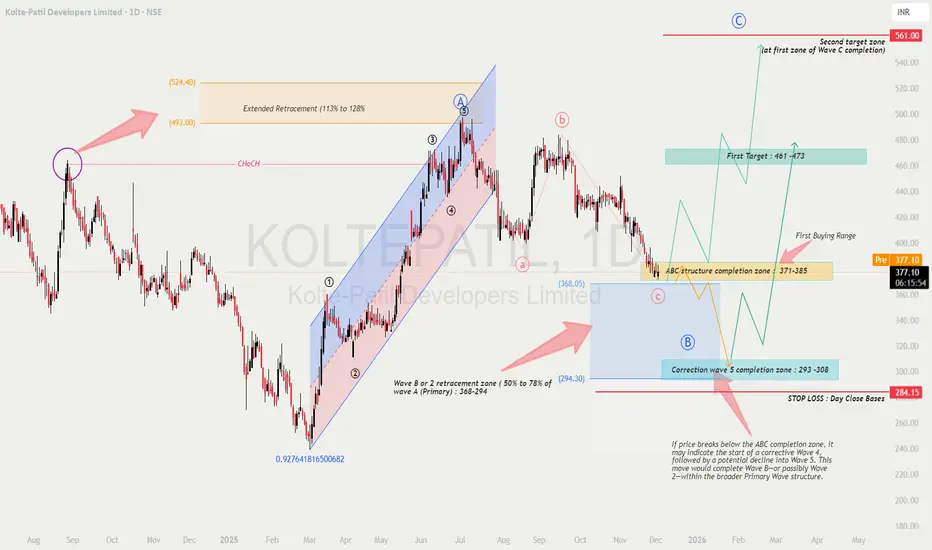
KOLTEPATIL - Wave Analysis
Educational breakdown based solely on chart structure
🔍 1. Chart Findings & Market Structure
The chart shows a clear Elliott Wave progression, where the previous impulse (Primary Wave A) topped near ₹493–524, followed by a corrective ABC decline.
✔ Key Observations
Primary Wave A formed an impulsive rally inside a rising channel.
The price later broke structure (CHoCH) indicating loss of momentum.
Current price (₹377) is trading inside the ABC structure completion zone of ₹371–385, a critical decision area.
A deeper correction toward ₹293–308 remains possible if Wave C extends.
🎓 2. Educational Points (Why These Levels Matter)
📘 A. Extended Retracement Zone: 113–128%
The chart marks ₹493–524 as the extended retracement area, which often acts as:
A wave A termination area
Strong reversal zone
Liquidity grab region
This supports the idea that the major impulse from March–July is complete.
📘 B. Wave B / Wave 2 Retracement
A natural correction for Wave B or Wave 2 typically pulls back 50–78% of the previous impulse.
This gives the ₹368–294 broad range as the acceptable retracement.
📘 C. Completing Wave C (Corrective ABC)
Wave C generally equals Wave A or 1.272–1.618 extension of Wave A.
The chart’s projection supports a potential completion:
First zone: ₹371–385 (current test)
Final zone: ₹293–308 (if extended C-wave unfolds)
📉 3. Current Price Action Insight
Price is currently hovering near the ABC structure completion zone (₹371–385).
No strong bullish reversal candle is visible yet—indicating buyers are waiting for confirmation.
Price remains in a downward corrective structure, but nearing exhaustion.
This phase is ideal for planning, not rushing.
🔮 4. Future Prediction Based on Wave Theory
Two scenarios emerge:
🟦 Scenario 1: ABC Correction Completes at Current Levels (₹371–385)
If the current demand zone holds:
Price forms a wave B bottom and begins Primary Wave C upward.
Expected targets:
🎯 First Target: ₹461–473
🎯 Final Target: ₹561 (Primary Wave C completion zone)
🟥 Scenario 2: ABC Correction Extends to ₹293–308
If ₹371–385 fails:
Market enters the correction wave 5 completion zone (₹293–308).
From this demand block, a stronger bullish reversal is expected.
Long-term bullish structure remains intact if it stays above ₹284 (stop level).
🛒 5. Buying Strategy (Educated Approach)
🟩 FIRST BUYING RANGE: ₹371–385 (Conservative Entry)
Enter only if:
Strong bullish candle (engulfing / pin bar / OB reclaim)
RSI bullish divergence
Price closes above structure high (minor CHoCH)
🟦 SECOND BUYING RANGE: ₹293–308 (High-Value Entry)
A deeper correction provides:
Lower risk
Maximum R:R
Stronger probability of reversal
Use this zone if the first one fails.
⚖ 6. Risk–Reward Analysis
If entering at ₹371–385
Stop-Loss: Below ₹284 (daily close basis)
Upside Potential: Up to ₹561
Reward : Risk Ratio: Approx 3.5–4.2 R
If entering at ₹293–308
Stop-Loss: Below ₹284
Upside Potential: Up to ₹473–561
Reward : Risk Ratio: Approx 5–7 R (excellent)
🔐 7. Confirmation Strategies for Better Entries
Use any two or more of the following:
✔ 1. Market Structure Shift
Wait for a CHoCH above the last swing high inside the zone.
✔ 2. Volume Expansion
Rising green volume during rebound increases reliability.
✔ 3. Bullish Divergence (RSI or MACD)
Signals weakening sellers.
✔ 4. Break & Retest Method
Let price break a minor resistance
Enter on retest to confirm strength
✔ 5. Demand Zone Reaction
Look for:
Long tail candles
Absorption wicks
Order block reclaim
These indicate smart money interest.
🧠 8. Summary & View
The stock is in the final leg of a correction and is approaching highly reactive Fibonacci zones.
Structure favors a bullish wave (Primary Wave C) in the coming months if key support holds.
📌 First confirmation: Bounce from ₹371–385
📌 Strongest bullish case: Reversal from ₹293–308
📌 Invalidation: Close below ₹284
The long setup has strong wave logic, clean levels, and attractive R:R.
⚠️ Disclaimer
This analysis is for educational purposes only and reflects wave-structure interpretation based solely on the provided chart.
I am not a SEBI-registered analyst.
Please conduct your own research or consult your financial advisor before trading or investing.
FLUENCE ENERGYFLUENCE ENERGY MADE DOUBLE BOTTOM with DIVERGENCE in monthly chart and also in process of forming CUP & HANDLE FORMATION, and it is at resistence level at $24, if it breaksout resistance at $24 we can expect to reach $30 & $44.
Chart analysis done on best of my knowledge, it may reach or may not reach targets :-)

KAZIA THERAPEUTICS LTD SPONSORED ADRKZIA made double bottom with divergence with good volume and breakout at $4.45 with first target of $22.5, if and second target of $41.7 and with can expect strong resistance at $41.7 and reverse might happen. If KZIA did breakout at this level we can expect rally till $79.
Analysis is made on weekly time fame for long term view
It is just my chart analysis upto best of my knowledge. As it is share market anything happen because market effects on many things happen in the world.
Thank you
