ZEEL | Investment Pick📊 DETAILS
Sector: TV Broadcasting & Software Production
Mkt Cap: 27,062 cr
Zee Entertainment Enterprises is mainly in the following businesses: Broadcasting of Satellite Television Channels, Space Selling agent for other satellite television channels, and Sale of Media Content i.e. programs / film rights / feeds /music rights.
TTM PE : --
Sector PE : 32.94
Beta : 0.95
📚 INSIGHTS
Mid range performer
Stock with medium financial performance with average price momentum and valuation. These stocks may be affordable and are showing some investors interest.
3.68% away from 52 week high
Underperformer - Zee Entertainment Enterprises up by 3.51% v/s NIFTY 50 up by 7.5% in last 1 month
📈 FINANCIALS
Piotroski Score of 5/9 indicates Average Financials
Disclaimer: This analysis is for educational purposes only, and I'm not a SEBI registered analyst.
If you found this analysis helpful, I encourage you to like and share it. Your observations and comments are also welcomed below. Your support, likes, follows, and comments motivate me to consistently share valuable insights with you.
🔍 More Analysis & Trade Setups 🔍
For more technical analysis and trade setups, make sure to follow me on TradingView: www.tradingview.com
Investment

IOB | Swing Trade📊 DETAILS
Sector: Bank - Public
Mkt Cap: 77,027 cr
Indian Overseas Bank was founded in 1937 by Chidambaram Chettyar. It was one of the 14 major banks that were nationalized in 1969.
TTM PE : 32.90 (High PE)
Sector PE : 11.43
Beta : 1.65
📚 INSIGHTS
Mid-range performer
Stock with medium financial performance with average price momentum and valuation. These stocks may be affordable and are showing some investors interest.
20.94% away from 52 week high
Underperformer - Indian Overseas Bank up by 2.01% v/s NIFTY 50 up by 6.8% in last 1 month
📈 FINANCIALS
Piotroski Score of 4/9 indicates Weak Financials
Disclaimer: This analysis is for educational purposes only, and I'm not a SEBI registered analyst.
If you found this analysis helpful, I encourage you to like and share it. Your observations and comments are also welcomed below. Your support, likes, follows, and comments motivate me to consistently share valuable insights with you.
🔍 More Analysis & Trade Setups 🔍
For more technical analysis and trade setups, make sure to follow me on TradingView: www.tradingview.com

CREATIVE | Positional Trade📊 DETAILS
Sector: Misc. Commercial Services
Mkt Cap: 1,061 cr
Creative Newtech Ltd (Formerly known as Creative Peripherals and Distribution
Limited) is a distribution and marketing partner of Global IT, Imaging and Lifestyle brands catering to their distribution requirements through its omni-channel presence.
TTM PE : 34.83 (High PE)
Sector PE : 41.41
Beta : 1.18
📚 INSIGHTS
Mid-range performer
Stock with medium financial performance with average price momentum and valuation. These stocks may be affordable and are showing some investors interest.
10.91% away from 52 week high
Underperformer - Creative Newtech down by -4.16% v/s NIFTY 50 up by 8.13% in last 1 month
📈 FINANCIALS
Piotroski Score of 5/9 indicates Average Financials
Disclaimer: This analysis is for educational purposes only, and I'm not a SEBI registered analyst.
If you found this analysis helpful, I encourage you to like and share it. Your observations and comments are also welcomed below. Your support, likes, follows, and comments motivate me to consistently share valuable insights with you.
🔍 More Analysis & Trade Setups 🔍
For more technical analysis and trade setups, make sure to follow me on TradingView: www.tradingview.com

INDIGO | Swing Trade📊 Details
Interglobe Aviation Ltd (Indigo) is India’s largest passenger airline operating as a low-cost carrier. Serving 86 destinations including 24 international destinations, it provides passengers with a simple, unbundled product, fulfilling its singular brand promise of providing “low fares, on-time flights, and a courteous and hassle-free service” to its customers. IndiGo commenced operations in August 2006 with a single aircraft and has grown its fleet to 262 aircrafts.
Disclaimer: This analysis is solely for educational purposes and does not make me a SEBI registered analyst.
If you found this analysis helpful, I encourage you to like and share it. Your observations and comments are also welcomed below. Your support, likes, follows, and comments motivate me to consistently share valuable insights with you.
🔍 More Analysis & Trade Setups 🔍
For more technical analysis and trade setups, make sure to follow me on TradingView: www.tradingview.com

DCMSHRIRAM | Investment Pick📊 Details
DCM Shriram is engaged in the business of manufacturing facilities of Fertiliser, Chloro Vinyl & Cement in Kota (Rajasthan) and of Chlor- Alkali in Bharuch (Gujrat).(Source : Company Web-site )
Disclaimer: This analysis is solely for educational purposes and does not make me a SEBI registered analyst.
If you found this analysis helpful, I encourage you to like and share it. Your observations and comments are also welcomed below. Your support, likes, follows, and comments motivate me to consistently share valuable insights with you.
🔍 More Analysis & Trade Setups 🔍
For more technical analysis and trade setups, make sure to follow me on TradingView: www.tradingview.com

DRREDDY | Investment Pick📊 DETAILS
Sector: Pharmaceuticals & Drugs
Mkt Cap: 90,938 cr
Dr. Reddy's Laboratories Ltd is a leading India-based pharamceutical company which offers a portfolio of products and services, including Active Pharmaceutical Ingredients (APIs), Custom Pharmaceutical services (CPS), generics, biosimilars and differentiated formulations.
TTM PE : 17.87 (Low PE)
Sector PE : 45.28
Beta : 0.49
📚 INSIGHTS
Strong Performer
Stock with good financial performance alongside good to expensive valuation, but lacks price momentum as suggested by technical indicators
9.51% away from 52 week high
Underperformer - Dr Reddys Laboratories down by -0.74% v/s NIFTY 50 down by -0.29% in last 1 month
📈 FINANCIALS
Piotroski Score of 8/9 indicates Strong Financials
Disclaimer: This analysis is for educational purposes only, and I'm not a SEBI registered analyst.
If you found this analysis helpful, I encourage you to like and share it. Your observations and comments are also welcomed below. Your support, likes, follows, and comments motivate me to consistently share valuable insights with you.
🔍 More Analysis & Trade Setups 🔍
For more technical analysis and trade setups, make sure to follow me on TradingView: www.tradingview.com

KPIL | Multiyear Breakout📊 DETAILS
Sector: Transmission Towers / Equipments
Mkt Cap: 11,449 cr
Kalpataru Power Transmission Ltd is a global EPC player with diversified interest in power transmission and distribution, oil and gas pipeline, railways and biomass based power generation.
TTM PE : 23.95 (High PE)
Sector PE : 20.38
Beta : 0.42
📚 INSIGHTS
Mid-range performer
Stock with medium financial performance with average price momentum and valuation. These stocks may be affordable and are showing some investors interest.
3.84% away from 52 week high
Outperformer - Kalpataru Projects International up by 10.19% v/s NIFTY 50 up by 7.57% in last 1 month
📈 FINANCIALS
Piotroski Score of 5/9 indicates Average Financials
Disclaimer: This analysis is for educational purposes only, and I'm not a SEBI registered analyst.
If you found this analysis helpful, I encourage you to like and share it. Your observations and comments are also welcomed below. Your support, likes, follows, and comments motivate me to consistently share valuable insights with you.
🔍 More Analysis & Trade Setups 🔍
For more technical analysis and trade setups, make sure to follow me on TradingView: www.tradingview.com

EIHOTEL | Multiyear Breakout📊 DETAILS
Sector: Hotel, Resort & Restaurants
Mkt Cap: 15,205 cr
EIH is primarily engaged in owning and managing premium luxury hotels and cruisers under the luxury Oberoi, Trident and Maidens brands. The Company is also engaged in flight catering, airport restaurants, project management and corporate air charters.(Source : 202003 Annual Report Page No:124)
TTM PE : 35.86 (Average PE)
Sector PE : 55.58
Beta : 0.73
📚 INSIGHTS
Strong Performer
Stock with consistent financial performance, quality management, and strong technical momentum indicating good investor enthusiasm. Currently valued at Good to expensive valuation
11.75% away from 52 week high
Underperformer - EIH up by 5.01% v/s NIFTY 50 up by 8.82% in last 1 month
📈 FINANCIALS
Piotroski Score of 9/9 indicates Strong Financials
Disclaimer: This analysis is for educational purposes only, and I'm not a SEBI registered analyst.
If you found this analysis helpful, I encourage you to like and share it. Your observations and comments are also welcomed below. Your support, likes, follows, and comments motivate me to consistently share valuable insights with you.
🔍 More Analysis & Trade Setups 🔍
For more technical analysis and trade setups, make sure to follow me on TradingView: www.tradingview.com

Time to Sell_ RelianceNamaste!
Any stock can not sustain it's bullish behaviour, without a correction.
Reliance has to correct, before going up again. It is the proved nature of markets.
Why selling any stock is a good idea.
1. To buy it back at a lower prices,
2. To full-fill urgent needs of money,
3. To let the weak hands enjoy the euphoria and not to stay in the markets when there is an extreme optimism.
So, I am suggesting a logical price to book profits in Reliance. The price would be Rs 3100. Why?
Look, the people who would have bought at around Rs 1100, will be getting around 2.9 times of there investment amount. Hence, they will be booking profits, resulting in a correction.
Okay, I will be sell it at the above price, but what if I want to buy it again.
A: You have to wait for greater than 15% correction from All time highs, before buying it again. Because, In India, LTCG is around 10%, so you have to get the stock back at 15% or more correction, to compensate for your extra efforts.
Disclaimer: The analysis I have shared is based on my understanding of the markets. Please do your due-diligence and you are solely responsible for your decisions.

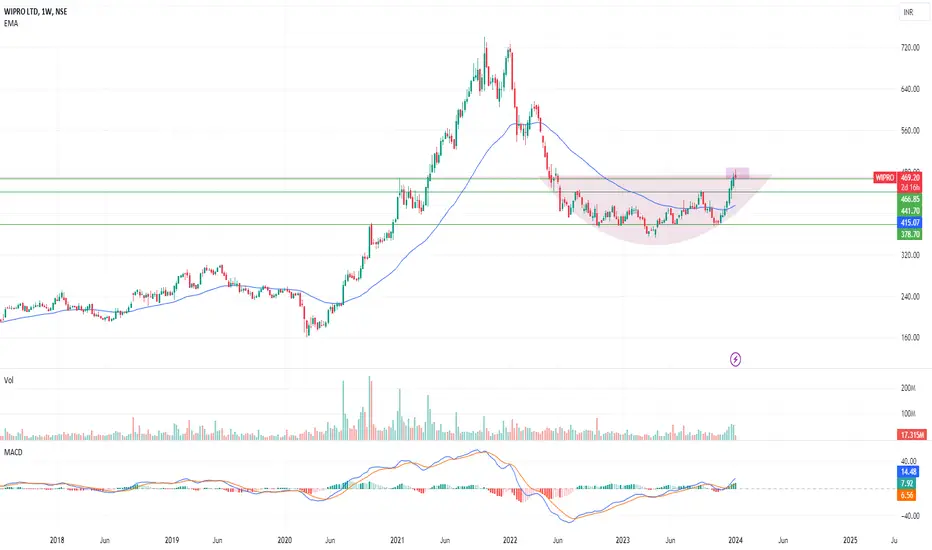
Right time to invest in WIPROIn weekly chart we can see after double top price was fall. And whole 2023 reate a strong support at 441.70.
Very Strong Support - 441.70
Now 464 resistance level is breaking. If we see this week creating a red candle but volume is good and as expected price will go higher and touch 500 within couple of month.
It Creating cup and handle pattern.
If we see very carefully couple 7 consecutive 7 week creating green candle with a good volume.
It's a good sign for investor.
Sparc - Low Risk SetupThe stock has been traveling in a wedge formation for the last two months. This time it is at the bottom. Can take a chance if bounces from here.
The setup fails if sustains below the lower trendline of the wedge for 2 days.
This is only for learning and sharing purposes. Not a piece of trading advice in any form.
All the best.

BRITANNIA | Investment Pick📊 Details
Britannia Industries is one of Indias leading food companies with a 100 year legacy and annual revenues in excess of Rs. 9000 Cr. Britannia is among the most trusted food brands, and manufactures Indias favorite brands like Good Day, Tiger, NutriChoice, Milk Bikis and Marie Gold which are household names in India. Britannias product portfolio includes Biscuits, Bread, Cakes, Rusk, and Dairy products including Cheese, Beverages, Milk and Yoghurt.
Disclaimer: This analysis is solely for educational purposes and does not make me a SEBI registered analyst.
If you found this analysis helpful, I encourage you to like and share it. Your observations and comments are also welcomed below. Your support, likes, follows, and comments motivate me to consistently share valuable insights with you.
🔍 More Analysis & Trade Setups 🔍
For more technical analysis and trade setups, make sure to follow me on TradingView: www.tradingview.com

NGL Fine Chem Ltd | a Momentum pharma stockNGL Fine Chem Ltd | a Momentum pharma stock
Established in 1981, NGL Fine-Chem Limited manufacturers and markets APIs, Intermediates and Finished Dosage forms for human and animal pharmaceutical product. It caters to various Indian and global companies with high quality and reliable products.
Financial:
Market Cap = 1,382 Cr. ROCE = 11.5 % ROE = 9.31 %
Debt to equity = 0.11 Promoter holding = 73.1 % Piotroski score = 4.00
Quick ratio = 2.06 Current ratio = 2.58 Return on assets = 7.11 %
Profit Var 3Yrs = 18.5 % Sales growth 3Years = 21.8 % Pledged percentage = 0.00 %
in Technically you can see monthly and weekly strong RSI Momentum
financially also debt free company as well as company has good capex plan in comming years
so this will be next multibagger if hold for long time.
Note: I am not SEBI registered financial Adviser. I solely present my views on chart .I do not charge any kind of service. This is not buy sell recommendation.
If you like my ideas than like ,boost and follow me for more ideas.
Thanks and comment freely

IRCTC | Swing Trade📊 Details
Incorporated in 1999, IRCTC is a Mini Ratna (Category 1, Central Public Sector Enterprises ) and the only company authorized by the Indian government to provide online railway tickets, catering services, and packaged drinking water
at railway stations and trains in India
Disclaimer: This analysis is solely for educational purposes and does not make me a SEBI registered analyst.
If you found this analysis helpful, I encourage you to like and share it. Your observations and comments are also welcomed below. Your support, likes, follows, and comments motivate me to consistently share valuable insights with you.
🔍 More Analysis & Trade Setups 🔍
For more technical analysis and trade setups, make sure to follow me on TradingView: www.tradingview.com

UNOMINDA | Swing Trade📊 DETAILS
Sector: Auto Ancillaries - Head lamps & lights
Mkt Cap: 38,537 cr
Incorporated in 1985, Uno Minda Ltd is a manufacturer and supplier of Automotive Solutions and systems to Original Equipment Manufacturers
TTM PE : 51.92 (Average PE)
Sector PE : 82.89
Beta : 0.30
📚 INSIGHTS
Strong Performer
Stock with good financial performance alongside good to expensive valuation, but lacks price momentum as suggested by technical indicators
3.22% away from 52 week high
Underperformer - UNO Minda down by -1.05% v/s NIFTY 50 up by 9.4% in last 1 month
📈 FINANCIALS
Piotroski Score of 6/9 indicates Average Financials
Disclaimer: This analysis is for educational purposes only, and I'm not a SEBI registered analyst.
If you found this analysis helpful, I encourage you to like and share it. Your observations and comments are also welcomed below. Your support, likes, follows, and comments motivate me to consistently share valuable insights with you.
🔍 More Analysis & Trade Setups 🔍
For more technical analysis and trade setups, make sure to follow me on TradingView: www.tradingview.com

TRIL | Swing Trade📊 Details
Transformers and Rectifiers (India) Ltd. is a manufacturer of Power, Furnace and Rectifier Transformers.
Disclaimer: This analysis is solely for educational purposes and does not make me a SEBI registered analyst.
If you found this analysis helpful, I encourage you to like and share it. Your observations and comments are also welcomed below. Your support, likes, follows, and comments motivate me to consistently share valuable insights with you.
🔍 More Analysis & Trade Setups 🔍
For more technical analysis and trade setups, make sure to follow me on TradingView: www.tradingview.com

KKCLStock is super bullish as per technical and fundamentals. Price above 770 can go up to 830-850 in a short term trend. Pure volume based breakout is expected.

SHEELA FOAM Stock is in good shape and FII and DII have increased their holding. Stock is available at an attractive price and has a potential to give 50-60% rise.

CAMS | Swing Trade📊 Details
The company is a mutual funds transfer agency. It provides investor services, distributor services and asset management companies (AMC) services.
Disclaimer: This analysis is solely for educational purposes and does not make me a SEBI registered analyst.
If you found this analysis helpful, I encourage you to like and share it. Your observations and comments are also welcomed below. Your support, likes, follows, and comments motivate me to consistently share valuable insights with you.
🔍 More Analysis & Trade Setups 🔍
For more technical analysis and trade setups, make sure to follow me on TradingView: www.tradingview.com

GOKULAGRO | Swing Trade📊 DETAILS
Sector: Vegetable Oils & Products
Mkt Cap: 1,772 cr
Company is in manufacturing and processing of various kinds of Edible, Non-Edible oils and meals. Company has manufacturing facility in Gandhidham, Gujarat, India.
TTM PE : 13.83 (High PE)
Sector PE : 51.35
Beta : 1.37
📚 INSIGHTS
Mid-range performer
Stock with medium financial performance with average price momentum and valuation. These stocks may be affordable and are showing some investors interest.
20.59% away from 52 week high
Outperformer - Gokul Agro Resources down by -0.61% v/s NIFTY 50 down by -1.62% in last 1 month
📈 FINANCIALS
Piotroski Score of 4/9 indicates Weak Financials
Disclaimer: This analysis Is For educational purposes only, And I'm not a SEBI registered analyst.
If you found this analysis helpful, I encourage you to like and share it. Your observations and comments are also welcomed below. Your support, likes, follows, and comments motivate me to consistently share valuable insights with you.
🔍 More Analysis & Trade Setups 🔍
For more technical analysis and trade setups, make sure to follow me on TradingView: www.tradingview.com

3MINDIA | Investment Pick📊 DETAILS
Sector: Diversified
Mkt Cap: 35,425 cr
3M India is a subsidiary of 3M Company, USA. The Company manages its operations in four operating segments: Safety & Industrial , Transportation & Electronics, Health Care and Consumer. In India, the Company has manufacturing facilities at Ahmedabad, Bangalore, Pune and has a R&D Center in Bangalore.(Source : 202003 Annual Report Page No:137)
TTM PE : 66.11 (Low PE)
Sector PE : 52.33
Beta : 0.22
📚 INSIGHTS
MC Insights PRO
Stock with good financial performance alongside good to expensive valuation, but lacks price momentum as suggested by technical indicators
5.42% away from 52 week high
Underperformer - 3M India up by 3.7% v/s NIFTY 50 up by 8.32% in last 1 month
📈 FINANCIALS
Piotroski Score of 8/9 indicates Strong Financials
Disclaimer: This analysis is for educational purposes only, and I'm not a SEBI registered analyst.
If you found this analysis helpful, I encourage you to like and share it. Your observations and comments are also welcomed below. Your support, likes, follows, and comments motivate me to consistently share valuable insights with you.
🔍 More Analysis & Trade Setups 🔍
For more technical analysis and trade setups, make sure to follow me on TradingView: www.tradingview.com

JMFINANCIL | Swing Trade📊 DETAILS
Sector: Finance - Investment
Mkt Cap: 8,300 cr
JM Financial Ltd is an integrated and diversified financial services group. Its primary businesses include mortgage lending, distressed credit, asset management. It is also engaged in investment banking and the management of private equity funds.
TTM PE : 13.64 (Average PE)
Sector PE : 30.55
Beta : 1.03
📚 INSIGHTS
Value Trap
Affordable valution for this stock may tempt investors to buy. Be selective, keeping in mind balance sheet fundamentals.
9.38% away from 52 week high
Underperformer - JM Financial down by -2.03% v/s NIFTY 50 up by 7.57% in last 1 month
📈 FINANCIALS
Piotroski Score of 2/9 indicates Weak Financials
Disclaimer: This analysis is for educational purposes only, and I'm not a SEBI registered analyst.
If you found this analysis helpful, I encourage you to like and share it. Your observations and comments are also welcomed below. Your support, likes, follows, and comments motivate me to consistently share valuable insights with you.
🔍 More Analysis & Trade Setups 🔍
For more technical analysis and trade setups, make sure to follow me on TradingView: www.tradingview.com

LAURUSLABS | Swing Trade📊 DETAILS
Sector: Pharmaceuticals & Drugs
Mkt Cap: 21,545 cr
Founded in 2005, Laurus Labs is a research-driven pharmaceutical and biotechnology company having a global leadership
position in select Active Pharmaceutical Ingredients (APIs) including anti-retroviral, oncology drugs (incl High Potent APIs), Cardiovascular, and Gastro therapeutics. They also offer integrated CMO and CDMO services to Global Innovators from Clinical phase drug development to commercial manufacturing.
Laurus employs 6500+ people, including around 1050+ scientists at more than 11 facilities approved by global agencies USFDA, WHO-Geneva, Japan-PDMA, UK-MHRA, EMA, TGA etc.
TTM PE : 58.61 (High PE)
Sector PE : 47.13
Beta : 0.73
📚 INSIGHTS
Mid range performer
Stock with medium financial performance with average price momentum and valuation. These stocks may be affordable and are showing some investors interest.
7.73% away from 52 week high
Underperformer - Laurus Labs up by 4.26% v/s NIFTY 50 up by 8.74% in last 1 month
📈 FINANCIALS
Piotroski Score of 5/9 indicates Average Financials
Disclaimer: This analysis is for educational purposes only, and I'm not a SEBI registered analyst.
If you found this analysis helpful, I encourage you to like and share it. Your observations and comments are also welcomed below. Your support, likes, follows, and comments motivate me to consistently share valuable insights with you.
🔍 More Analysis & Trade Setups 🔍
For more technical analysis and trade setups, make sure to follow me on TradingView: www.tradingview.com
