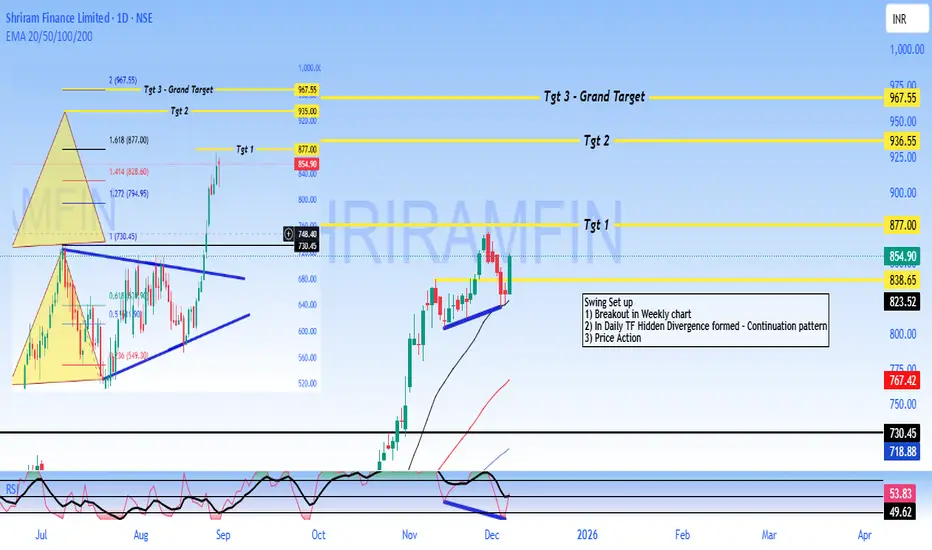
SHRIRAM - Buy - SwingTrading #Shriram Finance Limited - #Technical Analysis
Price: 854.90
#Technical Setup
Pattern: Continuation pattern with bullish hidden divergence following weekly breakout
Key Levels:
- Target 1: 877.00
- Target 2: 936.55
- Target 3: 967.55
- Support: 838 - 825 (critical)
- Major Support: 730.45
#Outlook
The chart shows a swing trading setup with upside potential toward 877 - 967 if support at 838 holds. A break below 825 would invalidate the bullish structure.
DISCLAIMER
This is NOT investment advice. This analysis is for educational purposes only. Trading involves substantial risk of loss. Always conduct your own research and consult a SEBI-registered financial advisor before making investment decisions. Past performance and technical patterns do not guarantee future results. The author assumes no responsibility for any losses incurred.
Investmentidea
IOCL - Investment Doubler - MultiTimeframe Analysis
**📊 Indian Oil Corporation (IOC) - Technical Analysis**
#Multiple timeframe analysis showing IOC at a critical juncture around ₹136-163 levels.
Key Observations:
- On an Yearly Chart, Prev Yearly candle attempt failed to do Breakout.
- On Half-yearly chart breakout confirmed and the stock retraced and bouncing back to Key Levels.
- On an Yearly chart the Previous leg which attempted to break Previous ATH has strong #Momentum - The Stock Bounce back on Major Demand Zone, signs of retracement complete.
- Current price: 163.67
- Multiple "Buy on Dips" opportunities identified across timeframes
- 2017 highs acting as reference resistance levels
- Target levels marked: Tgt 1 196.80, Tgt 2 220, Tgt 3 250, Tgt 4 280
- Conservative stop-loss suggested on candle closing basis (short-term)
Trading Strategy:
- Swing trading approach recommended
- #Investment Doubler potential noted on long-term chart
- Expecting 2017 yearly breakout on extended timeframe
DISCLAIMER:
This is for educational and informational purposes only. This is NOT investment advice. Trading and investing in stocks involves substantial risk of loss. Always conduct your own research and consult with a certified financial advisor before making any investment decisions. Past performance does not guarantee future results. The author/analyst is not responsible for any losses incurred from trading decisions based on this analysis.
#TradingView #IOC #IndianOilCorporation #StockMarket #TechnicalAnalysis #SwingTrading #NSE #IndianStocks #BuyOnDips #ChartAnalysis #BreakoutTrading #StockTrading #MarketAnalysis #Nifty #BSE #EquityTrading #ShareMarket #InvestingIndia #TradingSetup #PriceAction #SupportResistance #TrendAnalysis #DayTrading #PositionalTrading #StockTips #MarketOutlook #TechnicalChart #CandlestickPattern #BullishSetup #FinancialMarkets
💡 Remember: Trade at your own risk. Risk management is key to successful trading!

BPCL Breaks Structure, Big Targets Ahead: Long-Term Chart TurnsBPCL is currently positioned at a highly important zone on the higher-timeframe chart where price is attempting to shift from a prolonged consolidation into a potential expansion phase. The stock has respected a long-term structure and is now trading near a critical breakout region, making it an interesting candidate for positional and long-term traders. However, the setup is still in the developing stage and requires confirmation before any aggressive long exposure.
From a structure perspective, BPCL has formed a broad base after a long corrective phase. Price action is compressing near the upper boundary of this range, suggesting that volatility expansion could occur in the coming sessions. A sustained move above the key resistance zone, accompanied by strong volume and follow-through candles, would indicate strength and increase the probability of an upside continuation toward higher targets.
In the bullish scenario, a confirmed breakout and successful retest could open the path for a gradual move toward the next resistance cluster. If momentum sustains, the stock may attempt a trend continuation move in phases rather than a straight rally. Positional traders should focus on price holding above the breakout level on closing basis, as this will be the primary sign of trend acceptance by the market.
On the other hand, if BPCL fails to break and hold above the resistance zone, the stock may slip back into its previous consolidation range. In such a case, sideways or corrective movement cannot be ruled out, and premature long positions may face drawdowns. A deeper rejection from resistance would indicate that buyers are not yet in control.
Risk management remains crucial in this setup. Since the breakout is not yet confirmed, any long exposure should be planned only after clear confirmation, with a strict stop loss below the invalidation zone. This approach helps protect capital while allowing participation in the upside if the breakout sustains.
Overall, BPCL is at a decisive technical juncture. The chart structure favors a bullish bias in the medium to long term, but confirmation is key. Traders and investors should remain patient, track price behavior around the breakout zone, and act only when the market clearly validates the move.

Angel One on the Edge: Long-Term Chart Points to 4800+The monthly chart of Angel One shows a well-defined broadening wedge pattern, where price has been repeatedly oscillating between a rising support line and a widening resistance zone. The structure has been forming for almost two years, indicating a long consolidation phase after a strong uptrend. Currently, the price is trading near the lower trendline support, which aligns with the long-term uptrend support. This zone is marked as the Buying Zone, suggesting that the risk-reward ratio is favourable for long-term buyers as long as the support remains intact.
A potential breakout above the upper wedge resistance may trigger a strong upside rally. The first major level on the upside is the Reversal Target around 3050, which is the initial confirmation level. If price sustains above this, the momentum may carry it towards the Breakout Target near 3500, which represents the first official breakout swing. Once this level is surpassed, the trend may accelerate towards Target 2 around 3900, indicating continuation of the long-term bullish structure. The complete projected move from the pattern height signals a Final Projected Target around 4840, which is the long-term positional upside expectation.
On the downside, the setup remains valid only while the price trades above the lower trendline region. A sustained close below the marked failure level would invalidate the pattern, signalling potential weakness and a breakdown of the long-term bullish structure. However, until that failure zone is breached, the pattern continues to favour a bullish breakout scenario with upward projections as highlighted.

Sharda crop - Buy - Technical Analysis#Sharda Cropchem Ltd - Technical Analysis
Current Price: 908.30
#Key Observations
Bullish Structure:
- Price broke above the descending trendline (RSI HD pattern)
- Successfully formed Higher Low at ~ 855, confirming uptrend continuation
- Currently in "Price Action" zone after Higher High at 1,181
Critical Levels:
- Support: 855-895 (recent Higher Low zone)
- Resistance: 965 (0.9 Fib), 1,018 (0.618 Fib), 1,181 (recent high)
- Key Breakout: Above 1,018 could target 1,106-1,181 range
Technical Indicators:
- RSI in neutral zone showing momentum building
- Price action suggests consolidation before next move
- Previous resistance zone (blue box) now acting as support
The chart shows a bullish reversal pattern with higher lows forming. A sustained move above 965-1,018 zone could signal continuation toward the 1,181-1,300 levels. Watch for volume confirmation on breakouts.
DISCLAIMER: This is for educational purposes only and not investment advice. Trading in stocks involves substantial risk of loss. Always do your own research and consult with a certified financial advisor before making investment decisions. Past performance is not indicative of future results.

BIL - Buy - ATH Breakout#Bhartiya International Limited - Technical Analysis Report
Current Price: 879.85
Market Overview
Bhartiya International is displaying strong bullish momentum after successfully retesting its 2017 high breakout level. The stock is currently sustaining above recent highs, indicating robust buyer interest and potential for further upside.
Technical Setup
Swing Trade Configuration:
- Entry Zone: Current levels around 880
- Stop Loss: 851.50 (below recent consolidation)
- Risk-Reward: Favorable with multiple upside targets
Price Targets:
- Near-term: 961 / 1018 / 1099 / 1253
- Long-term: 1330 / 1720
Key Technical Observations
1. **2017 High Breakout Retest:** The stock has successfully broken out and retested the 2017 high resistance, which has now converted into support. This is a classic bullish pattern indicating strength.
2. **50-period EMA Support:** Price is sustaining above the 50 EMA, confirming the uptrend remains intact.
3. **Hidden Divergence:** The chart shows hidden divergence on lower timeframes, typically indicating trend continuation - a bullish signal for swing traders.
4. **Higher Highs Formation:** The stock is consistently making higher highs, demonstrating strong momentum and buyer dominance.
Trading Strategy
The setup favors swing traders looking for medium-term gains. The retracement and previous all-time high methodology suggests a structured approach to profit booking at each target level while maintaining a trailing stop loss.
Targets based on Fibonacci retracement, previous retracement patterns, and historical ATH analysis.
**Disclaimer:** This analysis is for educational purposes only. Please conduct your own research and consult with a financial advisor before making investment decisions. Past performance does not guarantee future results.

Strong PSU Bank - Indian Bank - Strong BuyIndian Bank - Swing to Short-Term Investment Report
Current Price: 653.10
TECHNICAL SETUP OVERVIEW
Analysis Type: Monthly Chart | Investment Horizon: Short to Medium Term (6-18 months)
Key Observation: After a historic breakout from multi-year resistance, Indian Bank has established itself as a solid structure for accumulation with exceptional return potential.
BREAKOUT TIMELINE & PATTERN
Historical Resistance Battle (2018): Successfully tested 5 consecutive months.
Major Breakout (January 2024) Clean breakout above 2018 resistance level, Significance 6-year base breakout - high probability setup - Follow-through Strong momentum confirmed.
Bull flag Pattern formation, Price Range: 632-736. Building energy for next leg up
Structural Advantages:
1. Clean Breakout Pattern
- No false breaks or whipsaws
- Volume confirms genuine buying
2. Multiple Timeframe Confluence
- Monthly, weekly, daily all aligned bullish
- No conflicting signals
- High probability continuation
3. Measured Move Projections
- Targets based on historical patterns
- Flag pole height projects to 1,050+
- Conservative targets: 813-973
4. Fundamental Support
- PSU bank re-rating theme intact
- Improving asset quality
- Growing dividends (35% YoY growth)
- Strong Q4 profit growth (+31.56%)
Disclaimer: For educational purposes only. Manage risk appropriately and do your own research.
🎯 Trade Smart. Trade Safe. Accumulate Quality.

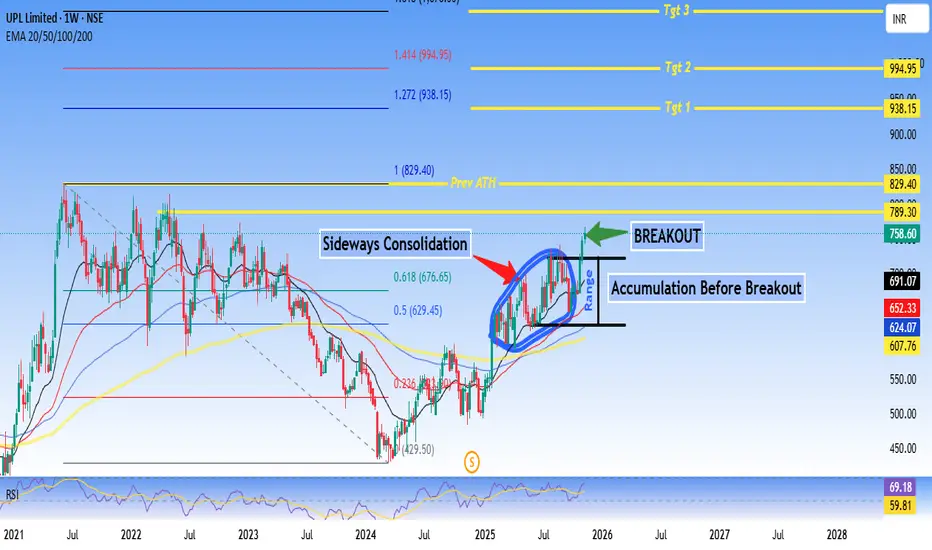
UPL Limited approaching Prev ATH - Technical AnalysisUPL Limited - #Breakout Setup After #Accumulation Phase
Current Price: 691.07
Good For Swing to Short-term Trading.
Technical Summary:
UPL is showing a classic accumulation-to-breakout pattern after an extended sideways #consolidation phase. The stock has broken out from a well-defined range with strong volume confirmation and is now positioned for potential upside momentum.
Key Technical Highlights:
✅ Breakout Confirmed: Price breaking above 768 resistance zone with volume expansion
✅ Accumulation Phase Complete: Extended consolidation (2024-2025) suggesting smart money accumulation
✅ EMA Alignment: 20/50/100/200 EMAs converging and starting to fan out bullishly
✅ RSI Strength: At 69.18, showing momentum without being overbought
✅ Fibonacci Levels: Currently between 0.236-0.5 retracement, plenty of upside room
Price Targets:
- Target 1: 938.15 (+35% from current levels)
- Target 2: 994.95 (+44%)
- Target 3: 1,050+ (Extended target)
Support Levels:
- Immediate: 676 (0.618 Fib)
- Strong: 629 (0.5 Fib + breakout level)
- Critical: 607 (20 EMA)
Risk-Reward: Favorable at current levels with defined support zones and multiple upside targets.
Disclaimer:
This analysis is for educational and informational purposes only and should NOT be considered as financial advice or a recommendation to buy/sell any security.
- Technical analysis is based on historical price patterns and may not predict future performance - Past performance is not indicative of future results - Trading and investing involve substantial risk of loss - Always conduct your own research and due diligence - The author may or may not hold positions in the discussed security - Price targets are projections based on technical levels and not guaranteed outcomes - Market conditions can change rapidly, invalidating technical setups - Use appropriate position sizing and risk management strategies
** Trade at your own risk. You are solely responsible for your trading/investment decisions.**
#UPL #TechnicalAnalysis #Breakout #Accumulation #StockMarket #NSE #SwingTrading #ChemicalSector #FibonacciRetracement #RSI
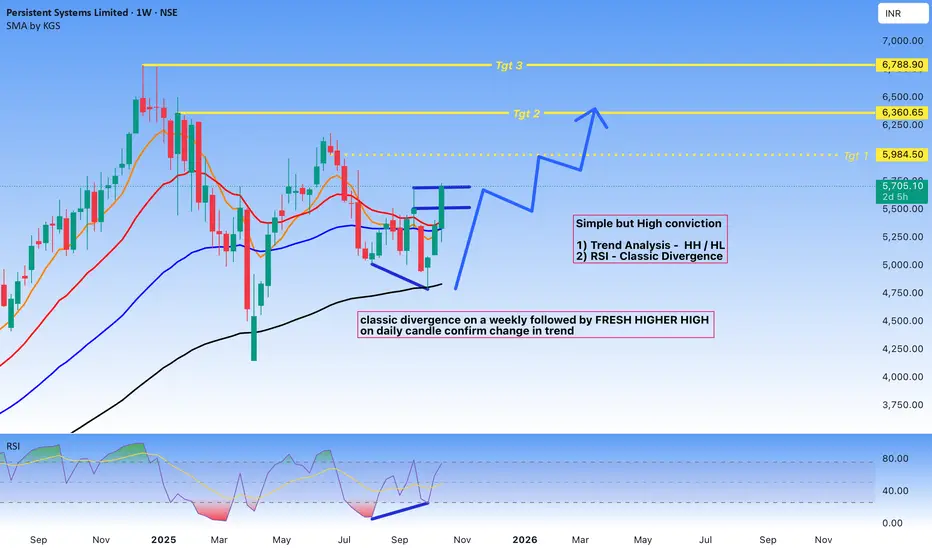
Persistent Technical Analysis#Persistent Systems Limited - Technical Analysis
Chart Overview
**Timeframe:** Weekly (1W)
**Current Price:** 5,708.20
Technical Setup
Trend Analysis
The chart displays a compelling technical setup based on higher highs and higher lows pattern analysis. After a significant correction from previous highs, the stock has formed a strong base and is showing signs of trend reversal.
Key Observations
RSI Classic Divergence
The Relative Strength Index is displaying a classic bullish divergence pattern. While price action formed lower lows during the correction phase, the RSI formed higher lows, indicating weakening bearish momentum and potential trend reversal. This divergence has been confirmed on the weekly timeframe, adding significant weight to the bullish case.
Fresh Higher High Confirmation:
Following the divergence, price action has broken above the previous swing high on the daily candle, confirming a potential change in trend structure. This break represents a shift from the previous pattern of lower highs and suggests renewed bullish momentum.
Price Targets
The analysis identifies three potential target zones:
- **Target 1:** 5,984.50 (Immediate resistance)
- **Target 2:** 6,360.65 (Medium-term target)
- **Target 3:** 6,788.90 (Extended target)
These targets are derived from previous resistance levels and Fibonacci extension analysis.
Moving Averages:
The chart shows multiple moving averages (likely 50 SMA and 200 SMA based on the red and orange lines). Price is currently attempting to reclaim these key moving averages, which would further validate the bullish thesis.
Risk Considerations
While the technical setup appears favorable, traders should consider:
- Confirmation on higher timeframes for reduced false signal risk
- Volume analysis to validate the breakout
- Proper risk management with stop-loss placement below recent swing lows
## Disclaimer
This is a technical analysis for educational purposes only and should not be considered as financial advice. Always conduct your own research and consult with a qualified financial advisor before making investment decisions. Past performance does not guarantee future results.
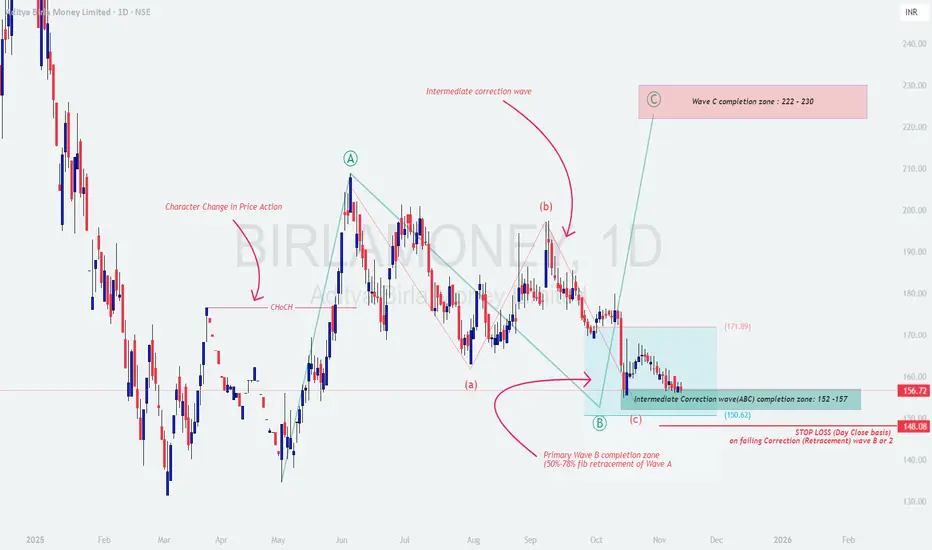
BIRLAMONEY – Wave C Rally Loading?🧠 Chart Context & Wave Structure
The chart displays a classic Elliott Wave corrective setup after a strong impulsive rally (Wave A).
Following the impulsive move, price entered a multi-stage correction, forming a clear (a-b-c) structure within Wave B.
Key Observations:
📈 Character Change in Price Action (ChoCH) signaled the initial shift from bearish to bullish structure.
Wave A marked a strong impulsive leg confirming bullish sentiment.
The ongoing Wave B correction is now nearing completion within the 50%-78% Fibonacci retracement zone of Wave A.
The Intermediate correction (ABC) seems to be completing between ₹152 – ₹157, aligning with strong confluence support.
📚 Educational Insights
1️⃣ Character Change in Price Action (ChoCH):
Marks the structural shift from lower highs/lows to higher highs/lows — the first clue of trend reversal.
2️⃣ Fibonacci Retracement Principle:
Most corrective waves retrace 50%–78.6% of the prior impulsive leg.
This “Golden Pocket” zone often acts as a high-probability reversal area where smart money accumulates.
3️⃣ Wave Structure Psychology:
Wave A: Impulsive rally driven by renewed optimism.
Wave B: Corrective pullback – often mistaken as a bearish reversal.
Wave C: Next impulsive leg resuming the primary uptrend; often equals or exceeds Wave A in magnitude.
🎯 Price Projection & Prediction
Wave B completion zone: ₹152 – ₹157 ✅
Wave C potential target zone: ₹222 – ₹230 🎯
Invalidation / Stop-Loss zone: Below ₹148 (Closing basis) 🚫
If price sustains above ₹157 and breaks ₹171.89, it strengthens the bullish probability for Wave C extension.
💡 Trading Strategy (Educational Purpose Only)
1️⃣ Entry Plan:
Watch for bullish reversal patterns (Hammer, Bullish Engulfing, or Double Bottom) near ₹152–₹157.
Aggressive Entry: Partial accumulation in this zone.
Conservative Entry: Wait for breakout confirmation above ₹165–₹171.89 zone.
2️⃣ Targets:
🎯 Target 1: ₹190 (Intermediate resistance)
🎯 Target 2: ₹222 – ₹230 (Wave C completion zone)
3️⃣ Stop-Loss:
Keep Closing basis SL below ₹148, as a break below it invalidates the current corrective completion structure.
⚖️ Risk Management Tips
Risk only 1–2% of your total trading capital per trade.
Avoid aggressive averaging during corrections.
For options traders — enter directional positions only after structure confirmation.
Combine structure + volume confirmation for high-probability setups.
Remember: Elliott Waves show probability, not certainty.
🧩 Summary & Conclusion
Aditya Birla Money appears to be completing its intermediate corrective Wave (ABC) within the ₹152–₹157 zone — a strong support confluence area.
If the structure holds, a potential impulsive Wave C rally could unfold toward ₹222–₹230 in the coming weeks.
Patience and confirmation will be key before entering this potential move.
⚠️ Disclaimer
I am not a SEBI-registered analyst.
This analysis is purely for educational and informational purposes only and should not be taken as investment advice.
Please consult your financial advisor before making any trading decisions.
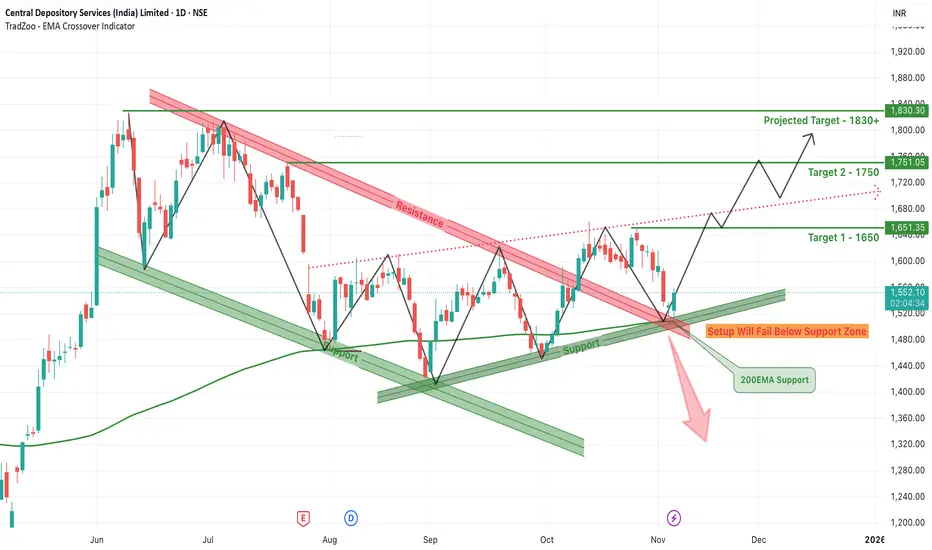
CDSL Breakout from Falling Wedge – Can It Rally to 1830+?CDSL has recently broken out from a classic falling wedge pattern, a bullish technical setup that often signals a trend reversal or continuation of the broader uptrend. After months of being compressed between a descending resistance and a well-established support line, the stock has now pierced through the upper resistance zone with notable bullish momentum.
The wedge had formed over several months, creating lower highs and relatively equal or slightly rising lows. The pattern was further supported by a confluence with the 200 EMA, which acted as a critical dynamic support near the breakout zone. This alignment of technical indicators added strength to the breakout confirmation seen recently.
With this breakout, CDSL has now opened doors for higher targets. The immediate Target 1 is set at ₹1650, which also aligns with a recent horizontal resistance zone. Once this is breached, the next move could extend toward Target 2 at ₹1750, a level where previous price action has shown hesitation. If momentum continues to build and the broader market supports the move, the final projected target of ₹1830+ becomes achievable in the short to medium term.
However, it’s crucial to note that the support zone below ₹1480 is acting as a critical invalidation point for this bullish setup. Any strong breakdown below this zone, especially with volume, would fail the bullish structure and may push the stock back into consolidation or a deeper correction. Traders must also watch the red dotted trendline, which represents a former resistance turned possible retest zone.
Overall, the technical landscape is now favoring the bulls, especially after the breakout confirmation and support from the 200 EMA. Traders and investors should monitor price action near the projected levels and manage risk accordingly, while riding the momentum above the wedge resistance.
Torrent Power - Short Term Investment IdeasTorrent Power Limited - Technical Analysis Report
Current Market Price: 1,328.40
Opportunity: The Stock is Trading at 40% discount to intrinsic value, presenting a potential value investment in the #Integrated #powersector.
Technical Setup: Stock testing critical 20 #EMA support on monthly timeframe after forming #HiddenDivergence #pattern. Recent decline suggests caution but oversold conditions emerging.
Technical Snapshot
Trend: Monthly chart shows trend continuation pattern with classic divergence forming between February and October 2025 lows. Currently attempting support at 20 EMA (1,329).
RSI: Monthly RSI at 33.26 (oversold territory) with RSI 3 breakout indicating significant selling pressure but potential bounce setup.
Support Levels: 1328, 1200, 1055
Resistance Levels: 1539, 1743 (recent high)
Business Overview (Fundamentals)
Torrent Power operates across three segments: thermal power generation and LNG trading, transmission and distribution (largest revenue contributor), and renewable energy through wind and solar projects.
Trading Strategy
Aggressive Buyers: Accumulate at current levels with stop loss below 1,280. Risk-reward favorable given 40% discount.
Conservative Buyers: Wait for weekly close above 1,350 confirming support hold before entry.
Target:1,539 (short-term), 1,743+ (medium-term)

AdityaBirlaCapital - Investment IdeasAditya Birla Capital Ltd - Technical Analysis
Simple Technical Analysis Summary
Aditya Birla Capital is breaking out from a multi-year resistance zone with a classic and perfect rounding bottom pattern playing out on the monthly timeframe.
Fibonacci targets have been activated!
Key Technical Observations
1. Multi-Year Rounding Bottom Pattern
The stock has completed a textbook rounding bottom formation spanning multiple years. This is one of the most reliable bullish reversal patterns in technical analysis, indicating a fundamental shift from bearish to bullish sentiment.
2. Breakout from Multi-Year Resistance
After years of consolidation and base building, the stock has successfully broken out from a significant resistance zone around ₹255. This breakout signals the potential beginning of a new uptrend cycle.
3. Monthly Timeframe Confirmation
The pattern is forming and confirming on the monthly timeframe, which carries significantly more weight than shorter timeframes. Monthly breakouts tend to lead to sustained moves.
4. Fibonacci Extension Framework
Multiple Fibonacci extension levels have been identified and activated, providing a clear roadmap for potential price targets based on the measured move from the rounding bottom pattern.
#Fibonacci Extension Target Levels
Based on the rounding bottom pattern measurement and Fibonacci extensions:
- Target 1: 314.20 (1.272 Fibonacci Extension)
- Target 2: 345.10 (1.414 Fibonacci Extension)
- Target 3: 389.90 (1.618 Fibonacci Extension)
- Extended Target: 472.00 (2.0 Fibonacci Extension)
Key Support Levels
- Immediate Support: 255.00 (Breakout level / Previous resistance turned support)
- Secondary Support: 171.86 (0.618 Fibonacci retracement)
- Critical Support: 146.17 (0.5 Fibonacci retracement)
- Base Support: 42.35 (Rounding bottom base)
- Pattern suggests long-term bullish structure - Risk-reward favorable for position building on dips
Risk Management:
- Maintain stoploss below 255 on monthly closing basis
- For aggressive traders: 240 (allowing some wiggle room)
- For conservative traders: 235 (below breakout zone)
Invalidation Level:
- Monthly close below 240 would weaken the bullish structure
- Break below 220 would invalidate the immediate bullish setup
DISCLOSURE & RISK WARNING:
This analysis is provided for educational and informational purposes only and should not be construed as financial advice, investment recommendation, or an offer to buy or sell securities. Past performance is not indicative of future results.

#Cipla - #ShortTerm #Inveatment IdeaCipla Ltd - Technical Analysis
Current Price: 1,639.10
Timeframe: Monthly Chart Analysis
This analysis utilizes:
- Monthly and Weekly timeframe analysis
- Fibonacci extension and retracement levels
- Support/resistance identification
- RSI momentum analysis
- Price action patterns
Technical Structure Overview
1. Monthly Consolidation Phase
After making a higher high, Cipla is currently in a consolidation phase on the monthly chart, forming a strong base. This consolidation suggests preparation for a potential significant move higher.
2. Breakout Level to Watch
The critical level to monitor for breakout confirmation is around the recent high zone. A decisive break above this level could trigger the next leg of the uptrend.
3. Weekly Timeframe Confirmation
For higher probability setups, confirmation should be sought on the weekly timeframe before taking any positions. This multi-timeframe approach reduces false signals.
4. Fibonacci Extension Targets
Based on Fibonacci patterns, the following extension levels have been identified as potential targets for future price movement.
5. Risk Management Strategy
Following a risk-reward approach is essential for this setup given the consolidation phase and potential for significant moves in either direction.
Fibonacci Extension Target Levels
Based on technical projections:
- Target 1: 1,872.70 (1.272 Extension at 1,878.05)
- Target 2: 1,986.95 (1.414 Extension at 1,987.15)
- Target 3: 2,145.45 (1.618 Extension at 2,143.95)
Key Support Levels
Primary Support: 1,345.75 (0.5 Fibonacci level)
Critical Support: 900.50 (0 level - invalidation zone)
Trading Considerations
Bullish Scenario:
- Wait for monthly candle close above consolidation range
- Confirm momentum on weekly timeframe
- Enter on weekly pullback for optimal risk-reward
Invalidation:
- Break and close below ₹1,345.75 would weaken the bullish structure
- RSI showing divergence patterns to monitor
DISCLOSURE & RISK WARNING:
This analysis is provided for educational and informational purposes only and should not be construed as financial advice, investment recommendation, or an offer to buy or sell securities. Past performance is not indicative of future results.

Hindpetro Long - Investment IdeaHindustan Petroleum (HINDPETRO) - Monthly Chart Analysis
Current Price: 441.75
Major #Breakout in Progress
**Timeframe:** Monthly (Long-term View)
Key Technical Event:
🚀 Historic Breakout - Stock has broken above 2017 all-time high after 8 years of consolidation
- Breakout Level: 325.55
- Retest Zone: 410-420 - Currently retesting breakout
Hindpetro is Brewing for fresh new highs above ₹441
Target Projections based on #Patterns and #Fibonocci levels.
Interim Targets:
- Support holding at ₹416
- Immediate resistance: ₹480-500 zone
Short Term Targets:
- Tgt 1: 530
- Tgt 2: 657
Extended Targets: 593-629
Technical Significance:
- **8-year base breakout** = High probability of sustained uptrend
- Monthly trend reversal confirmed
- Trading well above long-term moving average
- Volume-supported breakout suggests institutional accumulation
Risk Management:
- Stop Loss: Below 410 on monthly closing basis
- Key Support: 325 (previous resistance now support)
Outlook:
After breaking a major multi-year resistance, HINDPETRO is consolidating gains and positioning for the next leg up. Patient accumulation recommended on dips toward ₹410-420.
This is for educational purposes only.* Do your Own analysis before taking Trade.

#MuhuratPick | #Kalamandir: Inverse Head & Shoulders in Play✨ #MuhuratPick 🪔
Celebrate this Diwali with a stock that could bring you festive returns!
CMP: 175
🔽 Supports: 163 - 164 / 152
🔼 Resistances: 193 - 202 / 241
❌ Invalidation Level: 149.50 (Weekly Close Below)
✴️ Breakout Point: Weekly close above the neckline (Pink dotted line)
🎯 Pattern Target: 290+ (+66% from CMP)
📈 All-Time High: 312
🚀 Can Go Big in the Long-Term
#InverseHeadAndShoulders | #ChartPatterns | #DiwaliPick | #Investing | #MuhuratTrading | #LongTerm | #PriceAction
📌 Disclaimer: This analysis is shared for educational purposes only. It is not a buy/sell recommendation. Please do your own research before making any trading decisions.

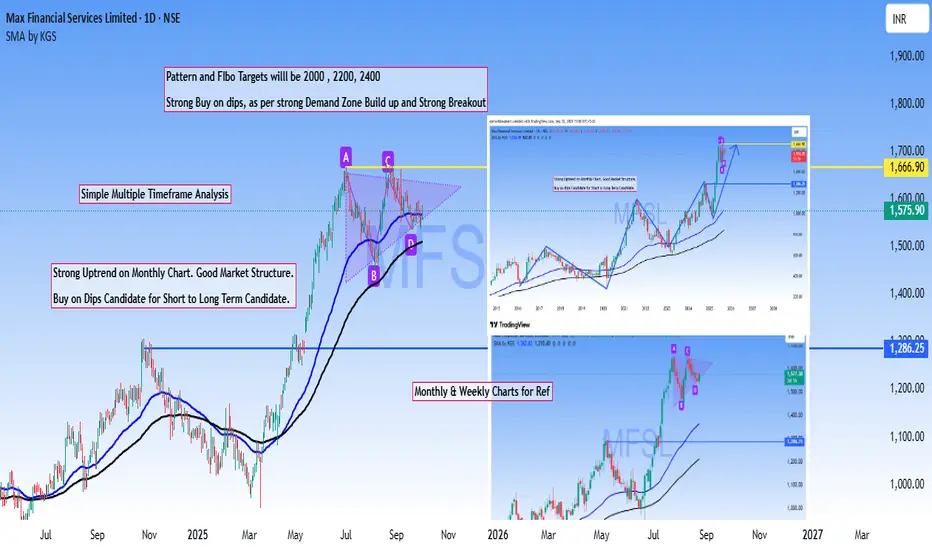
MFSL Multi time frame AnalysisMulti-timeframe confluence analysis offers traders a robust edge through straightforward yet highly effective methodology.
Based on that MFSL is a strong Buy on dips stock based on powerful breakout of previous ATH and the current market structure.
Targets are derived from #Pattern #breakout and #Fibonacci levels.
Bullish Pennant in formation.
Disclaimer: Above analysis shared for educational purpose only.
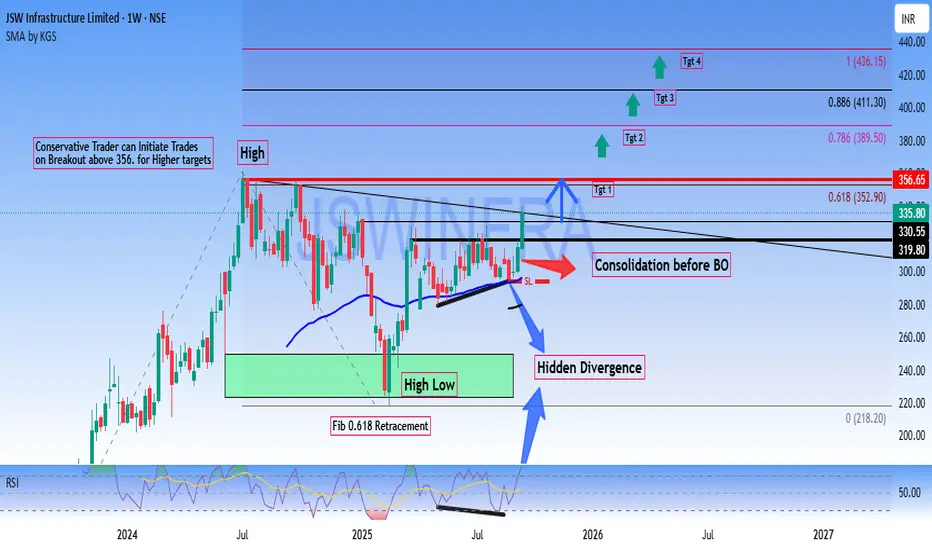
Long JSWINFRA - Short term Investment# JSW Infrastructure Limited (NSE) - Technical Analysis Report
Current Price: 335.80
Key Technical Observations
**Bullish Breakout Setup**
- Breakout Level: Above 356 for conservative trade
Consolidation phase completing before potential breakout (BO) & Stock trading near resistance zone.
Price Targets
- Target 1: 352.90 (0.618 Fibonacci level)
- Target 2: 389.50 (0.786 Fibonacci level)
- Target 3: 411.30 (0.886 Fibonacci level)
- Target 4: 436.15 (1.0 Fibonacci extension)
- Moving Average: SMA showing upward momentum at 296.13
- Fibonacci Retracement : 61.8% level acting as immediate resistance
Chart Pattern Analysis
- Hidden Divergence on the chart suggesting underlying strength
- Consolidation Phase after pullback from 0.618 fib levels and Recent sideways movement indicating accumulation
Risk Management
- Support Level of the recent consolidation low around 280-300 zone
- Stop Loss: Conservative traders should consider stops below 320 on candle close basis.
Conservative Traders:
- Wait for decisive breakout above ₹356 with volume confirmation
- Enter on pullback to ₹340-345 range after breakout
- Target progressive profit booking at mentioned Fibonacci levels
Disclaimer: This analysis is for educational purposes only. Please conduct your own research and risk management before making investment decisions.
Invest With My NeoWave ChartsNamaskaram Everyone
This is an educational post in which i will describe how to read and trade with my wave Charts.
So first lets start by seeing a wave Chart.
First you will be seeing a S1 series called Short Term Trend.
Than a group of S1 is denoted by M1 series called Medium Term Trend.
Than a group of M series is marked by L series called Long term trend.
All this means is that smaller trend makes a bigger trend and than more bigger trend and than more.
This is how a wave structure become.
All these Short, medium and long term trend are called Degree.
You can think of them as a car gear like bigger the gear greater the speed of price and consolidation.
In my charts i used total 10 gears but i am showing you 9 degree.
See the below 3 images.
Degree List 1
Degree List 2
Degree List 3
Now there are few more things left-
Like you will be seeing some coding with C keyword like MC1,LC1, and a,AA,BB.
These are consolidation or correction counting.
Mean after a rally market rest or consolidate before resume another rally. We represent these consolidation period with LC1,AA,BB Like this.
Now see some examples by which you can judge how much time and price a particular degree or gear can consume-
Multiyear Trend
This is an Bank Nifty chart, if you see that multiyear cycle is running for past 25 years.
Each leg cover around 10 years.
Super Trend
Complete Cycle take 8 year, from 2012 to 2020
just imagine if you can think of an possibility in advance that next 8 years are going to bullish or bearish.
Namaskaram
VodafoneIDEA (Opportunity during consolidation)Hi everyone
Welcome to intelligent investor, we provide market insights by synchronising and combining all the price action waves from different time frames and gives you single trend.
Degree Information

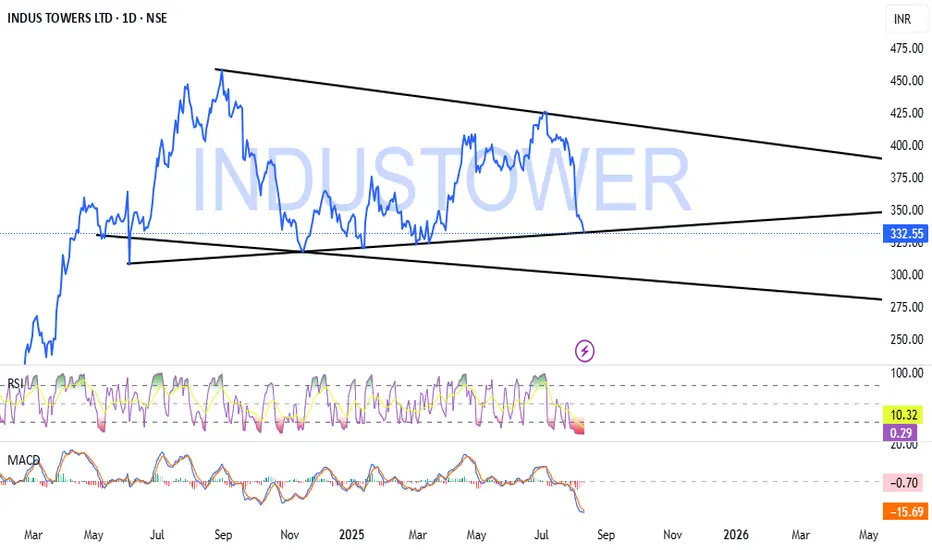
IndusTower Long - Forming Pattern & Entering into consolidationIndusTower - After the decent Breakout Forming Pattern & Entering into consolidation. Its Best buy at Bottom with Stoploss.
Righttime to enter before Breakout.
Do your own analysis before Entering into any trade. NSE:INDUSTOWER
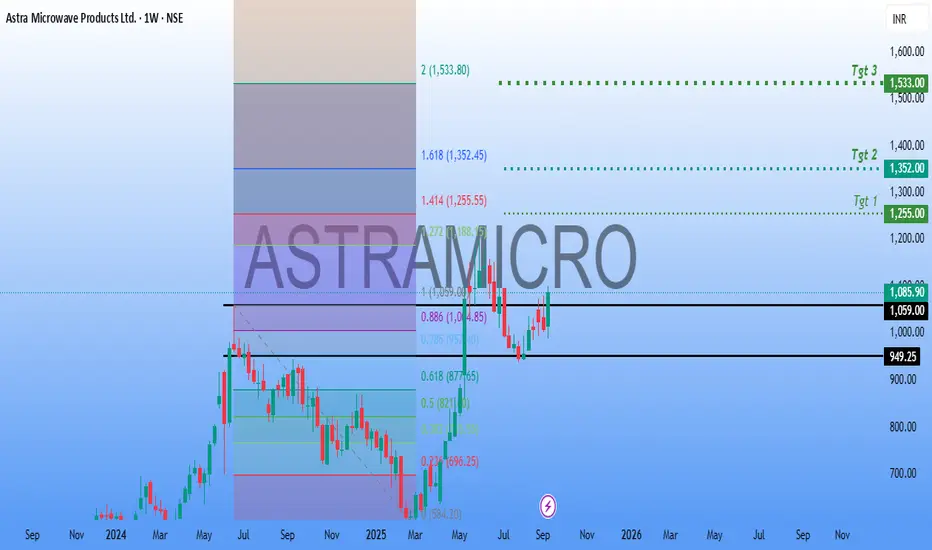
ASTRAMICROAnother #Defense #Stock in focus.
#ASTRAMICRO has a strong Technical Structure. Made a neat #breakout and consolidating at the Breakout levels.
Neat #Buyondips stock for #Short to #Longterm #Investment.
Targets in Chart.
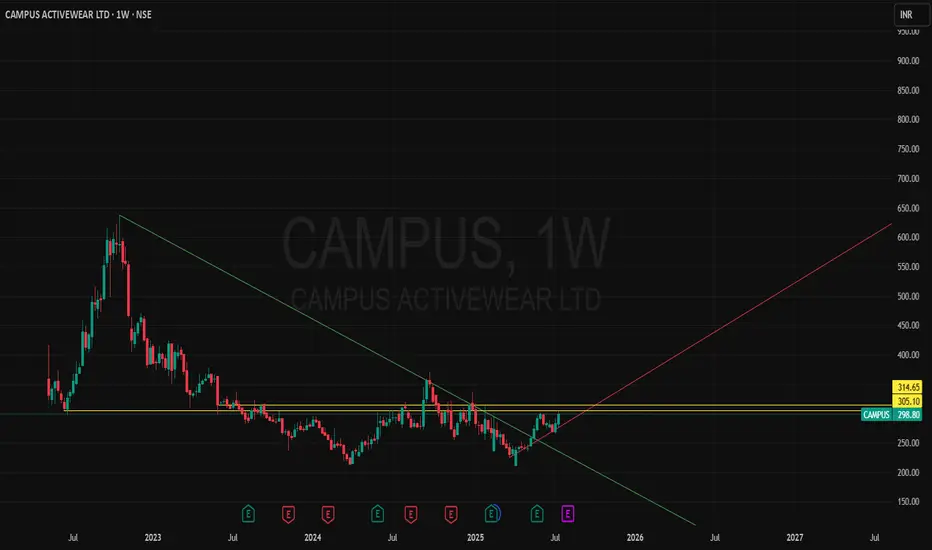
"#MoveWithSwag"CAMPUS – Breakout Watch | Long-Term Chart Setup
CAMPUS Activewear has broken out from a multi-month descending trendline on both weekly and monthly charts, showing strong momentum with volume support.
Price has reclaimed key support zones after long accumulation.
RSI regaining strength and sustaining above mid-levels.
Positive structure forming across major timeframes with higher lows.
Good risk-reward setup for investors with long-term view.
🎯 Ideal for positional traders & long-term investors with a medium-term view.
📝 Note: Please do your own due diligence. This is not a recommendation, just a view based on charts and fundamentals.
🧠 Disclaimer: For educational and research purposes only. No buy/sell advice.
📝 Chart Purpose & Disclaimer:
This chart is shared purely for educational and personal tracking purposes. I use this space to record my views and improve decision-making over time.
Investment Style:
All stocks posted are for long-term investment or minimum positional trades only. No intraday or speculative trades are intended.
⚠️ Disclaimer:
I am not a SEBI registered advisor. These are not buy/sell recommendations. Please consult a qualified financial advisor before taking any investment decision. I do not take responsibility for any profit or loss incurred based on this content.