Is this a Top in US500 Bearish Divergence + Rising WedgeThe US500 is forming higher highs in price, while the RSI is showing a clear bearish divergence, failing to confirm the move and indicating weakening momentum. Additionally, the price action is developing a rising wedge pattern, which typically signals exhaustion. A decisive close below the lows of the past two sessions could confirm a short-term top, especially amid ongoing negative geopolitical developments.
S&P 500 Index
No trades
Market insights

SMC Breakdown – US500 (15M)Price delivered a strong sell-side liquidity sweep, followed by an impulsive bullish displacement, confirming short-term bullish intent. Post-displacement, market respected structure and began forming higher highs and higher lows, indicating internal BOS to the upside.
Current price is reacting into a premium supply zone / HTF imbalance, aligning with prior distribution. This area is marked as a high-probability reaction zone, not an immediate entry.

Part 11 Trading Master Class With Experts What Are Options?
Options are derivative contracts, meaning their value is derived from an underlying asset such as:
Stocks
Index (Nifty, Bank Nifty)
Commodities (Gold, Crude)
Currency pairs
ETFs
An option gives the buyer the right, but not the obligation, to buy or sell the underlying asset at a fixed price within a specific period.
There are two main types of options:
1. Call Option
A Call Option gives you the right to buy the underlying asset at a fixed price.
2. Put Option
A Put Option gives you the right to sell the underlying asset at a fixed price.
That “fixed price” is called the strike price, and the last day on which you can exercise the option is called the expiry date.

SPY - Hope it tops this time :)US markets have been super resilient, sucking capital from across the world.
We have a good pattern in place, as the triggers for pushing the market up have been reducing with time, with everything running quite thin.
The rally has been quite low on breadth and is supported on weak pillars - but still has been resilient and all selling have been bought into.
Let's see if it breaks and sustains this time.
We need a 10-15% (ideally + 20%) fall in US for money to flow into emerging markets :)
It is a good time to try some positional shorts with SL as 7k.
View void if we sustain above 7k.

Part 6 Learn Institutional Trading Key Terminologies in Options Trading
Before diving into strategies and mechanics, it’s crucial to understand some foundational terms:
Underlying Asset: The security on which the option is based (e.g., stocks, indices, commodities, currencies).
Strike Price (Exercise Price): The price at which the option holder can buy or sell the underlying asset.
Expiration Date (Maturity): The date on which the option contract expires.
Premium: The cost of purchasing the option, influenced by intrinsic and extrinsic factors.
Intrinsic Value: The real, immediate value of the option if exercised now.
Time Value: The portion of the premium representing the potential for the option to gain value before expiration.
In-the-Money (ITM): A call option is ITM if the underlying price is above the strike price; a put is ITM if the underlying is below the strike price.
Out-of-the-Money (OTM): A call is OTM if the underlying price is below the strike price; a put is OTM if above.
At-the-Money (ATM): When the strike price is roughly equal to the current price of the underlying asset.

Unlock Market Rotation: Turn Shifting Trends into Powerful ProfiStay Ahead of Capital Flow & Capture the Next Big Opportunity
What Is Market Rotation?
Market rotation refers to the movement of capital from one sector, asset class, or investment theme to another as economic conditions, interest rates, inflation, and growth expectations change. Understanding this shift allows investors to align portfolios with where money is flowing next, not where it has already been.
Why Market Rotation Matters More Than Ever
In today’s fast-moving global markets, leadership changes quickly. Sectors that outperform in one phase of the cycle can underperform in the next. Investors who unlock market rotation gain a powerful edge by identifying early signals and positioning before the crowd reacts.
Economic Cycles Drive Rotation
Different sectors perform best at different stages of the economic cycle. Early recovery favors cyclicals, mid-cycle supports growth sectors, late-cycle shifts toward defensives, and slowdown phases reward capital preservation strategies. Market rotation is the bridge between macro trends and smart allocation.
Interest Rates as a Key Trigger
Rising interest rates often rotate money away from high-growth, high-valuation stocks toward value, financials, and commodities. Falling rates usually support technology, consumption, and growth-oriented sectors. Tracking rate expectations is critical to anticipating rotation.
Inflation and Sector Leadership
Inflation reshapes winners and losers. High inflation typically benefits energy, metals, and real assets, while compressing margins in rate-sensitive sectors. Unlocking rotation means understanding how inflation impacts pricing power across industries.
Institutional Money Leaves Clues
FIIs, DIIs, and large institutional players move capital systematically. Volume expansion, relative strength, and sectoral index breakouts often signal early institutional rotation. Smart investors learn to read these footprints rather than react to headlines.
Relative Strength Is the Core Tool
Market rotation is best identified through relative performance. Comparing sectors against benchmark indices reveals which areas are gaining strength and which are losing momentum. Sustained outperformance is a strong sign of rotation in progress.
From Sector to Stock-Level Rotation
Rotation doesn’t stop at sectors—it flows into sub-sectors and then into specific stocks. Leaders within a strong sector usually outperform peers. Unlocking market rotation means narrowing focus from macro to micro with precision.
Risk Management Through Rotation
Instead of exiting markets entirely, rotation allows investors to shift risk, not abandon opportunity. When one theme weakens, another strengthens. This approach smooths volatility and improves long-term consistency.
Psychology of Market Rotation
Most investors chase past performance. Market rotation rewards those who act before trends become obvious. Discipline, data-driven decisions, and patience are essential to avoid emotional investing.
Technical Indicators That Signal Rotation
Moving averages, sectoral relative strength lines, momentum oscillators, and trend confirmation tools help validate rotation. Technical confirmation ensures that allocation decisions are backed by price action, not assumptions.
Macro Events Accelerate Rotation
Central bank decisions, geopolitical shifts, policy reforms, and global growth changes can rapidly accelerate capital movement. Prepared investors use these events as catalysts rather than shocks.
Short-Term vs Long-Term Rotation
Rotation can be tactical (weeks to months) or strategic (quarters to years). Traders benefit from short-term sector momentum, while investors focus on structural shifts like digitization, energy transition, or infrastructure growth.
Equity, Debt, and Alternative Rotation
Rotation is not limited to equities. Capital also moves between stocks, bonds, commodities, and alternative assets. A holistic approach captures opportunities across asset classes.
Market Rotation in Indian Markets
In India, rotation often reflects domestic growth cycles, government policies, earnings visibility, and global capital flows. Understanding local drivers adds a significant advantage to portfolio positioning.
Avoiding Overcrowded Trades
When a sector becomes over-owned, upside potential reduces. Unlocking market rotation helps investors exit crowded themes early and enter emerging ones before valuations expand.
Consistency Beats Prediction
Market rotation is not about predicting tops or bottoms. It is about consistently reallocating capital toward strength and away from weakness based on objective signals.
Portfolio Rebalancing with Purpose
Regular rebalancing aligned with rotation trends keeps portfolios dynamic. This reduces drawdowns and improves risk-adjusted returns over time.
Long-Term Wealth Creation Advantage
Investors who master market rotation compound gains by riding multiple leadership cycles instead of staying stuck in one theme. This adaptability is key to sustainable wealth creation.
Unlock the Edge
Market rotation is the silent force behind every major rally and correction. Those who understand it move ahead of trends, protect capital during uncertainty, and capture opportunity when it matters most.
Unlock Market Rotation is not just a strategy—it’s a mindset. By tracking capital flow, aligning with economic cycles, and acting decisively, investors can transform uncertainty into opportunity and stay one step ahead of the market.

Part 7 Trading Master Class What Are Options?
Options are financial derivatives, meaning their value is derived from an underlying asset such as stocks, indices, commodities, or currencies.
An option is a contract that gives the buyer the right, but not the obligation, to buy or sell the underlying asset at a predefined price before or on a fixed date.
There are two types of options:
1. Call Option
Gives the right to buy.
A trader buys a call if they expect the price of the underlying asset to go up.
2. Put Option
Gives the right to sell.
A trader buys a put if they expect the price to go down.
Each option has:
Strike Price: The price at which buying/selling occurs.
Expiry Date: The last date the contract is valid.
Premium: The price paid to buy the option.

Risk Smart, Grow Fast: The Art of Intelligent Wealth CreationUnderstanding Risk the Right Way
Risk is often misunderstood as something to avoid. In reality, risk is unavoidable in any form of growth—whether in trading, investing, business, or personal development. The key difference between winners and losers is not the presence of risk, but how risk is managed. Smart risk-takers identify potential downsides before focusing on upside. They ask critical questions: What can go wrong? How much can I lose? Can I survive this loss? This mindset shifts risk from a threat into a calculated tool.
The Power of Risk Management
Risk management is the backbone of fast yet sustainable growth. Without it, even the best strategy eventually collapses. Smart risk management involves defining risk limits, position sizing, diversification, and exit rules. In trading and investing, this could mean risking only a small percentage of capital on each trade. In business, it might involve testing ideas on a small scale before full implementation. By controlling downside, you create the freedom to pursue opportunities aggressively without fear of ruin.
Why Smart Risk Accelerates Growth
Ironically, those who take controlled risks often grow faster than those who chase high rewards impulsively. This is because they stay in the game longer. Consistency compounds. A person who avoids catastrophic losses can benefit from compounding returns, learning cycles, and experience. Over time, small intelligent gains stack up, leading to exponential growth. Fast growth is rarely about one big win—it is about many smart decisions executed repeatedly.
The Role of Probability and Edge
Smart risk-takers think in probabilities, not certainties. They understand that no decision guarantees success. Instead, they focus on having an edge—a situation where the odds are slightly in their favor over many repetitions. In markets, this might be a tested strategy. In careers, it might be acquiring rare skills. Growth becomes fast when decisions are aligned with favorable probabilities and repeated consistently with discipline.
Emotional Control: The Hidden Advantage
One of the biggest threats to smart risk-taking is emotion. Fear leads to hesitation, while greed leads to overexposure. Emotional decisions distort risk perception and cause impulsive behavior. Those who grow fast learn to detach emotionally from outcomes and focus on processes. Losses are treated as feedback, not failure. This emotional resilience allows them to take the next opportunity confidently without being psychologically damaged by past setbacks.
Learning From Losses Without Being Destroyed by Them
Losses are inevitable when taking risks, but smart risk-takers design losses to be small and educational. Instead of asking “How do I avoid losses?”, they ask “How do I ensure losses don’t harm my long-term progress?” This shift is powerful. Each controlled loss becomes a tuition fee for experience. Over time, this learning curve accelerates growth far more than avoiding risk altogether.
Leverage: A Tool, Not a Shortcut
Leverage—whether financial, time-based, or skill-based—can accelerate growth dramatically, but it magnifies both gains and losses. Smart growth does not reject leverage; it respects it. Using leverage responsibly means ensuring that a single mistake cannot wipe out years of effort. Those who grow fast understand leverage deeply and apply it only when risk is well defined and controlled.
Diversification vs. Focus
Risk-smart growth balances diversification and focus. Diversification protects capital and reduces volatility, while focus allows for meaningful impact and higher returns. Intelligent growth strategies often start with diversification to survive and learn, then gradually increase focus as confidence, skill, and edge improve. This phased approach reduces risk while maintaining growth momentum.
Long-Term Vision With Short-Term Discipline
Growing fast does not mean thinking short term. In fact, the fastest sustainable growth often comes from a long-term vision supported by strict short-term discipline. Every decision is evaluated based on how it fits into the bigger picture. Short-term setbacks are accepted if they align with long-term goals. This clarity prevents impulsive risk-taking and keeps growth on track.
Risk Smart Is a Mindset, Not a Strategy
Ultimately, Risk Smart, Grow Fast is a mindset. It is about respecting uncertainty, preparing for downside, and acting decisively when opportunity arises. It requires humility to accept what you don’t know and confidence to act on what you do. This mindset applies beyond finance—to careers, entrepreneurship, relationships, and personal growth.
Conclusion
Fast growth is not achieved by avoiding risk or chasing reckless rewards. It is achieved by understanding risk, controlling it, and using it intentionally. When risks are smart, losses are survivable, learning accelerates, and compounding works in your favor. In a world full of noise and shortcuts, those who risk smartly stand out—not because they never fail, but because they never allow failure to stop them. That is the true formula to grow fast and grow strong.

S&P 500 — Mature but Structurally HealthyThe S&P 500 remains in a long-term impulsive uptrend at cycle degree.
Despite maturity, the structure shows no confirmed cycle-degree violation. Corrections continue to be corrective, not distributive.
This suggests the global equity cycle is aging — but not ending.
Invalidation: Only a confirmed breakdown below the primary rising structure would alter the yearly view.
📌 Cycles age before they end.
#SP500 #USMarkets #Equities #MarketStructure #CycleAnalysis #LongTermView

Part 8 Trading Master Class With Experts Factors Affecting Option Pricing
Option pricing is influenced by several factors, often modeled using the Black-Scholes formula or Binomial models:
1. Underlying Asset Price: Directly affects intrinsic value.
2. Strike Price: Determines the ITM, ATM, or OTM status.
3. Time to Expiry: More time increases extrinsic value due to uncertainty.
4. Volatility: Higher volatility increases the likelihood of significant price movements, raising premiums.
5. Interest Rates: Influence cost-of-carry in options.
6. Dividends: Expected dividends reduce call option value and increase put value for stock options.

Part 7 Trading Master Class With Experts How Options Work
Options provide leverage. For a fraction of the underlying asset's price, traders can control a large position. For example, buying 100 shares of a stock directly may cost $10,000, but buying a call option on those shares could cost $500, offering similar profit potential if the stock rises.
Profit Scenarios
Call Option Buyer: Gains when the underlying price rises above strike + premium paid.
Put Option Buyer: Gains when the underlying price falls below strike - premium paid.
Seller (Writer) of Options: Receives the premium upfront but assumes the risk of adverse price movement.

Trading Psychology: Your Offer vs Their Offer1. Understanding “Your Offer” in Trading
Your offer represents everything you bring into the market as a trader. It includes your capital, strategy, expectations, emotions, patience, discipline, and risk tolerance.
1.1 Expectations and Beliefs
Every trader enters the market with expectations—how much profit they want, how fast they want it, and how often they expect to win. Unrealistic expectations are one of the biggest psychological traps. When your expectations exceed market reality, frustration, revenge trading, and overtrading follow.
Markets do not owe traders consistency or profits. When your offer is based on entitlement rather than probability, emotional instability becomes inevitable.
1.2 Risk Appetite
Your offer also includes how much risk you are willing to accept. Many traders mentally underestimate risk while emotionally overreacting to losses. This mismatch leads to fear-based exits, stop-loss shifting, or position sizing errors.
A disciplined trader aligns risk with emotional tolerance, not just account size.
1.3 Discipline and Process
Discipline is the strongest component of your offer. It is your willingness to follow a system even when emotions push you otherwise. Without discipline, even the best strategy collapses under psychological pressure.
Your offer is strongest when it is process-driven rather than outcome-driven.
2. Understanding “Their Offer” – The Market’s Perspective
Their offer is the market’s response to your intentions. It is shaped by millions of participants, institutions, algorithms, news events, liquidity needs, and macro forces.
2.1 The Market Is Not Personal
One of the biggest psychological mistakes traders make is taking market moves personally. Losses feel like rejection, and wins feel like validation. In reality, the market is neutral—it simply facilitates transactions between buyers and sellers.
The market does not care about your stop-loss, entry price, or emotions.
2.2 Institutional Dominance
Large institutions, banks, and funds dominate liquidity. Their offer often involves accumulation, distribution, hedging, and risk management—not directional speculation like retail traders.
Retail traders who fail to recognize this often misinterpret market moves, expecting clean trends while institutions are executing complex strategies.
2.3 Uncertainty and Probability
The market’s offer is probabilistic, not guaranteed. Even high-probability setups fail. Accepting this uncertainty is essential for psychological stability.
When traders expect certainty, they fight the market instead of flowing with it.
3. The Negotiation: Where Trades Are Born
Every trade is a psychological negotiation between your offer and their offer.
You offer capital + risk
The market offers probability + volatility
Profit occurs only when your offer is aligned with what the market is prepared to deliver at that moment.
3.1 Alignment vs Conflict
When your expectations align with market conditions—trend, volatility, volume—trading feels effortless. When they conflict, emotional stress rises.
For example:
Trending mindset in a range-bound market leads to frustration
Scalping mindset in low liquidity leads to forced trades
Psychological pain often signals misalignment, not bad luck.
3.2 Timing Mismatch
Many losses occur not because the idea was wrong, but because the timing did not match the market’s offer. Impatience pushes traders to enter early, while fear pushes them to exit late.
Mastery comes from waiting until the market confirms your offer.
4. Emotional Traps Between Your Offer and Their Offer
4.1 Fear
Fear arises when your risk exceeds emotional tolerance. This leads to premature exits and missed opportunities.
4.2 Greed
Greed appears when traders expect the market to give more than it realistically can. This leads to holding winners too long or ignoring exit rules.
4.3 Revenge Trading
When the market rejects your offer through losses, ego often demands immediate compensation. Revenge trading is an emotional attempt to force the market to accept your terms.
Markets punish force; they reward patience.
4.4 Overconfidence
After a series of wins, traders believe the market has “accepted” them. Position sizes increase, rules loosen, and discipline fades—often before a sharp correction.
5. Psychological Maturity: Adjusting Your Offer
Professional traders do not try to dominate the market; they adapt their offer.
5.1 Flexibility Over Prediction
Instead of predicting outcomes, mature traders prepare scenarios. They adjust position size, strategy, and expectations based on market feedback.
5.2 Acceptance of Loss
Losses are not failures; they are the cost of participation. Accepting losses emotionally allows traders to stay objective and consistent.
A trader who fears losses will never fully receive the market’s offer.
5.3 Process Confidence
Confidence should come from following a process, not from recent results. When confidence is tied to outcomes, psychology becomes unstable.
6. The Power Balance: Who Controls the Trade?
The market controls price, but you control:
Entry selection
Position size
Stop-loss
Emotional response
Trying to control price is psychological self-sabotage. Controlling your behavior is professional trading psychology.
When traders accept this balance of power, stress reduces dramatically.
7. Long-Term Perspective: Relationship with the Market
Trading is not a one-time deal; it is a long-term relationship. Your offer improves over time through experience, self-awareness, and emotional regulation.
The market rewards:
Patience over urgency
Discipline over impulse
Humility over ego
When your offer becomes realistic, disciplined, and flexible, the market’s offer becomes more accessible.
8. Conclusion: Mastering “Your Offer vs Their Offer”
Trading psychology is the art of aligning what you want with what the market can realistically provide. Most traders fail not because they lack strategies, but because their psychological offer is incompatible with market reality.
Success comes when:
Expectations are realistic
Risk is controlled
Emotions are managed
Losses are accepted
Discipline is non-negotiable
In the end, profitable trading is not about forcing the market to accept your offer—it is about understanding the market’s offer and responding intelligently. When this balance is achieved, trading transforms from emotional struggle into a structured, professional endeavor.

Part 7 Trading Master Class1. Start with Buying Options
Risk is limited → good for beginners.
2. Learn Greeks
Greeks are the foundation of professional trading.
3. Use Spreads
Spreads reduce cost and risk.
4. Avoid Trading Near Expiry Initially
Premium decay is extremely fast.
5. Always Keep Stop-Loss
Especially for sellers.
6. Track IV (Implied Volatility)
Decide if an option is overpriced or underpriced.
7. Focus on Liquid Indices
NIFTY, BANKNIFTY, FINNIFTY have tight spreads.

Part 2 Support and Resistance How to Trade Options
Many brokers today allow access to options trading for qualified customers. If you want access to options trading, you will have to be approved for both margin and options with your broker.
There are four basic things you can do with options:
Buy (long) calls
Sell (short) calls
Buy (long) puts
Sell (short) puts

SPX — H&S pattern, with double top. Big short opportunityH&S pattern buliding on spx, with double top in place. Big short opportunity

S&P 500: Positioned for a Santa Rally?While tracking the global markets — especially the US indices — one thing stood out clearly.
The rally from 6521.92 to 6895.78 unfolded as a clean impulsive move , not a corrective grind. That structural behavior is what made me treat this leg as an impulsive rally (Wave 1/A) rather than just another bounce.
Since then, price action has cooled into a Wave 2/B reset , pulling back towards key Fibonacci retracement pocket . Structurally, this looks more like a pause before continuation than the start of a larger breakdown.
From a broader sentiment perspective, the backdrop remains supportive. The Fed’s recent rate cut continues to favor risk assets, NVIDIA’s staggering earnings have reinforced confidence in the AI-led growth narrative, and the CBOE Volatility Index remaining subdued suggests markets are not in a fear-driven regime.
So… will Santa deliver a rally — or even deliver early?
At the moment, the market appears to be positioning itself towards key Fibonacci retracement levels , creating a favorable setup for a potential Santa rally . If the structure holds, Wave 3/C could be the move where Santa shows up with the goods.
And if the US index does start unwrapping a rally, history suggests Indian markets rarely stay on the sidelines — definitely something to keep on the radar.
Disclaimer: This analysis is for educational purposes only and does not constitute investment advice. Please do your own research (DYOR) before making any trading decisions.

S&P 500 – Structural Roadmap & Macro ContextIntroduction
The S&P 500 remains one of the most important global risk benchmarks, influencing capital flows, sentiment, and cross-asset behavior.
This analysis focuses on the structural and wave-based framework of the index, shared strictly for macro context and market understanding, not for short-term trading or execution.
Key Observations
1. Wave Structure (The Roadmap)
The index has respected its broader Elliott Wave structure well. The recent dip toward the 6,600 zone appears to have completed the corrective Wave (4) (Blue), aligning precisely with the lower boundary of the rising channel.
Price behavior since then suggests the market is transitioning into the early phase of Wave (5) — typically the final bullish leg of the cycle, subject to continued structural validation.
On the internal degree, the market appears to have completed a short-term 1–2 setup, with price beginning to initiate a potential Wave 3 extension within Wave (5).
2. Key Support Zones (The Floor)
6,600 – Structural support and Wave (4) low, aligned with channel support
Invalidation Level: A daily close below 6,500 would invalidate this specific wave interpretation and require reassessment
The bounce from this zone reinforces the bullish structural framework.
3. Key Resistance & Reference Targets
6,925 – 6,985: Immediate resistance zone (previous highs)
7,497: Projection zone for the developing internal wave extension
7,734 – 7,900: Broader reference zone for Wave (5) completion, based on channel and wave projections
These levels act as structural reference zones, not execution targets.
4. RSI and Momentum
RSI (Daily): ~49.75
Momentum has reset to neutral territory, neither overbought nor exhausted. Historically, such conditions allow room for trend continuation without immediate momentum constraints.
5. My Final View
The primary trend remains bullish, with the recent correction appearing mature rather than trend-breaking.
View: Structure favors continuation over reversal
Approach: Trend-following bias rather than counter-trend positioning
Risk Note: Structural validity holds as long as price remains above channel support
Disclaimer
This analysis is shared strictly for educational and macro-structural purposes.
It does not constitute trading advice or investment recommendations. Always apply appropriate risk management.
#SP500
#SPX
#USMarkets
#MacroAnalysis
#MarketStructure
#GlobalMarkets
#IntermarketAnalysis
#RiskSentiment
#TechnicalAnalysis
#TradingView

US 500 – Next Moves on a Knife EdgeIt’s often said that fear and greed underpin moves across financial markets and that was certainly the case for US indices at the end of last week.
Focusing on the US 500, prices first reacted positively to a Federal Reserve interest rate cut which was accompanied by a more dovish outlook than many traders had anticipated from Chairman Jerome Powell in the press conference. This added fuel to hopes for a Santa rally to end 2025, briefly taking the US 500 index up to its previous record highs of 6924 on Thursday.
However, that period of greed didn’t last long before fear took over, when a disappointing sales forecast from Broadcom released after the close brought back concerns that the AI bubble may be deflating, a view that gained further momentum when it was reported on Friday that Oracle may be experiencing delays to their data centre rollout. These two important pieces of news helped to accelerate an eventual 1.3% sell off in the index down to Friday’s close at 6830.
While US 500 prices have stabilised in Asia early this morning, this battle between dip buyers, looking for a final upside flourish to challenge the psychological 7000 level and those more conservative traders, keen to bank strong year to date gains and wait for the start of 2026, could be about to renew, with the release of the latest US Non-farm payrolls on Tuesday at 1330 GMT which could provide clarity on how quickly the Fed may need to cut interest rates again at the start of 2026. This is followed by Micron’s Q3 earnings on Wednesday (after the close) where the debate of AI expenditure versus revenue may again be thrust into the spotlight.
These events could provide a volatile and challenging environment for traders to navigate, and consideration may need to be given to the technical outlook to assess whether upside momentum or downside fatigue may eventually dominate US 500 price action.
Technical Update: All-Time High Resistance Holding?
The US 500 index has staged an impressive near 6.4% advance from the 6508 November 21st session low to last week’s 6924 high. However, Friday’s sell‑off may mark the first indication that upside momentum is slowing or even failing.
In order to maintain positive price‑trending conditions, resistance levels must continue to be broken. Last week’s failure to extend strength and close above the October 30th high at 6925 may prompt some traders to question the sustainability of the recent upside price momentum.
Much will continue to depend on future price trends, but as the chart above shows, last Thursday’s high of 6924 tested resistance provided by the October 30th extreme at 6925. Importantly, this level capped prices again and downside weakness began to emerge, confirming 6925 as a key resistance focus.
Of course, Friday’s decline may yet prove to be another limited correction before fresh price strength resumes. So, it remains prudent to monitor key support and resistance levels closely in the coming week. Doing so could help to determine whether the latest activity reflects a slowing of upside momentum that could lead to further weakness, or simply a pause in the advance before renewed strength develops.
Potential Resistance Levels:
Following Friday’s price weakness after the failure to break above the 6925 high, this level now appears to be the first resistance focus for the coming week. Successful closes above 6925 would appear to be necessary to unlock potential for moves to higher levels.
While not a guarantee of continued upside, closing breaks above 6925 may signal attempts at a resumption of price strength. If confirmed, such closes could pave the way for attempts to challenge 7079, the 38.2% Fibonacci extension level, with scope for further gains toward 7176, the 61.8% extension, should that level also give way on a closing basis.
Potential Support Levels:
Friday’s weakness from the October 30th high at 6925 could now shift trader focus toward potential support at 6766, which is the 38.2% retracement of the November/December advance.
Closing breaks below 6766 could be further evidence of slowing upside momentum and might open scope for further weakness.
As the chart above highlights, closing breaks below the 6766 retracement support may expose risks of moves down toward 6717, the 50% Fibonacci level, and potentially even 6668, which is the deeper 61.8% retracement.
The material provided here has not been prepared accordance with legal requirements designed to promote the independence of investment research and as such is considered to be a marketing communication. Whilst it is not subject to any prohibition on dealing ahead of the dissemination of investment research, we will not seek to take any advantage before providing it to our clients.
Pepperstone doesn’t represent that the material provided here is accurate, current or complete, and therefore shouldn’t be relied upon as such. The information, whether from a third party or not, isn’t to be considered as a recommendation; or an offer to buy or sell; or the solicitation of an offer to buy or sell any security, financial product or instrument; or to participate in any particular trading strategy. It does not take into account readers’ financial situation or investment objectives. We advise any readers of this content to seek their own advice. Without the approval of Pepperstone, reproduction or redistribution of this information isn’t permitted.

Part 10 Trade Like Institutions Role of Option Greeks
Option Greeks help traders measure risk:
Delta: Sensitivity to price movement.
Gamma: Rate of change of delta.
Theta: Impact of time decay.
Vega: Sensitivity to volatility.
Rho: Sensitivity to interest rates.
Understanding Greeks enables better strategy selection and position adjustment.

Earnings Season Trading – A Complete Guide1. What Is Earnings Season?
Earnings season is the period when companies release their quarterly financial performance, including:
Revenue (sales)
Net profit or loss
Earnings per share (EPS)
Operating margins
Management guidance and outlook
In India, earnings seasons usually begin shortly after the end of each quarter:
Q1: April–June (results from July)
Q2: July–September (results from October)
Q3: October–December (results from January)
Q4: January–March (results from April/May)
During this time, stocks can experience sudden and large price movements due to surprises in results or guidance.
2. Why Earnings Season Is Important for Traders
Earnings are the primary driver of long-term stock value. While news, sentiment, and macro factors matter, earnings confirm whether a company’s business is actually performing.
For traders, earnings season matters because:
Volatility increases – Sharp price swings create trading opportunities.
Volume rises – Institutional participation increases liquidity.
Trend changes occur – Stocks may break out or break down decisively.
Repricing happens – Stocks are revalued based on future expectations.
A single earnings announcement can move a stock 5–20% in one session, especially in mid-cap and small-cap stocks.
3. How Markets React to Earnings
Stock price movement during earnings is not only about whether results are good or bad. The reaction depends on expectations vs reality.
Common Earnings Reactions:
Results better than expectations
→ Stock may rise sharply.
Results in line with expectations
→ Stock may remain flat or even fall (profit booking).
Results below expectations
→ Stock often declines sharply.
Strong results but weak guidance
→ Stock may fall.
Weak results but strong future outlook
→ Stock may rise.
This is why traders say:
“Markets trade on expectations, not just numbers.”
4. Types of Earnings Season Traders
1. Pre-Earnings Traders
These traders take positions before results, betting on:
Strong earnings surprise
Sector momentum
Insider or institutional accumulation
Technical breakout ahead of results
Risk is high because outcomes are uncertain.
2. Post-Earnings Traders
These traders wait for results and then trade:
Breakouts after earnings
Trend continuation
Gap-up or gap-down moves
This approach reduces uncertainty but may miss part of the move.
3. Options Traders
Options traders focus on:
Volatility expansion
Implied volatility crush after results
Directional or non-directional strategies
Earnings season is especially important for options due to volatility changes.
5. Popular Earnings Season Trading Strategies
1. Earnings Breakout Strategy
Identify stocks consolidating near resistance before earnings
Strong results trigger a breakout with high volume
Entry after breakout confirmation
Stop-loss below breakout level
Best suited for momentum traders.
2. Gap-Up / Gap-Down Trading
After earnings, stocks often open with a gap.
Gap-up with volume and follow-through → bullish continuation
Gap-up but weak volume → possible fade
Gap-down below key support → bearish continuation
This strategy is popular among intraday and short-term traders.
3. Buy the Rumor, Sell the News
Stock rises before earnings due to expectations
Even good results lead to profit booking
Traders exit positions before or immediately after results
This strategy requires understanding sentiment and positioning.
4. Post-Earnings Drift Strategy
Some stocks continue moving in the same direction for days or weeks after earnings.
Strong earnings + strong close = bullish drift
Weak earnings + weak close = bearish drift
Swing traders often use this strategy.
5. Options Volatility Strategy
Before earnings:
Implied volatility (IV) increases
After earnings:
IV collapses
Common strategies:
Straddle or strangle (for big moves)
Iron condor or credit spreads (to benefit from IV crush)
Options traders must manage risk carefully due to sudden moves.
6. Key Factors to Analyze Before Trading Earnings
Before taking any earnings trade, traders should analyze:
1. Historical Earnings Reaction
How much does the stock usually move after earnings?
Is it volatile or stable?
2. Market and Sector Trend
Bullish markets reward good earnings more
Weak markets punish even decent results
3. Expectations and Estimates
Compare analyst estimates with company guidance
Higher expectations mean higher risk of disappointment
4. Technical Levels
Support and resistance
Trend direction
Volume patterns
5. Management Commentary
Often, price moves more on:
Future guidance
Margin outlook
Demand visibility
than on current quarter numbers.
7. Risks in Earnings Season Trading
Earnings trading is not easy and carries unique risks:
Overnight risk – Results are often announced after market hours.
Whipsaws – Initial reaction may reverse quickly.
False breakouts – Emotional reactions can trap traders.
Volatility crush in options – Wrong options strategy can cause losses even if direction is right.
Because of these risks, position sizing and stop-loss discipline are critical.
8. Risk Management During Earnings
Smart traders follow strict risk rules:
Trade smaller quantities
Avoid overexposure to one stock
Use predefined stop-loss
Avoid revenge trading after losses
Prefer post-earnings confirmation if risk-averse
Professional traders focus on survival first, profits second.
9. Earnings Season for Long-Term Investors vs Traders
Investors use earnings to validate fundamentals and hold through volatility.
Traders use earnings for short-term price movements and momentum.
A trader may exit quickly, while an investor may add on dips caused by short-term disappointment.
Understanding your role is essential before trading earnings.
10. Conclusion
Earnings season trading is one of the most exciting and challenging aspects of the stock market. It offers exceptional opportunities due to high volatility, volume, and strong price discovery. However, it also carries higher risk because markets react not just to results, but to expectations, guidance, and sentiment.
Successful earnings traders combine:
Fundamental understanding
Technical analysis
Volatility awareness
Strict risk management
Rather than trading every result, disciplined traders focus only on high-probability setups. With experience, patience, and proper risk control, earnings season trading can become a powerful tool in a trader’s strategy arsenal.

Part 6 Learn Institutional Trading Buyers vs. Sellers
Option Buyers
Pay premium.
Limited risk (premium only).
Unlimited reward potential.
Low probability of profit (because time decay erodes premium).
Option Sellers (Writers)
Receive premium.
Limited profit (premium only).
Can face huge losses.
High probability of profit (because time decay works in their favor).
Professional traders often prefer selling options, but with strict risk management.

SPX – Wave 5 in Progress | Updated Analysis - 06-Dec-2025Continuation of Previous Elliott Wave Outlook (Link Below)
Chart Update Date: 06 Dec 2025
📍 Old Analysis Reference (28 Aug 2025)
In my previous analysis shared on 28 August 2025, I highlighted that the SPX was completing Wave 4 and was expected to resume the upward journey into Wave 5 within the rising channel structure.
🔗 Previous Forecast:
Price respected the projection zone perfectly, holding the 6,500 major support, which confirmed the end of Wave 4 and triggered the beginning of Wave 5.
📈 Current Technical Outlook
The index is now trading back inside the mid-channel region and above the BB mid-line, indicating continuation momentum.
💡 Key Observations
Wave 4 completed at 6,500 support zone
Strong rebound from channel bottom with bullish confirmation
RSI rising from 40–45 range & crossed signal line → bullish momentum shift
Price respecting the rising parallel channel structure
Trading above 20 SMA Bollinger mid-band
🎯 Wave 5 Upside Targets
Target Levels Notes
7,089 First resistance
7,255 – 7,497 Major Fib Cluster
7,600 – 7,734 Primary Wave 5 target
7,900 – 8,000 Extended Wave 5 potential
🛡 Invalidation & Support
Support Zone Comment
6,925 Short-term
6,500 Wave 4 low / structural invalidation
4,800 Long-term macro support
🧠 Conclusion
As long as 6,500 remains protected, the structure strongly favors bullish continuation toward 7,250–7,600 initially and possibly even 8,000.
📌 Bias: Bullish
📌 Invalidation: Close below 6,500
❓ Discussion
Will SPX achieve 8,000 before any major correction?
Share your thoughts below 👇

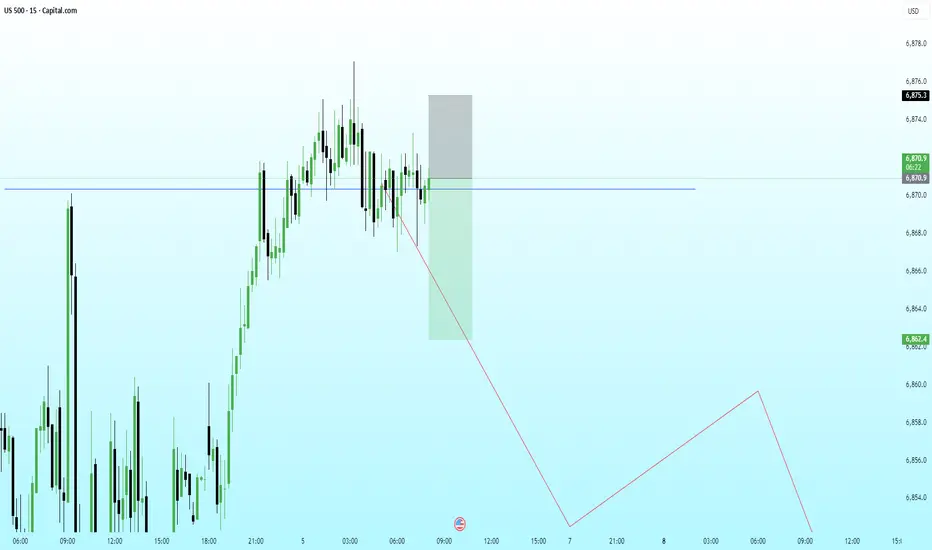
US500 – Clean Retest of Broken Structure With Bearish ContinuatiPrice has retested the broken structure level (blue line) and is now reacting inside a premium zone, suggesting sellers may re-enter the market from this region. The consolidation and repeated rejections indicate absorption of buy-side pressure.
With HTF context still pointing toward a deeper correction, this LTF retest offers a potential distribution setup before a continuation lower toward the next major liquidity pocket.
Bearish Path:
• Retest of the broken structure
• Reaction from premium supply zone
• LTF breakdown and structure shift
• Continuation toward downside liquidity + inefficiencies below