IOC is Going to hit upper limit after a Year!!After a year, IOC breaks 3 digits levels, and this time, if it holds resistance at 101 then the coming week target, will be achieved of Rs 116 with stop loss for short-term traders @98.. But if your view long term then no stop loss and also :
1. Last two trading include today- the big volume of trade was executive and last time such volume was there then it gives 10% rally.
2. On 18 may 2021 board meeting and results will be declared. Current scenario good dividend and results will be expected.
Note - It may rally down in the next two sessions due to the current scenario of covid and nifty break support but advise to buy on every dip for a long-term scenario.
IOC

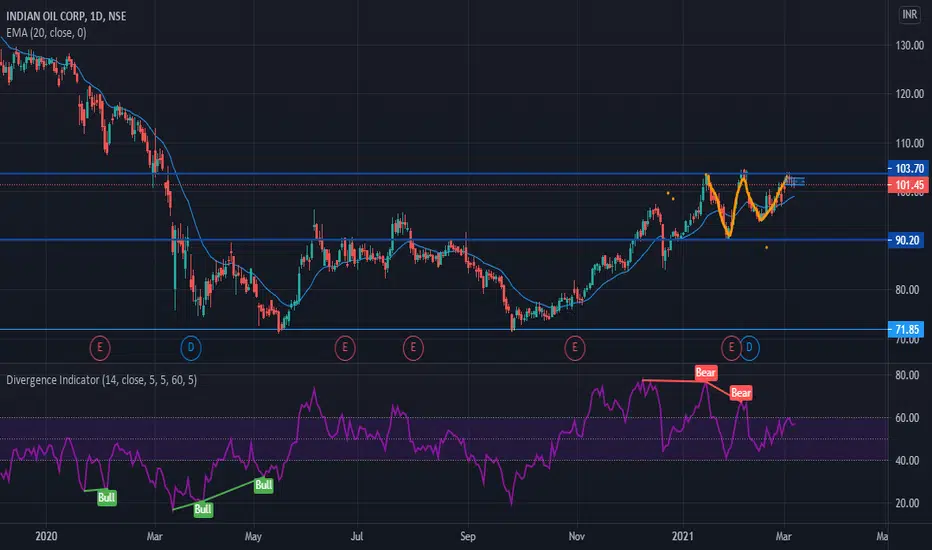
IOC quant box broken- short-term buyIOC has broken my quant box. Now one can sit on buy above 89.15 for the target of 91.55/94/96.55 with an SL of 86.65


IOC (Indian Oil Corp) - Multi Year Break Out - 40% UpsideIOC has broken out of a multi year downtrend - one that peaked in August 2017.
Immediate Targets:
#1 : 115
#2 : 125
#3 : 140 (This is a long shot for the next few months)
Stop Loss: 88

IOC - LONG TERM TRIANGLE BREAKOUTIOC has given a long term Triangle breakout with HEAVY BUYING VOLUME.
Good opportunity to invest for Medium to Long term.
LTP: Rs 102
Target: 155/170/230 in 6-12 months
SL: Rs 90

IOC Head & Shoulder BreakoutBuy IOC In Future
Closing Price - 94.85
SL - 91.7
Target - 100
Lot Size - 6500 Shares
Risk - 20475
Gain - 33475

IOC Share Price Trend AnalysisMay 07, 2021
Today on 1HR Chart Time frame IOC given 2 breakouts with Good Vol of 9.57 Million.
First Breakout is of Trend which was maintained by IOC since April 2021. A resistance has been breakout along with a support which was braked by IOC Share in March 2021. Now this support worked as resistance since last two months which IOC was trying to break. Today it was also broke & closing is on above the resistance Level.
Follow THE DECISIVE because WE HELP YOU TO DECIDE!
This was just for educational purpose only & not recommending to BUY/SELL of any Script.

IOC - Trend line breakoutPrice rejecting from the trend line consecutively from the top and now in the lower time frame a triangle pattern was formed and it is ready to break bother the trend line and the triangle. . .
Todays limit reached - I cant post anymore chart till tomorrow.
Almost all the stocks are at the edge of breakout after forming a pattern, second wave in India has nothing to do with market. So if you trying to short the market have a cover !!!

Accumulate IOC For RAPID GAIN, #BULLISH VOLUMEBUY IOC with Stop-loss of 86 in cash. All targets are mentioned on chart. Volume seems to be bullish.

IOCNote:
1. Views are personal and for educational purposes only. Recheck and take the trade as per your RR.
2. Always remember SL is your lifeline, not the big target...
3.Follow us for more patterns and like, share so that we feel it is helpful to many and share more patterns...
3. Views given here is not a tip rather it is for educational purpose... Aftermarket opens, the condition might change so learn to handle different conditions...
4. To learn more about patterns, Psychology behind the trade, and price action trading... contact us... Thanks...
Keep an eye ladies and gentlemen. Cheers and Happy Trading


IOC : Ready to flyFor Education only
IOC : Ready to fly. We may see good up move in next 2-3 weeks with support of 88 on closing basis

IOC analysis for short term💥all studies explained in the chart
forming ascending triangle
also 3 year of downtrend channel,making lower low's and lower high's.
102-105 acting as a major resistance.
there is chance to touch once again the trendline support then can a breakout.
study guys🙏🙏
like🔹comment🔹support🥰


#ABAN FLAG RETEST #BREAKOUT #STOCKMARKET #R:R>3 #IT #TECH #NIFTY#ABAN
NSE:ABAN
CMP: 31.30
Target: 50++
Stop Loss: 26
Time Frame: less than 2 months.
Might hold above 50.
Factors:
Rising Volume with rising Prices.
Channel Median breakout.
Flag pattern breakout.
Pennant Pattern Breakout with Bullish Candle.
Retest Successful.
Higher High & Higher Low.
Broken above resistance.
Trading at support.
Fundamentals are strong.
Risk Return Ratio is healthy.
And
Bullish Wedge Formed.
If you like my work KINDLY LIKE SHARE & FOLLOW this page for free Stock Recommendations.
With 💚 from Rachit Sethia

AFTER CONTINIOUS FALL FROM 2017 IOC MAKING HIGHER HIGHS 1ST TIMEAFTER THE CONTINIOUS FALL FROM 2017 IOC MAKING HIGHER HIGHS AND HIGHER LOWS FOR THE FIRST TIME IN DAILY AND WEEKLY TIME FRAME CMP 95 TARGET 105 IF BREAKS 105 THEN GOOD FOR LONG TERM INVESTORS .IF BREAKS TRENDLINE ON THE DOWNSIDE THEN BEARISH. PLEASE LET ME KNOW HOW GOOD IS THE ANALYSIS IN COMMENT SECTION.


IOC stock to take long entryIOC stock is forming W pattern which is the sign of bullishness.currently stock is trading in the zone or box. Buy only once the stock has broken the resistance level. Good buy above 105 for the target price of 115 -120 with the small SL of 98. This is for pure educational ideas.
#SUPPETRO #OIL #BANKNIFTY #NIFTY #TRADING #COVID19 #RELIANCE #IT#SUPPETRO
CMP: 459.25
Target: 577++
NSE:SUPPETRO
Can hold after the target!
Strongly bullish.
If you like my work, KINDLY LIKE, SHARE, & FOLLOW THIS PAGE for latest stock recommendations for free.
Might blast to more than 577++
Super Bullish on this stock.
From Rachit Sethia with 💚
SLong

INDIAN OIL CORPORATION IOC BUYIOC April expiry will end with 52 week high.
ioc uptrend. Expected 114 by month end. Exit positions after 110.
Covid lock down will not begin till completion of election.

IOC | Long Term Trendline Breakout with Volume 🎯⭕ Positional Trading opportunity ! Weekly Chart Alert !!!⭕
--Buy above =102.60 or CMP
--Target = 116.80 | 143.40
--Stop-loss = 84.80
--R:R =2.76
--Expected Profit = 39%
--Expected Holding = 1-3 Months only
#ThankU For Checking Out Our Content , We Hope U Liked IT 📌
======================================================
⭕Technical Reasons to trade or Strategy applied :- ⭕
1) Long term Trendline Break with volume
2) Long Term Resistance Breakout with volume
3) Volume is perfect
4) Stock has given the Triple Bottom Breakout
5) Fundamentals will support the stocks as well
6) Target is based on pattern height & S&R zone basis
Guys check out the related ideas as well, it will work really well GUARANTEED !
🙏FOLLOW for more !
👍LIKE if think is useful !
✍COMMENT Below your view !

