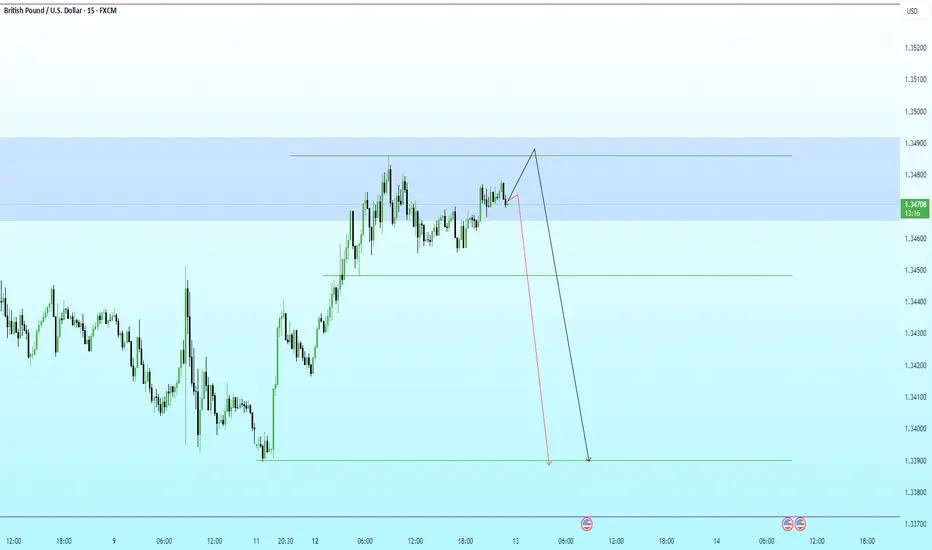
GBPUSD · 15M · SMC OutlookPrice is trading deep into premium, pressing against a well-defined HTF supply zone.
HTF Framework
Clear bullish leg already completed.
Buy-side liquidity resting above recent highs.
Premium zone aligns with prior distribution and weak highs.
LTF Structure
Momentum is slowing near the highs.
Price is consolidating under resistance, hinting at distribution.
Minor pullbacks are being absorbed, classic liquidity buildup behavior.
Expectation
A final push higher to sweep buy-side liquidity.
Reaction from supply after the sweep.
Strong bearish displacement targeting:
Internal range low
Prior demand imbalance
HTF discount zone below
Execution Plan
Avoid longs in premium.
Wait for:
Liquidity sweep above highs
Bearish displacement
LTF MSS for confirmation
Shorts favored post-confirmation.
Partial profits at range low, runners into discount.
Kondratieff Wave
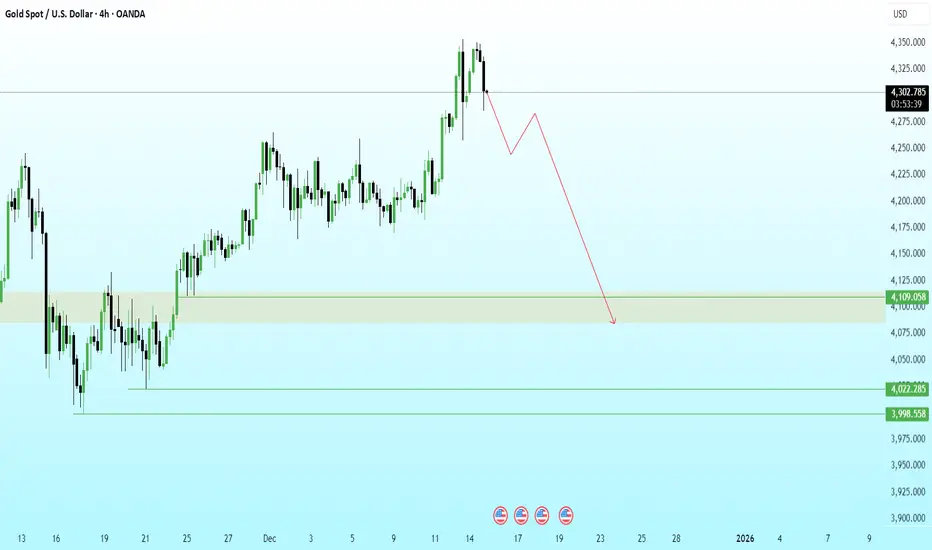
GOLD 4H | Liquidity Harvest Done… Now the Slide BeginsPrice engineered liquidity above the previous swing high and immediately delivered a sharp rejection, confirming a buy-side liquidity grab and the start of distribution.
Structure has now shifted bearish with a clear BOS from the premium zone. I’m expecting a mitigation leg before continuation lower.
The draw on liquidity sits inside the 4100–4080 demand imbalance, which aligns with unmitigated bullish orders from the prior accumulation phase.
If 4100 fails to hold on mitigation, the next liquidity pools rest at:
4022 (clean sell-side pocket)
3998 (final downside liquidity target)
EURUSD – Clean HTF Discount Zone Re-test With Bullish ContinuatiPrice has returned into a deep HTF discount zone, and the reaction from this area aligns well with my overarching bullish narrative. The marked zones represent the regions where I want to see LTF confirmational behavior before considering any long entries.
The structure remains intact as long as price holds above the lower boundary of the zone. A decisive close below that level will invalidate the bullish bias completely and shift the entire directional expectation.
Bullish Path:
• Price taps into the discount zone
• LTF confirms accumulation / BOS
• Price pushes toward the mid-structure continuation level
• Final objective lies near the upper liquidity pool (DOL), assuming underlying conditions remain unchanged
Key Levels Noted on the Chart:
• Entry Interest: All highlighted zones (LTF confirmation required)
• Mid-structure Expectation: Level where I want price to show EDD for continuation
• Final DOL Target: Only if macro conditions remain aligned
• Bias Invalidation: A clean close below the lower major zone
⚠️ ENTRY CONDITION (IMPORTANT):
I will execute the trade only if the LTF mirrors the structural behavior I’m expecting from the HTF.
No LTF confirmation = No trade.

XAU/USD | 15M | Smart Money Short SetupAfter a strong impulsive rally, price swept liquidity above the recent swing high and instantly rejected from a premium zone. A clear shift of structure confirms bearish intent, with supply perfectly aligning with imbalance fill.
🔹 Key Notes:
– Liquidity grab above previous high ✅
– Premium zone rejection ✅
– Market structure shift to bearish ✅
– Clean imbalance + Supply confluence ✅
Now expecting continuation to downside targeting the next demand and inefficiency below 4020 region.

EUR/USD Short SetupPrice ran out of steam after the rally — liquidity grabbed, rejection confirmed.
Risk defined, execution clean.
If bulls can’t defend, this will bleed.

It cant go lowerGlobally Crude rates are so low
They are not cutting the Petrol and rates of Diesel for consumers, but they are having a blast at the manufacturing end with IOCL and all

Historical Impact of Fed Interest Rates on Dow JonesThe current market cycle looks eerily similar to the 2005 - 2010 era.
Dow started going up after the last rate hike in expectation of a rate cut and eventually peaked around the time the cut started i.e. Sep 2007.
Very similar behaviour is evident in current cycle where market has been rising since the last rate hike. If the Fed cut is expected in June 2024, then there is still some upmove left, but we are close to the top.
P.S.: 1: Numbers mentioned are the rates after the said action.
2: Similar price action was developing in 2015-2020 period, however, it can't be considered as a valid reference on account of COVID crash.

5th Supercycle expansionSince bottom to bottom duration of bull markets from 1942 is almost same , this can be a case of expansion of 3rd cycle wave of 5th Supercycle.

LUPINDaily is looking very bullish and 4H timeframe has also shifted to bulllish structure. LUPIN is looking ready to fly

LTMindtree SwingWeekly and Daily TF looks bullish and structure has shifted and it is ready for impulsive move

Japan goes from sideshow to MainshowWe started to write about the ending pattern ni the Nikkei in late July, but if time was a science we could have said it will take another month to complete. The pattern did not change only the point where wave e ends did. We now have a breakout and a strong rally for Japanese stocks as the next impulsive rally begins. Japan longer term is a turnaround market in its own bull run.

The dollar index Resumes Bear MarketAfter 2 failures to hold on to the upward trend and corrective rallies, it is clear that this bull has no bones. The dollar index has been in a bear market since 2018 and each attempted rally has failed. This time is no different. The dollar bulls are about to make the most classic giving up of their opinion and they will do it all at once. It will be a meltdown of mammoth proportions.

ADA ACCUMULATION PHASEAda is in complete accumulation phase.
Accumulation is to collect or increase the amount of something. Accumulation can refer more narrowly to increases in the position size of an asset that is built up over multiple transactions. Accumulation can also refer to the overall addition of positions to a portfolio.
In technical analysis , accumulation points to a general increase in buying activity in an asset. In this case, the asset is said to be "under accumulation" or "being accumulated."


auropharma important levels better to stay long on dip in the counter , looks set for a 50% or more upside ! in couple of months !

tech m , weekly levels the stock had not performed yet , and is one of the most badly beaten stocks in the IT sector thus , now to maintain the index the stock need to perform and current structure as far as its above 650 looks very well!

stocks to avoid (4) such stocks whose whole base to move is news ...BETTER STAY AWAY FROM THEM ...and safeguard our capital!!!!!!
