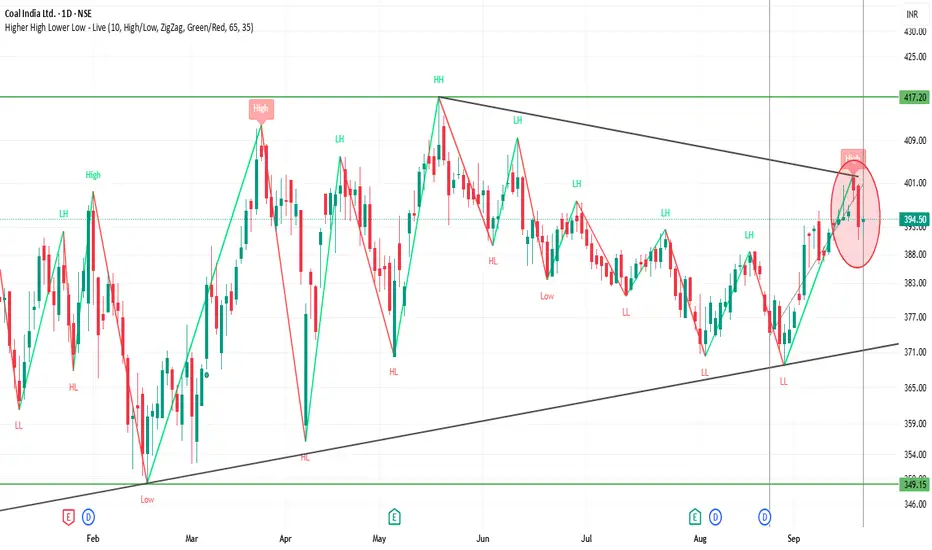
COALINDIA 1D Time frame📊 Current Overview
Current Price: Around ₹394–395
Day Range: ₹391 – ₹395
52-Week Range: ₹349 (Low) – ₹517 (High)
Recent Trend: Stock is consolidating after falling from highs.
🔍 Technical Levels
Support Zone: ₹380 – ₹385
Resistance Zone: ₹400 – ₹405
Range: Currently moving sideways between 385 – 400.
Candlestick Signs: Recent sessions have shown patterns like Harami Bullish and Doji, indicating indecision and possible reversal attempts.
📈 Momentum
Short-term: Neutral to slightly bullish if it holds above 385.
Upside Potential: Break above 405 can push towards 415–420.
Downside Risk: Break below 380 may lead towards 370–365.
Larsentoubro
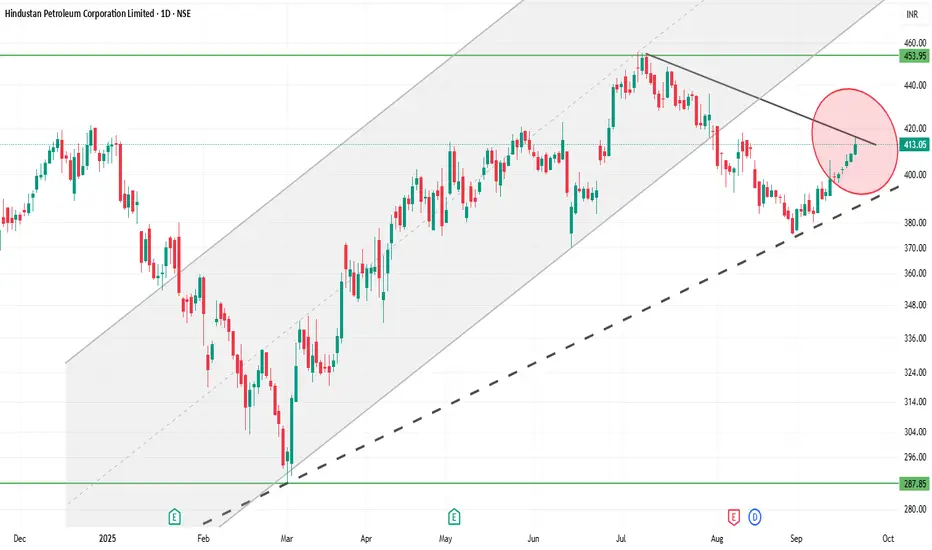
HINDPETRO 1D Time frameCurrent Price: 413
Current Trend: Strong bullish momentum; stock is trading near recent highs.
Support Zone: Immediate support at 405 – 410. If this holds, uptrend remains intact.
Resistance Zone: Next resistance at 420 – 425. A breakout above this can push toward 435+.
Indicators: Daily candles are bullish with strong buying interest; higher highs and higher lows visible.
Outlook:
Above 420 → continuation of bullish rally likely.
Below 405 → minor correction possible toward 395–400.
👉 In short (with 413 current price):
Bullish tone.
Range to watch: 405 – 425.
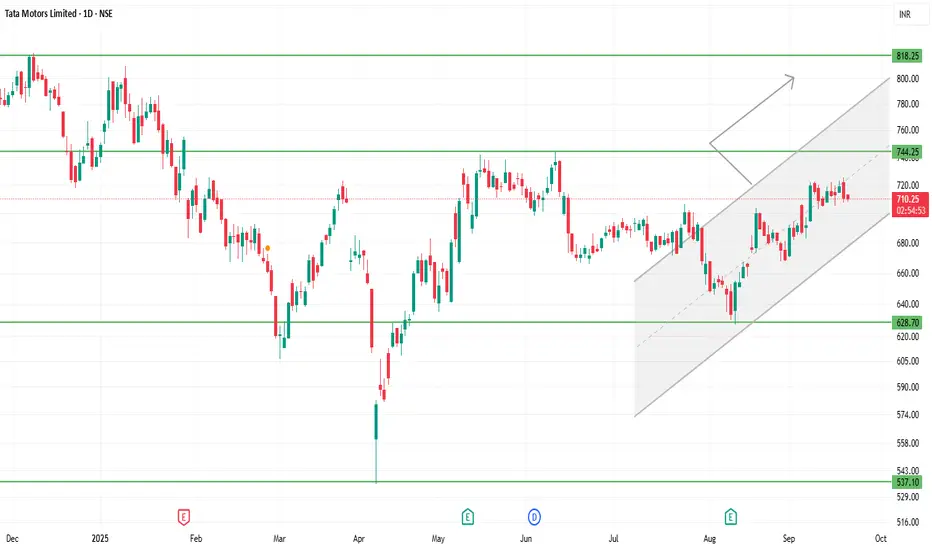
TATAMOTORS 1D Time frameTata Motors is trading around ₹710-₹720 (give or take).
The 52-week high is roughly ₹1,000+, and the 52-week low is approx ₹535-₹550.
There is visible investor concern: production halts (especially in JLR, its luxury arm) and demand pressures are weighing.
Recent performance is mixed; some short-term strength, but many indicators suggest resistance and caution.
⚙️ Technical / Trend Insights
The trend shows a mildly bullish bias in the short-term: price action is forming higher lows (e.g. holding above ₹700-705) which suggests buyers are defending downside.
Resistance zones are limiting gains: repeated attempts to push above ~₹720-725 have met selling.
Momentum indicators (RSI, MACD etc.) are positive but not deeply overbought — there’s room, but risk of pullbacks if resistance holds.
There are hints of bullish chart patterns (for example, ascending structures or potential reversal formations) if price manages to cross certain resistance levels.
⚠️ Risks / Things That Could Go Wrong
If it breaks down below ₹700-705, risk increases toward lower support in the ₹686-₹700 band.
Failure to break above ₹720-₹725 with decent volume could lead to sideways trading or minor corrections.
Macro / sectoral headwinds — demand issues, international business (JLR), cost pressures — could press down on fundamentals.
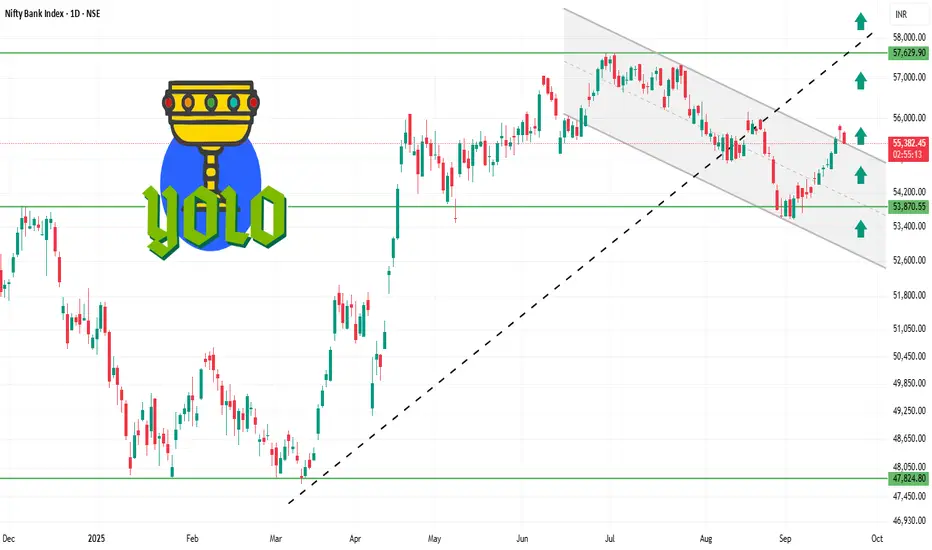
BANKNIFTY 1D Time frame✅ Current Facts
Current Level: ~ 55,400 – 55,480
Trend: Mildly bullish; trading above short-term moving averages (20-day & 50-day EMA).
Momentum Indicators:
RSI (14-day): ~61 → bullish but not overbought.
MACD: Positive → supporting the upward trend.
Price Action: Daily candles show small upper wicks → minor profit-taking near resistance.
⚙️ Outlook
Bullish Scenario:
Holding above 55,350 → retest 55,550–55,600 and possibly 55,700–55,750.
Range / Consolidation:
Price oscillates between 55,350 – 55,550 → sideways trading likely.
Bearish Scenario:
Close below 55,350 → downside risk toward 55,150–55,200 or lower.
⚠️ Key Facts
55,400 – 55,500 is acting as a short-term pivot: above it favors bulls, below it favors bears.
Resistance at 55,550–55,600 is the first hurdle; breakout here can lead to further upside.
Support at 55,300–55,350 is critical; failing to hold may lead to short-term correction.
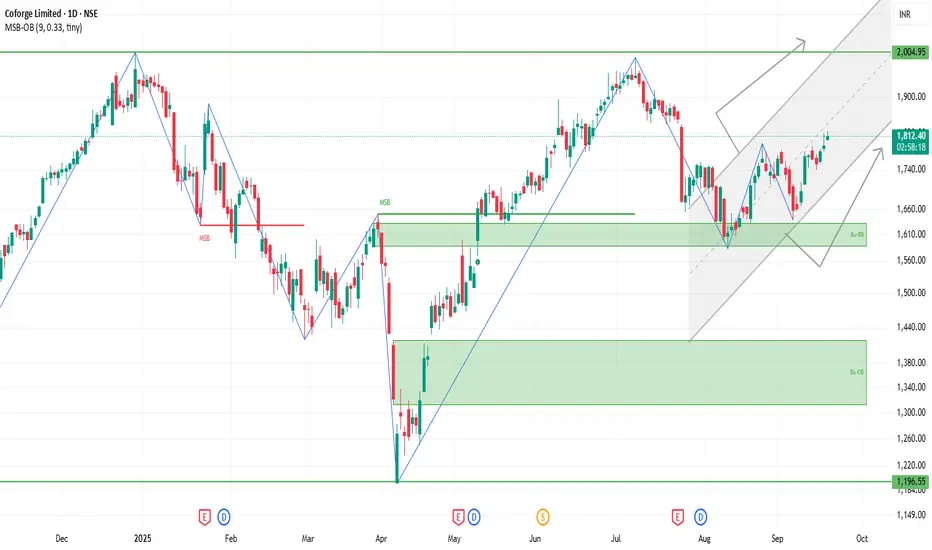
COFORGE 1D Time frameCurrent Snapshot
Price is trading near ₹1,812.
Stock is showing good strength above short-term and long-term moving averages.
Volatility is moderate, so sharp intraday swings are possible.
⚙️ Indicators / Momentum
Moving Averages: All key averages (short, medium, long) are bullish.
MACD / Momentum: Positive, supporting upside.
RSI: Slightly high, showing strength but near overbought zone → chances of small pullback.
📌 Key Levels
Immediate Resistance: ₹1,820 – ₹1,835.
Immediate Support: ₹1,790 – ₹1,800.
Stronger Support: ₹1,750 – ₹1,760 if weakness extends.
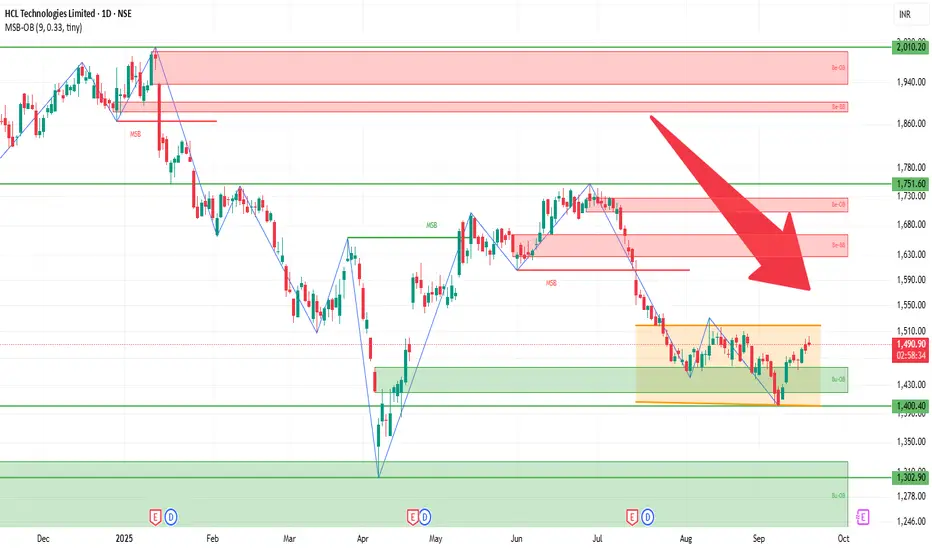
HCLTECH 1D Time frameCurrent Picture
Share price is ~ ₹1,499-₹1,505.
Recent momentum has been upward; the stock is trading above most moving averages—short-, medium-, and long-term.
Indicators are generally favoring continuation of the uptrend.
⚙️ Indicators / Momentum
Many oscillators (RSI, MACD, CCI etc.) are in bullish territory.
Moving averages from 5-, 10-, 20-, 50-, 100- to 200‐day are all aligned bullish (price above them).
Volatility is moderate to high — good movement, but also risk of pullbacks.
📌 Key Support & Resistance Levels
Immediate Resistance: around ₹1,505-₹1,515.
Immediate Support: near ₹1,480-₹1,490.
Stronger support further down around ₹1,400-₹1,420 in case of sharper correction.
✅ Outlook & Risks
Short term bias is bullish as long as price holds above the immediate support (≈ ₹1,480).
If resistance around ₹1,510 breaks decisively, more upside is likely.
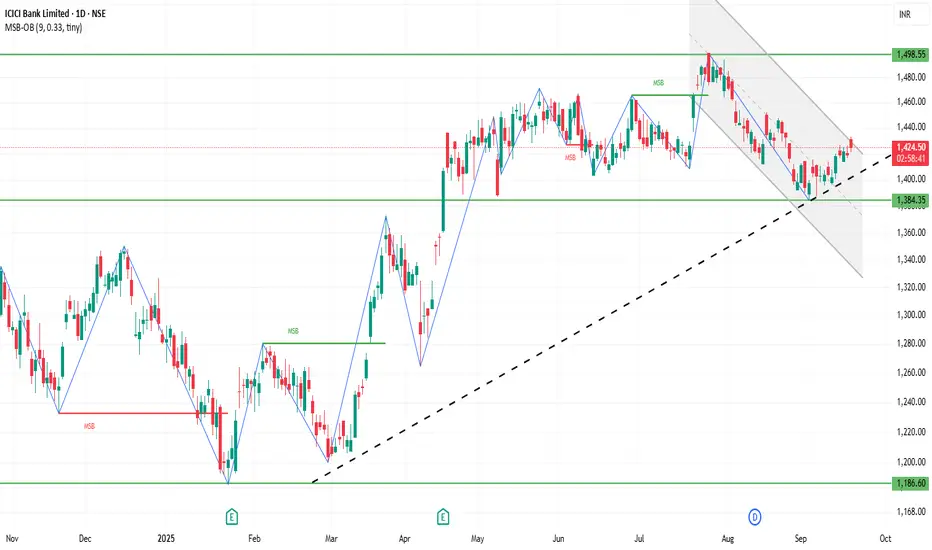
ICICIBANK 1D Time frameCurrent Snapshot
Price is around ₹1,402 – ₹1,420.
Stock is facing some short-term weakness, trading close to or slightly below short-term averages.
Longer-term trend is still stable as the price is well above its 200-day moving average.
⚙️ Indicators / Momentum
RSI (14): Neutral zone, not overbought or oversold.
MACD: Mixed, showing weak bearish pressure in the short term.
Moving Averages:
Short-term (5–10 day) → Mixed / sideways.
Medium-term (50–100 day) → Acting as resistance.
Long-term (200 day) → Still supportive, trend remains intact.
📌 Key Levels
Immediate Resistance: ₹1,440 – ₹1,450.
Immediate Support: ₹1,394 – ₹1,400.
Stronger Support: ₹1,340 – ₹1,350 zone.
LT Long IdeaLT looks good with Inverse Head & shoulder Pattern in making.
Targets are given and pattern Breakout candle low can be Stoploss.
NOTE: Risk management is Important.

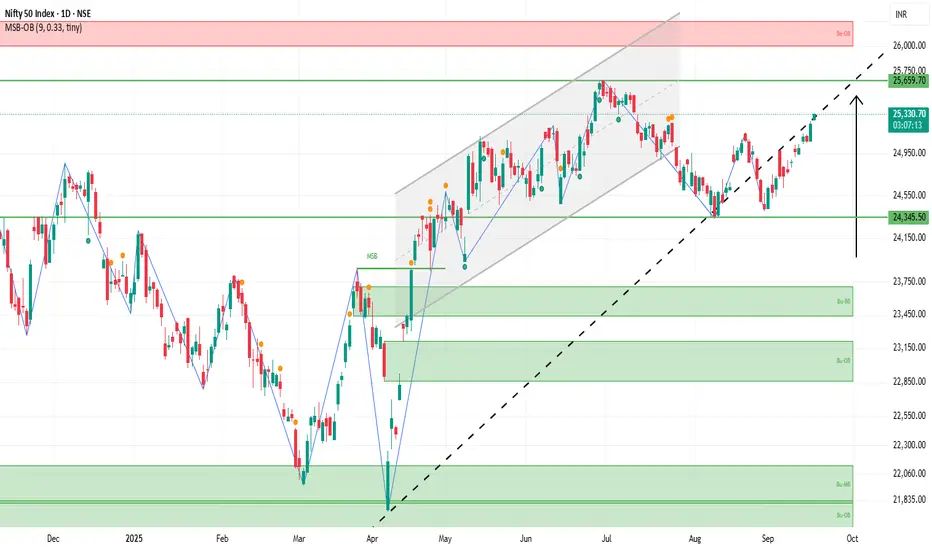
NIFTY 1D Time frame Today’s Nifty
Nifty is around 25,326.
It started higher than yesterday, so buyers are slightly stronger.
The trend is mildly bullish, not too strong.
Support (Where Nifty may stop falling)
25,229 → first safety net.
25,200 → key round number support.
25,000 → strong support; big drop if broken.
Resistance (Where Nifty may stop rising)
25,261 → small ceiling.
25,316 → bigger hurdle; breaking means bulls are strong.
25,350–25,360 → tough ceiling; breakout may continue uptrend.
Trend & Simple View
Mildly bullish now.
If Nifty breaks resistance, it may go higher.
If it falls below support, it may drop more.
Easy analogy: Nifty is like a ball bouncing between floor (support) and ceiling (resistance).
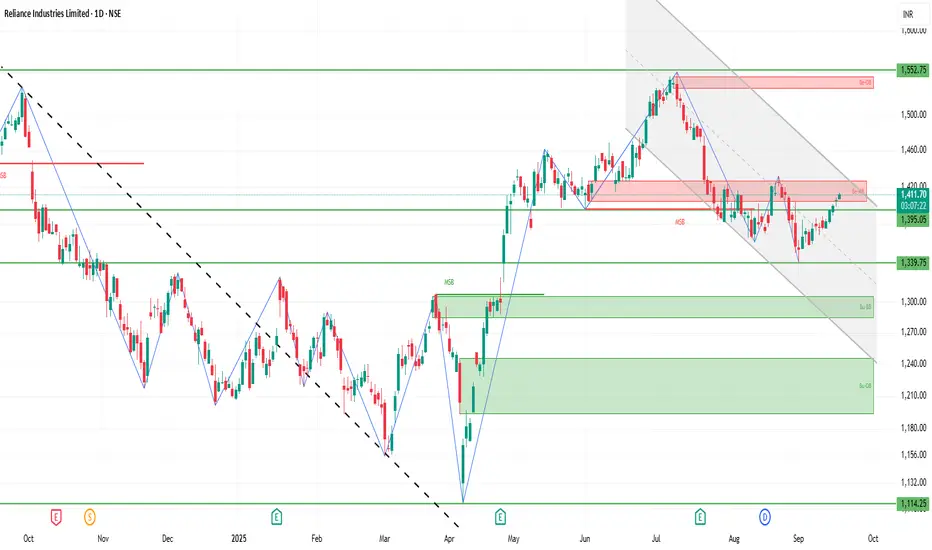
RELIANCE 1D Time frameCurrent Stock Price
Current Price: ₹1,411.60
Day’s Range: ₹1,406.90 – ₹1,412.50
52-Week Range: ₹1,114.85 – ₹1,551.00
Market Cap: ₹19.09 lakh crore
P/E Ratio: 23.43 (lower than sector average)
Dividend Yield: 0.39%
Book Value: ₹605.55
TTM EPS: ₹60.23 (+18.56% YoY)
📈 Trend & Outlook
Short-Term Trend: Mildly bullish; the stock has risen for five consecutive sessions.
Resistance Levels: ₹1,412.50 (day’s high), ₹1,551.00 (52-week high).
Support Levels: ₹1,406.90 (day’s low), ₹1,375.00 (recent low).
Investor Sentiment: Positive, with expectations around upcoming IPOs for Jio and Retail in 2026 and 2027, respectively.
🧭 Analyst Insights
Citi Group has a target price of ₹2,020, citing improved sentiment post-SEBI’s new listing norms for Jio and Retail.
Quant Mutual Fund increased its stake in Reliance Industries in August, indicating institutional confidence.
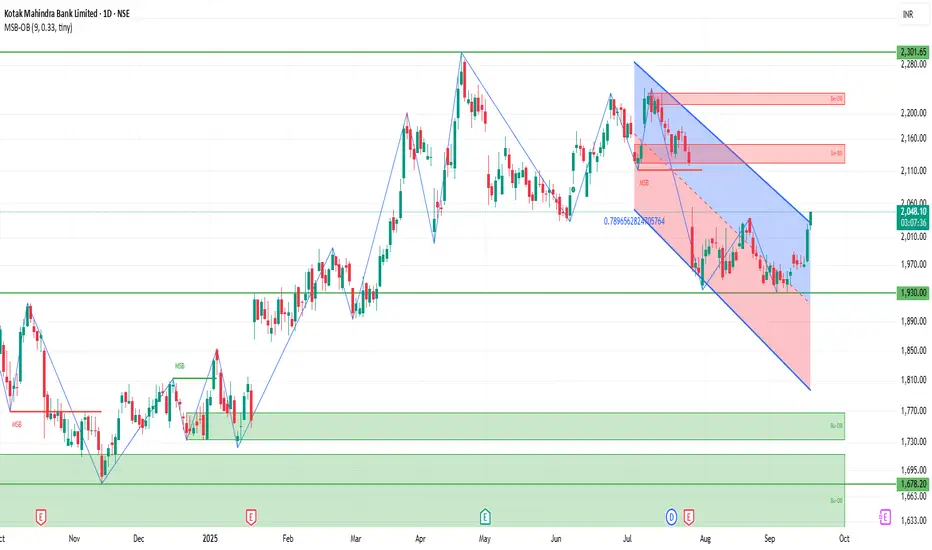
KOTAKBANK 1D Time frameCurrent Stock Price
Current Price: ₹2,045.60
Day’s Range: ₹2,020.30 – ₹2,045.60
52-Week Range: ₹1,679.05 – ₹2,301.90
Market Cap: ₹4.05 lakh crore
P/E Ratio (TTM): 20.47
EPS (TTM): ₹96.30
Dividend Yield: 0.12%
Book Value: ₹740.29
📈 Trend & Outlook
Short-Term Trend: Bullish; the stock is trading above key support levels and showing positive momentum.
Resistance Levels: ₹2,045.60 (day’s high), ₹2,301.90 (52-week high).
Support Levels: ₹2,020.30 (day’s low), ₹2,000.00 (psychological support).
Investor Sentiment: Positive, with strong institutional interest and favorable analyst outlooks.
🧭 Analyst Insights
Valuation: The stock is trading at a P/E ratio of 20.47, which is slightly above the sector average of 19.82, indicating a premium valuation.
Growth Prospects: The bank's strong earnings growth and robust capital position support its premium valuation.
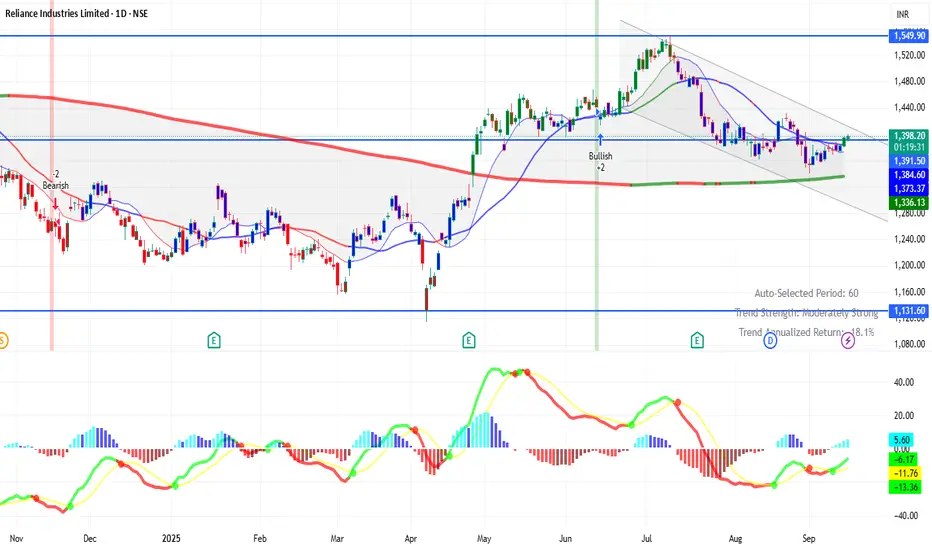
RELIANCE 1D Time framePrice Action
Current Price: ₹1,392 – ₹1,395 (approx)
Previous Close: ₹1,383.50
52-Week Range: ₹1,114.85 – ₹1,551.00
🔹 Support & Resistance
Immediate Support: ₹1,385 – ₹1,375
Next Support: ₹1,369
Immediate Resistance: ₹1,400 – ₹1,406
Next Resistance: ₹1,417
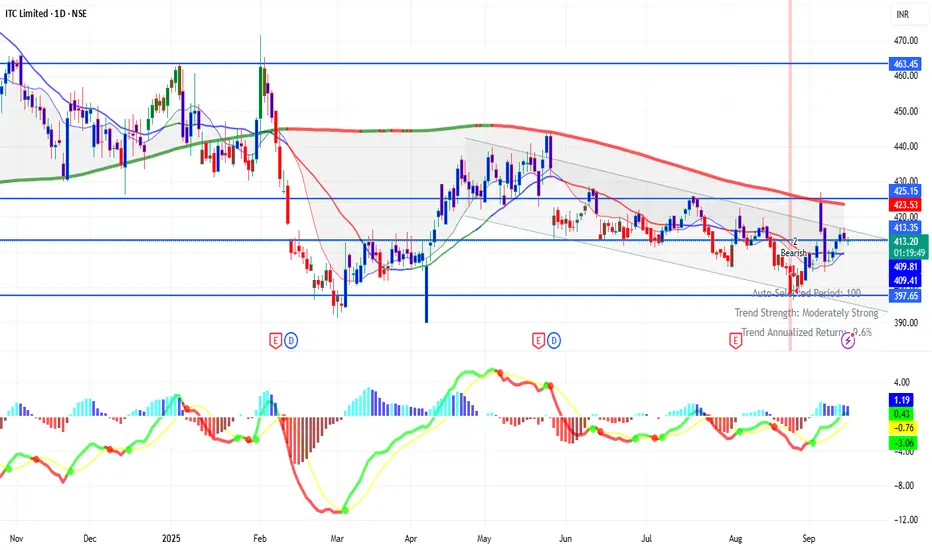
ITC 1D Time framePrice Action
Current Price: ₹413.75 (approx)
Day’s Range: ₹413.05 – ₹414.30
52-Week Range: ₹390.15 – ₹528.50
🔹 Support & Resistance
Immediate Support: ₹410 – ₹408
Next Support: ₹402 – ₹397
Immediate Resistance: ₹416 – ₹420
Next Resistance: ₹422 – ₹428
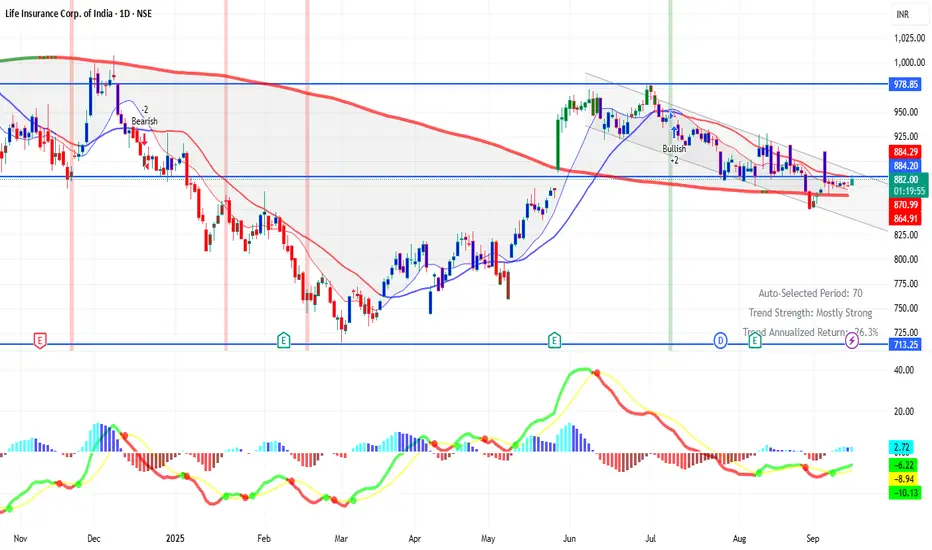
LICI 1D Time framePrice Action
Current Price: ₹882.50 (approx)
52-Week Range: ₹715.30 – ₹1,048.90
P/E Ratio: ~11.4
Book Value per Share: ~₹200+
🔹 Support & Resistance
Strong Support: ₹800 – ₹830
Immediate Resistance: ₹860 – ₹900
Next Resistance (medium-term): ₹1,000+
LT 1D Time frameCurrent Price
₹3,600.70
🔹 Market Snapshot
Day’s Range: ₹3,575.50 – ₹3,607.00
Previous Close: ₹3,579.80
52-Week Range: ₹2,965.30 – ₹3,963.50
Market Cap: ₹4.95 lakh crore
P/E Ratio (TTM): 31.91
P/B Ratio: 5.68
Dividend Yield: 0.94%
EPS (TTM): ₹112.82
Book Value per Share: ₹634.43

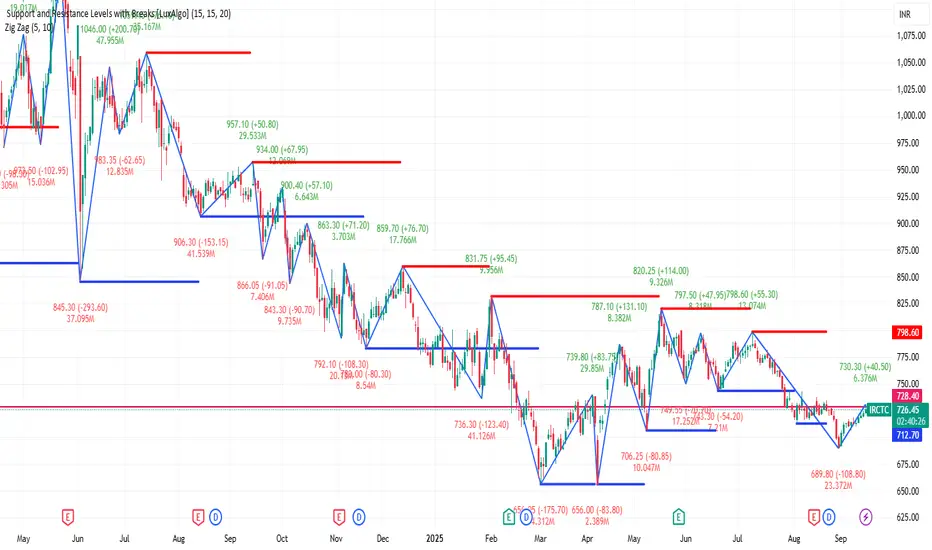
IRCTC 1D Time frameCurrent Price
₹728.65
🔹 Market Snapshot
Day’s Range: ₹722.55 – ₹730.30
Previous Close: ₹722.95
52-Week Range: ₹656.00 – ₹957.10
Market Cap: ₹57,776 crore
P/E Ratio (TTM): 44.33
P/B Ratio: 15.91
Dividend Yield: 0.00%
EPS (TTM): ₹16.44
ANGELONE 1D Time frameCurrent Price: ₹2,238 – ₹2,240
Day’s Range: ₹2,212.60 – ₹2,274
Previous Close: ₹2,222.30
🔹 Support & Resistance
Support 1: ₹2,220 – ₹2,215
Support 2: ₹2,200 – ₹2,180
Resistance 1: ₹2,250 – ₹2,260
Resistance 2: ₹2,270 – ₹2,280

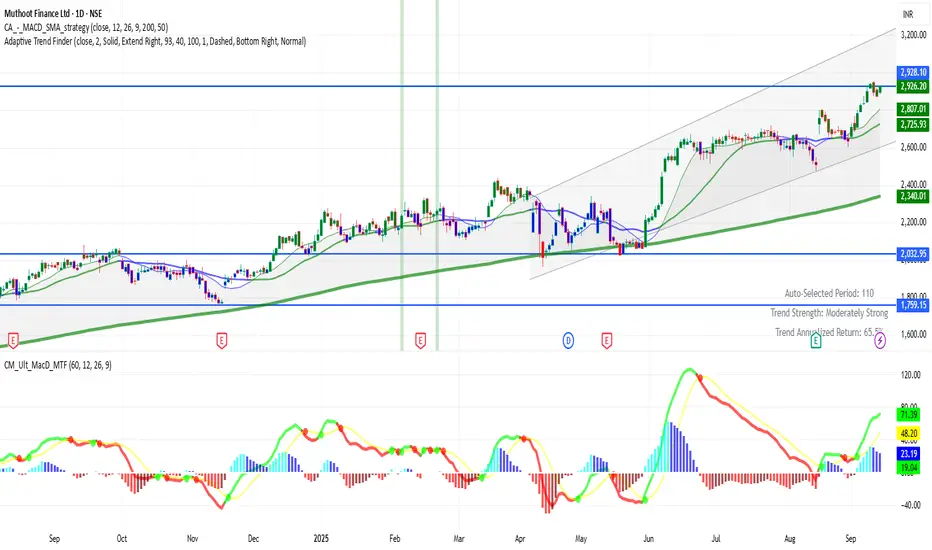
MUTHOOTFIN 1D Time framePrice is about ₹2,926
It's near its 52-week high region.
Price is trading well above most of its longer moving averages (50-day, 100-day, 200-day).
Bullish Scenario
Holding above ~ ₹2,900 is key. If that holds and price pushes past ~ ₹3,000, there’s potential to move up toward ~ ₹3,100-₹3,150.
Strength in broader market & favorable sector sentiment (gold prices, NBFC performance) would help.
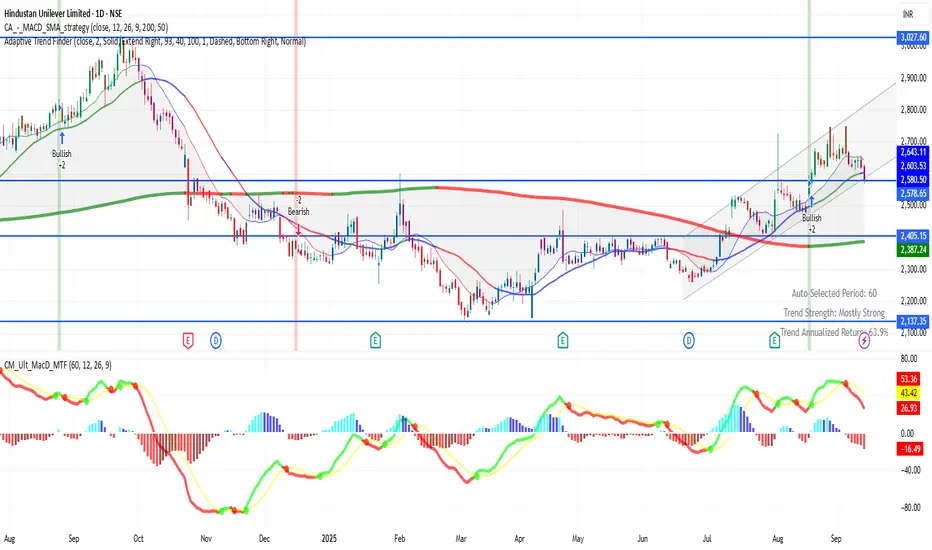
HINDUNILVR 1D Time frame General Status
Current Price: ~ ₹2,580
52-Week Range: Roughly from ₹2,136 (low) up to ~ ₹3,022 (high)
The stock has come down from its highs and is trading well below those peaks.
Bullish Scenario
If things turn favorable:
Holding above ₹2,550-₹2,500 is crucial. If that support holds, a bounce is possible toward ₹2,650-₹2,700.
If the stock breaks above that resistance cleanly, then targets in the ₹2,850-₹3,000 range could come into play.
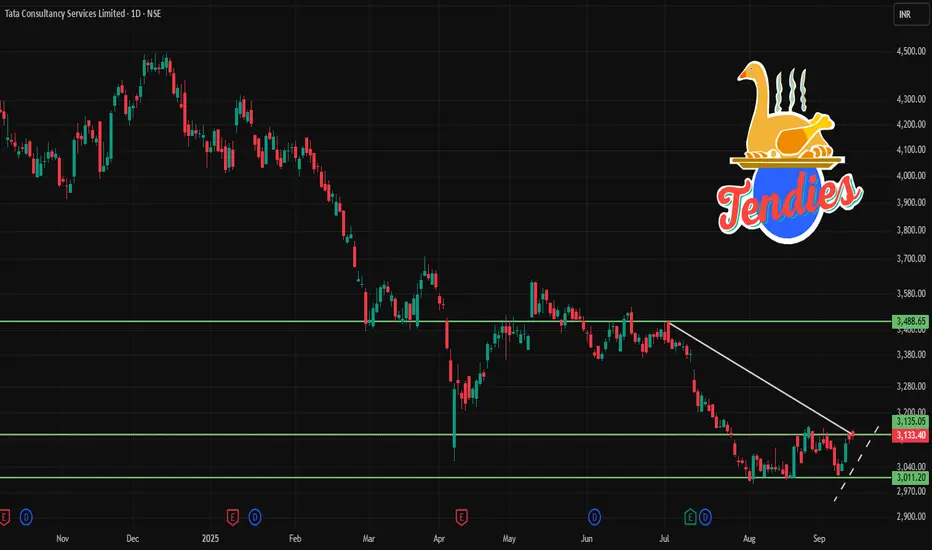
TCS 1D Time frame📉 Current Market Snapshot
Closing Price: ₹3,133.40
Day's Range: ₹3,121.00 – ₹3,148.70
52-Week High: ₹4,547.00
52-Week Low: ₹2,991.60
Market Cap: ₹11,21,000 crore
P/E Ratio (TTM): 22.8
Dividend Yield: 1.93%
Book Value: ₹262
ROE: 52.4%
Debt-to-Equity Ratio: 0.10
EPS (TTM): ₹136.19
Face Value: ₹1.00
HINDZINC 1D Time frame📍 Current Price
₹462.95 (closing price)
Short-Term Outlook
Bullish Scenario: A sustained move above ₹470.00 could lead to a test of the 52-week high around ₹575.40.
Bearish Scenario: A drop below ₹440.00 may signal a potential pullback toward ₹430.00.

AXISBANK 1D Time frame📍 Current Price
₹1,105.30 (up 1.64% from previous close)
Short-Term Outlook
Bullish Scenario: A sustained move above ₹1,115 could lead to a test of the 52-week high around ₹1,281.65.
Bearish Scenario: A drop below ₹1,080 may signal a potential pullback toward the ₹1,050 level.

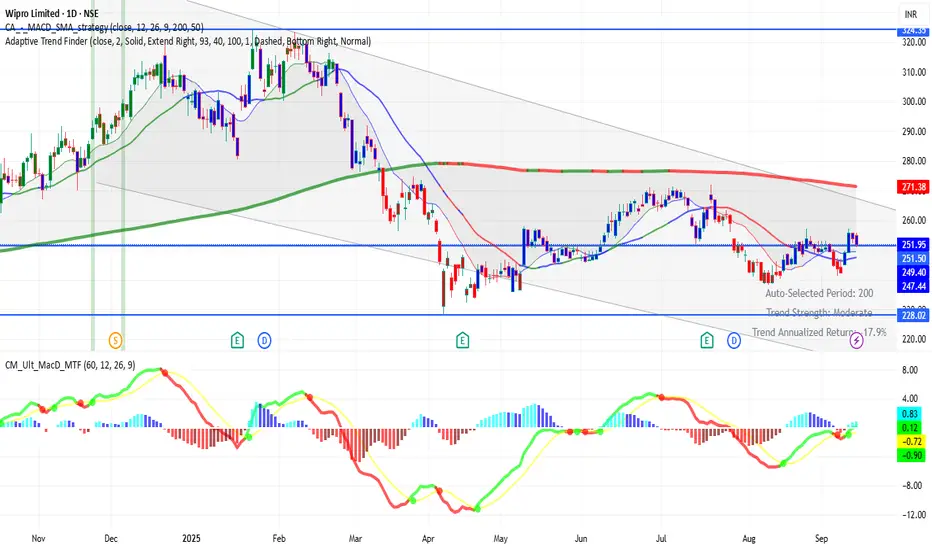
WIPRO 1D Time frame📊 Current Status
Price around ₹252–₹255
Showing recovery from recent support
🔑 Key Levels
Support: ₹242 → ₹240 → ₹230
Resistance: ₹255 → ₹260 → ₹265
✅ Outlook
If WIPRO sustains above ₹255–₹260, more upside is possible. Falling below ₹240 may push price back toward ₹230.