UCO BANK- BIG INVESTMENT OPPORTUNITYUCO BANK have currently taken support of HYDZ+QDZ+MDZ
LONGTERM TARGET should be at least 70 which is around 100% from current market price
have shared the QDZ chart
this stock should be added for regular trading opportunities as well
Learningtrading

Low Volatility, Big Opportunity? What VIX Says About Nifty.Good Afternoon!
Since market is red allover there nothing to do about it. Did some analyses with India Vix index how it gauge us with nifty 50.
How It Works :
1.When the VIX is low (as now), it means traders believe the market will stay stable prices won’t jump wildly soon. In such periods, big sudden crashes or rallies are less likely
But Analyzing nifty when Vix is between 8 to 12 generally it starts moving towards bull phase as per past example on chart.
2.When India VIX spikes sharply (say, above 18-25 or more), it means people are scared and bracing for large moves—like during COVID-19 or major elections.
Which is seen in chart from Sept'21 to Feb'22 till June'22 in Nifty when Vix was ranging between 15 to 33
Currently it ranging between 8 to 12 range which as per past may indicate a fresh leg in nifty.
But Again saying Price is King!

NIFTY - Triple Demand Zone Rebound with Strong Volume📈 NIFTY 50 – Powerful Reversal from Triple Intraday Demand Zones 💪
Date: 28th Oct 2025
Spot Price: ₹25,936.20
🔹 Resistances: 26,048 / 26,160 / 26,280
🔹 Supports: 25,816 / 25,697 / 25,585
🔹 Intraday Demand Zones:
1️⃣ 25,868 – 25,814
2️⃣ 25,809 – 25,790
3️⃣ 25,763 – 25,737
🔑 Key Highlights
Nifty witnessed a strong reversal from a cluster of three intraday demand zones.
The 25,800 region attracted heavy buying interest with a sharp volume spike.
Volume expansion at the base confirms fresh long accumulation by strong hands.
Structure suggests short-term bottoming within a broader sideways band.
Resistance around 26,048–26,160 will be the next key test for bulls.
🎯 STWP Trade View
Nifty’s recovery from these demand zones indicates buyers regaining control near lower levels.
Keep a close watch on any dips back into the demand zones — such retracements often provide high-probability opportunities for short-term traders.
As long as price sustains above 25,800, the bias stays bullish toward 26,160–26,280.
💡 Learning Note
When multiple intraday demand zones align together, they create a layered liquidity base — an area where institutions quietly accumulate positions.
Volume confirmation near such zones gives early signs of strength beneath the surface.
Final Outlook:
Momentum: Bullish recovery in progress | Trend: Range-bound but firm bias upward | Risk: | Neutral above 25,800 | Volume: Expanding — confirming active participation
________________________________________
________________________________________
⚠️ Disclosure & Disclaimer – Please Read Carefully
The information shared here is meant purely for learning and awareness. It is not a buy or sell recommendation and should not be taken as investment advice. I am not a SEBI-registered investment adviser, and all views expressed are based on personal study, chart patterns, and publicly available market data.
Trading—whether in stocks or options—carries risk. Markets can move unexpectedly, and losses can sometimes exceed the money you have invested. Past performance or past setups do not guarantee future results.
If you are a beginner, treat this as a guide to understand how the market works and practice on paper trades before risking real money. If you are experienced, always assess your own risk, position sizing, and strategy suitability before entering trades.
Consult a SEBI-registered financial adviser before making any real trading decision. By engaging with this content, you acknowledge full responsibility for your trades and investments.
Position Status: No active position in NIFTY at the time of analysis.
Data Source: TradingView & NSE India (Past Chart Reference) (Historical levels)
💬 Found this useful?
🔼 Give this post a Boost to help more traders discover clean, structured learning.
✍️ Drop your thoughts, questions, or setups in the comments — let’s grow together!
🔁 Share with fellow traders and beginners to spread awareness.
👉 “If you liked this breakdown, follow for more clean, structured setups with discipline at the core.”
🚀 Stay Calm. Stay Clean. Trade With Patience.
Trade Smart | Learn Zones | Be Self-Reliant 📊

Part 4 Learn Institutional Trading Risks of Options Trading
Options can be powerful but come with risks:
Time Decay (Theta): Options lose value as expiry nears.
High Volatility: Premiums can fluctuate wildly.
Leverage Trap: While leverage amplifies profits, it also magnifies losses.
Unlimited Risk (for Sellers): If you sell options, your risk can be theoretically unlimited.
Complex Strategies: Advanced option strategies require deep knowledge.
How Options Work in Practice
Let’s take a step-by-step breakdown using a Nifty Call Option Example:
Nifty Spot: 20,000
You buy a Call Option with Strike = 20,000, Premium = 150, Expiry = 1 month.
Scenario A: Nifty goes to 20,500
Option intrinsic value = 500 (20,500 - 20,000)
Profit = 500 - 150 = 350 per unit × Lot size (say 50) = ₹17,500 profit.
Scenario B: Nifty falls to 19,800
Option expires worthless.
Loss = Premium × Lot size = ₹150 × 50 = ₹7,500 loss.
This shows both the leverage and limited risk nature of options.

PCR Trading StrategiesWhy Trade Options?
Options exist because they allow flexibility and creativity in financial markets. Some common uses:
1. Leverage
Small premium controls large exposure.
2. Hedging
Portfolio managers buy Puts to insure against downside.
3. Income Generation
Writing covered calls generates steady premium income.
4. Speculation
Options let traders profit from not just direction, but also time and volatility.
Option Trading Strategies for Different Market Conditions
Bullish Market: Long Calls, Bull Call Spreads.
Bearish Market: Long Puts, Bear Put Spreads.
Sideways Market: Iron Condors, Butterflies.
Volatile Market: Straddles, Strangles.

Part 2 Ride The Big MovesRisks & Rewards in Options Trading
Unlike stock trading, options have asymmetric risk-reward structures:
Option Buyers: Risk limited to premium paid, but potential profit can be unlimited (for calls) or large (for puts).
Option Sellers (Writers): Profit limited to premium received, but risk can be very high if the market moves sharply.
Hence, option writing is generally done by professional traders with high capital and hedging systems.
Option Trading in India
In India, options trading is regulated by SEBI and conducted on exchanges like NSE and BSE.
Lot Sizes: Options are traded in lots (e.g., Nifty = 50 units, Bank Nifty = 15 units).
Margins: Sellers must deposit margin with brokers to cover risk.
Expiry Cycle: Weekly (indices) and monthly (stocks).
Liquidity: Index options are most liquid (Nifty & Bank Nifty).

Part 6 Institutional Trading The Greeks: The Math Behind Options
Advanced traders use Greeks to understand risks.
Delta → Sensitivity of option price to stock price movement.
Gamma → Rate of change of Delta.
Theta → Time decay (how much option loses daily).
Vega → Sensitivity to volatility.
Rho → Sensitivity to interest rates.
Example:
A Call with Delta = 0.6 → If stock rises ₹10, option rises ₹6.
Theta = –5 → Option loses ₹5 daily as time passes.
Options vs Futures
Both are derivatives, but with a key difference:
Futures → Obligation to buy/sell at a price.
Options → Right, not obligation.
Example:
Futures are like booking a hotel room—you must pay whether you stay or not.
Options are like paying for a movie ticket—if you don’t watch, you lose only ticket price.

Divergence SecretsOptions vs Futures
Futures = Obligation to buy/sell at fixed price.
Options = Right but not obligation.
Options require smaller margin (if buying).
Real-Life Example of Hedging
Suppose you own TCS shares worth ₹10 lakhs. You fear the market may fall in the next month.
👉 Solution: Buy a Put Option.
Strike: Slightly below current market price.
Cost: Small premium.
If market falls → Loss in shares covered by profit in Put.
If market rises → You lose premium but enjoy profit in shares.
This is like insurance.
Psychology of Options Trading
Options require quick decision-making. Traders often get trapped in:
Over-leverage → Buying too many lots.
Greed → Holding positions too long.
Fear → Exiting too early.
Successful option traders follow discipline, risk management, and proper strategy.

Part 3 Trading Master Class Option Trading in India (2025 Context)
India has seen an explosive rise in options trading. NSE reports show daily options turnover crossing ₹300 trillion in notional value.
Popular contracts:
Nifty 50 Weekly Options
Bank Nifty Weekly Options
FinNifty, Sensex, and Stock Options
Retail traders prefer weekly expiries because they are cheaper and offer fast opportunities. Institutions use monthly contracts for hedging and spreads.
10. Option Trading Psychology
Success in options is not just about strategies; it’s about mindset.
Discipline: Stick to stop-loss and position sizing.
Avoid Greed: Do not sell naked options without risk management.
Patience: Not every day is a trading day.
Continuous Learning: Market conditions and volatility regimes keep changing.

Part 2 Trading Master Class Advantages of Option Trading
Leverage – Small capital controls large positions.
Flexibility – Strategies for any market condition.
Defined Risk (for buyers) – Maximum loss = premium.
Hedging Tool – Protects portfolios from crashes.
Income Generation – Through selling options (covered calls, spreads).
Risks in Option Trading
Time Decay – Value erodes quickly near expiry.
Unlimited Loss for Sellers – Naked option selling is very risky.
Volatility Crush – After events like results, volatility falls and option premiums collapse.
Liquidity Risk – Some contracts are illiquid, making exit difficult.
Psychological Stress – Options move very fast; requires discipline.

Trading Master Class With ExpertsBasic Concepts & Terminology
Before going deeper, let’s simplify the core terms in options trading:
Strike Price: The fixed price at which the buyer can buy (call) or sell (put) the asset.
Expiry Date: The date on which the option contract expires (e.g., weekly or monthly).
Option Premium: The cost paid by the buyer to the seller for getting this right.
Lot Size: Options are traded in lots, not single shares. Example: Nifty option lot = 50 units.
In-the-Money (ITM): When exercising the option is profitable.
Out-of-the-Money (OTM): When exercising the option is not profitable.
At-the-Money (ATM): When the strike price = current price of the underlying asset.
Example:
Suppose Reliance is trading at ₹2,500.
A Call option with strike 2,400 is ITM (because you can buy at 2,400, lower than 2,500).
A Put option with strike 2,600 is ITM (because you can sell at 2,600, higher than 2,500).

Part 6 Learn Institutional TradingPopular Option Strategies
Options can be combined to design strategies:
Beginner Strategies:
Covered Call: Hold stock + sell call option.
Protective Put: Hold stock + buy put to protect downside.
Intermediate:
Straddle: Buy call + buy put (same strike) → profit in big moves.
Strangle: Buy OTM call + OTM put → cheaper than straddle.
Spread: Buy one option, sell another to reduce cost (Bull Call Spread, Bear Put Spread).
Advanced:
Iron Condor: Sell OTM call + put, buy further OTM call + put → profit in sideways market.
Butterfly: Buy 1 ITM, sell 2 ATM, buy 1 OTM → limited risk, limited reward.
Calendar Spread: Sell near-term option, buy long-term option.
Options Trading in India
Options are traded mainly on NSE.
Index Options (Nifty, Bank Nifty, FinNifty, Sensex) dominate volume.
Weekly expiry (Thursday) has made option trading highly popular.
SEBI Rules: Margin requirements apply for writers, buyers only pay premium.
Retail boom: 90%+ of daily market volume comes from options now.

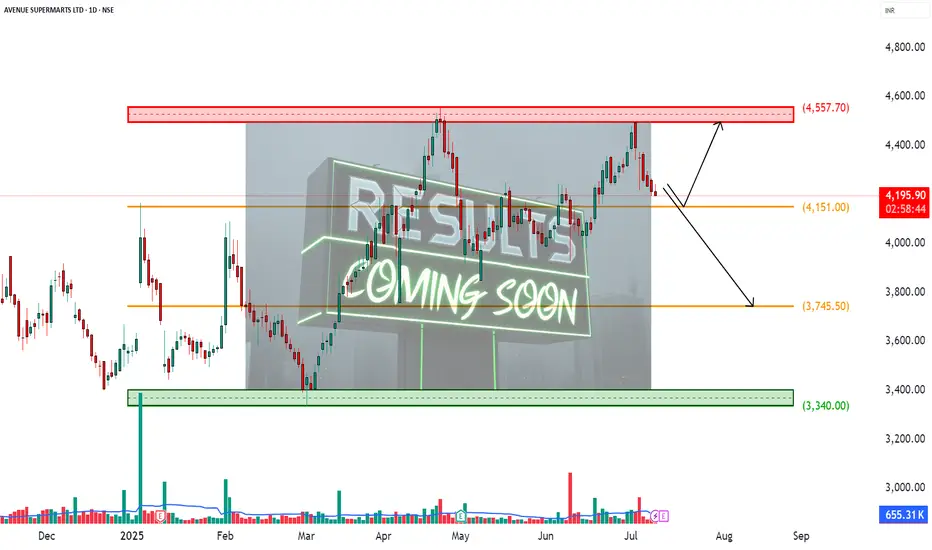
DMART – Earnings Incoming________________________________________________________________________________📈 DMART – Earnings Incoming: What’s the Right Time to Enter an Options Trade?
📆 Result Date: 11th July 2025 (Friday)
🕒 Strategy Style: Beginner + STWP HNI Learning Setup
🔍 For Educational Purposes Only
________________________________________________________________________________
🧠 What's the Setup?
DMART is announcing results on Friday, 11th July. We’re expecting a strong move — either up or down — because of mixed expectations around revenue and margins.
When you trade options around results, timing your entry is just as important as selecting the right strikes.
Let’s simplify it ⬇️ ________________________________________________________________________________✅ Option 1: Enter on 10th July (Thursday, After 2 PM)
💡 This is the ideal time for most traders.
🟢 Better option prices (not too inflated yet)
🟢 Good liquidity for smooth entry
🟢 Gives you overnight time to plan
🟢 You avoid the Friday panic crowd
🎯 STWP Suggested Strategy:
Buy 4300 CE + 4100 PE = ~₹180 total premium
This is called a Long Strangle – You win if the stock moves sharply up or down after results.
________________________________________________________________________________⚠️ Option 2: Enter on 11th July (Friday, Before 2 PM)
🔸 You might think, "Let me wait till Friday to get more clarity" — but there’s a catch:
❌ Option prices become expensive (high IV)
❌ Bid-ask spreads get wide (hard to enter)
❌ No time to react if results come intraday
❌ You’re stuck with weekend gap risk without prep
Unless you're experienced or scalping early, it’s not ideal for beginners.
________________________________________________________________________________🎯 Best Timing Rule – STWP Style:
📌 Enter on 10th July between 2:00 PM – 3:15 PM
Why?
You’ll lock in a clean setup with decent pricing and avoid stress.
📆 Exit Plan:
Hold through the weekend → Exit on Monday (14th July) if stock moves sharply 🔥
________________________________________________________________________________🧠 Alert:
Set alerts at:
₹4450 (Upside)
₹3950 (Downside)
If either hits on Monday, trail the winning side and exit the losing leg.
________________________________________________________________________________
📚 This is a learning example – not a trade recommendation.
Options carry risk. Please manage your capital and don’t trade blindly.
________________________________________________________________________________⚠️ Disclaimer (Please Read):
• This chart is shared for educational purposes only and is not investment advice.
• I am not a SEBI-registered advisor.
• The information provided here is based on personal market observation.
• No buy/sell recommendations are being made.
• Please do your own research or consult a registered financial advisor before making any trading decisions.
• Trading involves risk. Always use proper risk management.
________________________________________________________________________________
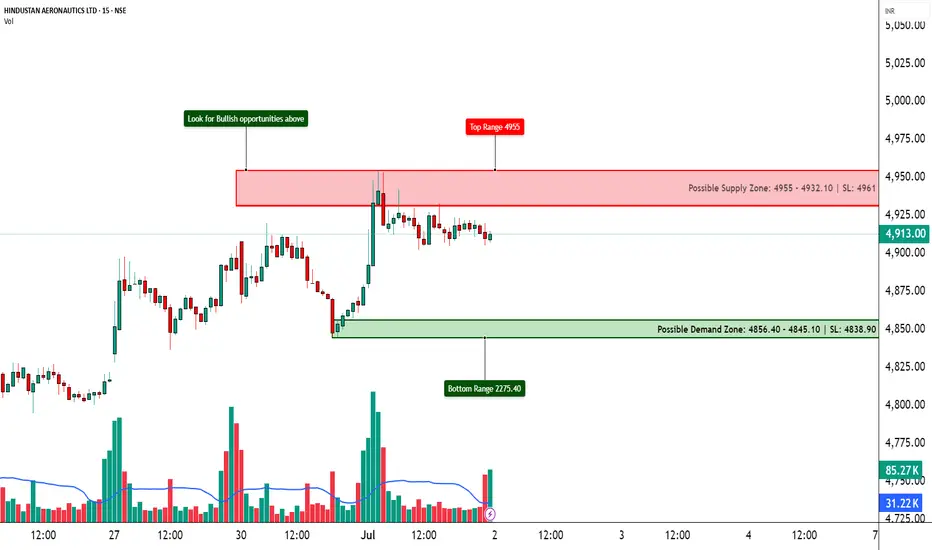
HAL – Ready for a Lift-Off?📈 HAL – Ready for a Lift-Off?
🔍 Bullish Action Heating Up | Option Chain + Price Action Analysis
Chart Type: 15-min / 1H / Daily
Indicators: STWP Zones, Volume, Demand-Supply, OI Analysis
🔹 What’s Catching Our Eye?
✅ Strong Long Build-Up at 5000, 5100 & 4950 Calls – Signs of institutional interest
✅ Short Covering at 4900 & 5200 CE – Shorts getting out = bullish continuation likely
✅ Highest OI at 5000 CE with +7.53% OI change = psychological breakout zone
✅ Spot Price at ₹4912 approaching key round-level resistance
✅ IV stable around 29.4%–29.7% → Room for volatility expansion if breakout happens
📊 What We’re Watching for:
📍 Breakout Zone: 4950–5000
📍 Targets: 5050 → 5100 → 5200
📍 Invalidation Below: 4850
📍 Momentum Confirmation: Sustained price close above 5000 with volume + OI surge
📍 Option Chain Bias: 5000 CE leading in build-up, supporting bullish sentiment
📌 Trade Plan (Educational Purpose Only):
🔹 Bullish: Buy above 4950 breakout with SL below 4850
🔹 Options: Consider 5000 or 5100 CE depending on your risk-reward
🔹 BTST/Positional Type: If price sustains above 4950–5000 with aggressive volumes
⚠️ Disclaimer:
This post is for educational and learning purposes only.
It does not constitute buy/sell advice or investment recommendation.
Always consult your financial advisor before taking any positions.
STWP is not liable for any financial decisions based on this content.
📚 “Smart money seems to be fueling the engines here.”
💬 Is HAL cleared for take-off above 5000? Or is it facing turbulence ahead?
Momentum Trading vs. Value Investing: Which Strategy Suits You?Hello Traders!
Today, let’s break down two polar-opposite strategies: Momentum Trading and Value Investing . Both can be profitable, but they cater to vastly different mindsets. Let’s find your fit!
Momentum Trading: Ride the Trend
What It Does: Capitalizes on short-term price momentum and volatility.
Best For: Active traders who thrive on quick decisions and market noise.
Some Stocks Examples (Not a Buy or sell recommendation) :
Adani Ports (ADANIPORTS) (infrastructure momentum plays).
Tata Motors (TATAMOTORS) (EV sector volatility).
Pros:
Quick profits in trending markets.
Works well with technical indicators like RSI and MACD .
Cons:
High risk of false breakouts.
Requires constant monitoring.
Value Investing: Buy Low, Hold Long 🛡️
What It Does: Targets undervalued stocks with strong fundamentals.
Best For: Patient investors focused on long-term wealth.
Some Stocks Examples (Not a Buy or sell recommendation) :
HDFC Bank (HDFCBANK) (undervalued banking giant).
ITC (ITC) (FMCG stalwart with dividend history).
Pros:
Margin of safety with low P/E ratios .
Compounding returns over decades.
Cons:
Slow growth in sideways markets.
Requires deep fundamental analysis.
Which Strategy Wins?
Momentum Trading : Ideal for volatile markets (e.g., trading Nifty 50 breakouts).
Value Investing : Perfect for bear markets or undervalued sectors (e.g., PSU stocks).
Hybrid Approach : Use momentum for short-term gains and value picks as core holdings.
TradingView Tools to Try
For Momentum: Track volume spikes , Bollinger Bands , and trend lines .
For Value: Use fundamental screeners for ROE , debt-to-equity , and dividend history .
Final Takeaway
Momentum = Fast-paced, high-risk, high-reward.
Value = Slow and steady, low-risk compounding.
Your Turn!
Are you a momentum chaser, a value hunter, or a mix of both? Share your style below!

Database in Trading Trading data is a sub-category of financial market data. It provides real-time information about stock and market prices as well as historical trends for assets such as equities, fixed-income products, currencies and derivatives.
Results show that migration to a MongoDB database would be most beneficial in terms of cost, storage space, and throughput. In addition, organisations wishing to take advantage of autoscaling and the maintenance power of the cloud should opt for a cloud native solution

BATA India Long setup ReadyLong bata india between 1420-1425. There is a very high probability that the stock will bounce back from the support level. Also, a bullish engulfing candle can be seen on the chart. Risk to reward is awesome in trade. Once stock starts trading above 200 EMA we can trail the SL. Add the stock in your watch list. This is for your educational purpose only.

Ashoka Buildcon long setup readyClearly, on the 2-hour charts, we can see the Ashoka buildcon . Can take a long entry above 238 once the breakout of the marked trend line. Watch every time stock touches the 200 EMA level it bounces back with good price action. please keep the stock on your watch list. Good risk to reward trade.

Long SCI swing TradeA Good setup has been seen on the daily chart of SCI. Long SCI above 274 for the target of 350+ with SL of 242. A very high probability that the stock will bounce back from the 200 EMA & the marked resistance area. Good risk to reward trade. hence keep the stock at your watchlist. This is for your educational purpose only.

SAIL TECHNICAL ANALYSISHi traders..
refer to chart
please note
sail trading at 97 and being a bottom -'s up candidate
we may seen good upside as nifty also on support
rise of nifty also would be support to achieve our targets.
my levels i have mentioned over chart.
for trade in this stock please consult with your financial consultant.
i'm just sharing my view and not recommending to buy / sell.
to learn char reading you may contact me @ 7239900171 MSG/ WHATSAAP

METROPOLIS Technical AnalysisHi Traders....
Please refer to chart pattern of METROPOLIS
I observed, Cup and Handle pattern
Check out important levels as per chart.
Bhaiya... chart achha lga to bta diya. buy / sell krne ko nhi bole hai.
aap apna dekh lijiyega. hm sebi certified nhi hai.
MLong

3 Trading Stats that you must haveToday’s topic is all about three trading stats that you must have.
If you remember I have spoken about the three step trading methodology in our talks at conferences and seminars. One of the components of the three step trading methodology is the optimisation component. This is when you’re looking at your stats to see how you can optimise your strategy or review your stats, look at what going wrong, what’s going well and what can be improved. In that review, there are a few stats that you definitely must be looking at.
The first one is reliability. What this means is basically the percentage of winners to losers. So we are really looking at how many trades actually won as opposed to those lost. For example, sometimes you can have systems where there’s a 40% reliability of winners and 60% losers. Or you can also have systems where you have 70% winners and 30% losers. You can have either one. Usually with swing traders when you’re looking for low frequency and high profitability strategies, the reliability of these reduces because each trade is looking at giving you a higher profit. Let me explain that as we come to the second point. So the first stat you need to look at is reliability of the strategy.
Here’s the second point. Not only is it important to look at how many times you’re winning – because that’s not really the whole picture – so the second point is where we need to know your average winner to loser. What we call average win to loss ratio. Basically this is very similar to your reward to risk ratio. One critical thing I must mention is that some traders say that they have to take a 3:1 reward to risk ratio trade or a 2:1 reward to risk ratio trade – that is all expected reward to risk ratio. You need to see how well is your strategy actually performing. That’s the most important point. What we’re then looking at is then we’re looking at the average. We know the actual winners, so how much did they make to the average loss that they made as well. So even though you may have a 40% reliability system, it’s only winning 40% of the time, if your actual win is say £200 to an average loss of let’s say £80, we’ve got about 2.5:1. So we’re looking at average win to average loss and that’s what you need to calculate in your stats. How much is it winning on average to your average loss?
The final thing you need to know about stats is expectancy. In terms of expectancy what you’re looking at is basically your average net profit. Your average net profit divided by your average loss gives you your expectancy. What this figure is actually telling you is how much each of your trades is making. For example, if you had 0.5 all it’s saying is that through the expectancy formula and normalisation factor what it’s telling you is that each trade is making you 0.5% profit.
Here’s a very quick tip for you, something to think about. If you want to increase that number you need to reduce the loss factor. This is why every single trade you take, the most important thing I keep stressing to traders, is to keep managing and focusing on the risk because the up-side will always look after itself. When you do that, when your average loss is minimal, that expectancy number really starts shooting up.
So these are the three things you can look at for improving and optimising your systems to see how well your strategy is doing. First is reliability, second is average win to loss ratio, and third is expectancy.
Do look at these stats, read up on them, or even post a comment or email us your questions if you have any challenges in knowing how to come up with these figures. We have trade log journals that measures this with all the formulas in our Traders Essentials Kit.
I believe this has been very useful for you to analyse your stats and analyse your strategy performance so that you know how and where you’re going wrong and how to optimize your strategy to push that equity curve into positive territory. That’s the end.
So give us your comments, give us your feedback and keep in touch. Until the next time, as we always say, stay disciplined, follow your plan and Trade Like a Master.

Bank Nifty on 21-03-2023Dear All
As per my understanding, I am sharing some Bank Nifty levels. It's only for learning purposes.
Keep Learning about the charts.
For the suggestions kindly tell me.
Thanking You.
