PETRONET LONGAfter making a base and consolidating Petronet has given a breakout. One can look for entry here or at dips around 285 286 levels.
SL- 280
Target- 295, 300.
Disclaimer This is just for educational purpose.
Jai Shree ram.
Momentumbreakout

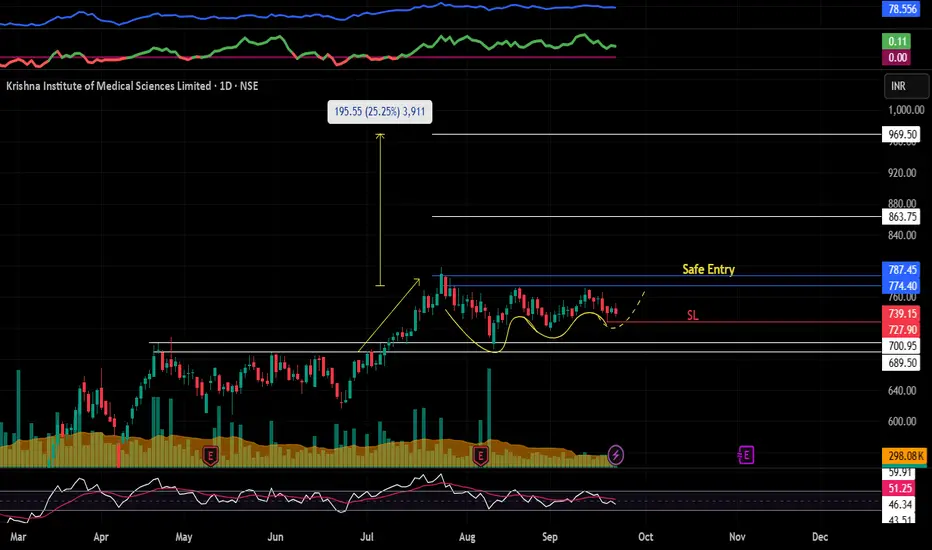
KIMS : Devloping VCP pattern structure#KIMS #vcppattern #vcpbreakout #swingtrading #momentumtrading
KIMS : Swing Trade / Short term
>> Trending Stock
>> VCP pattern developing
>> Volumes Picking up
>> Low Risk High Reward Trade
Swing Traders can lock profit at 10% and keep Trailing
Please Boost, comment and follow us for more Learnings.
Disc : Charts shared are for learning purpose only, not a Trade recommendation. Do your own research and consult your financial advisor before taking any position.
CENTURYPLY : Swing Pick#CENTURYPLY #swingtrade #swingtrading #trendingstock
CENTURYPLY : Swing trade
>> Breakout Soon
>> Trending Stock
>> Good Strength & Volumes
>> Low Risk Setup
Swing Traders can lock profit at 10% and keep Trailing
Please Boost, comment and follow us for more Learnings.
Disc : Charts shared are for learning purpose only, not a Trade recommendation. Do your own research and consult your financial advisor before taking any position.

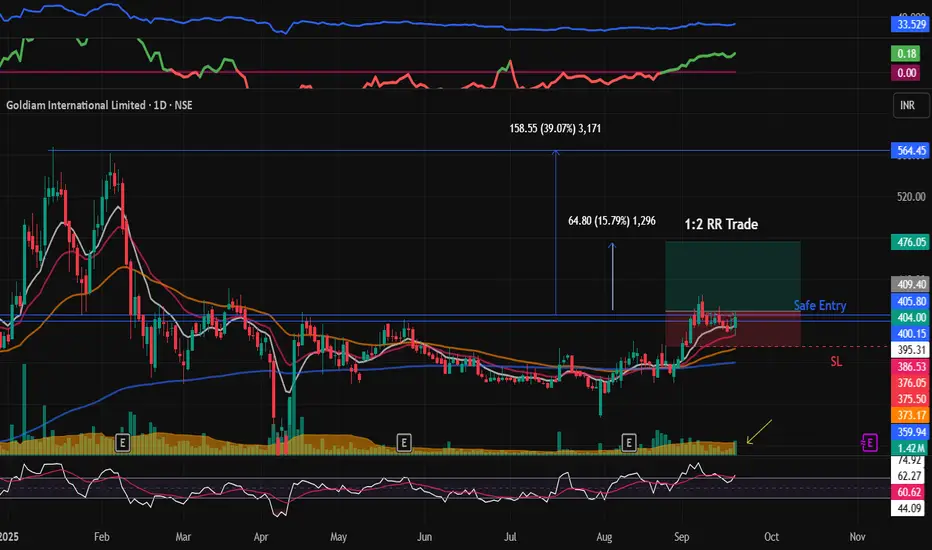
GOLDIAM : Breakout Stock#GOLDIAM #breakoutstock #trendingstock #lowRiskHighRewardTrade
GOLDIAM : Swing Trade / Short term
>> Breakout Trading
>> Breakout with Volume
>> Trending stock
>> Strength building up
>> Low Risk High Reward Trade
Swing Traders can look for 1:2 RR Trade, While Short term Traders can hold patiently for higher Targets
Swing Traders can lock profit at 10% and keep Trailing
Please Boost, comment and follow us for more Learnings.
Disc : Charts shared are for learning purpose only, not a Trade recommendation. Do your own research and consult your financial advisor before taking any position.
LAURUSLABS : Breakout Stock#LAURUSLABS #vcppattern #vcpbreakout #breakoutstock #trendingstock
LAURUSLABS : Swing Trade / Short Term
>> Rally - Base - now ready for RAlly
>> Base = Beautiful Vcp pattern
>> VCP pattern Breakout with Volumes
>> Trending stock in Momentum
>> Good Strength & Volumes
Swing Traders can lock profit at 10% and keep Trailing
Please Boost, comment and follow us for more Learnings.
Disc : Charts shared are for learning purpose only, not a Trade recommendation. Do your own research and consult your financial advisor before taking any position.

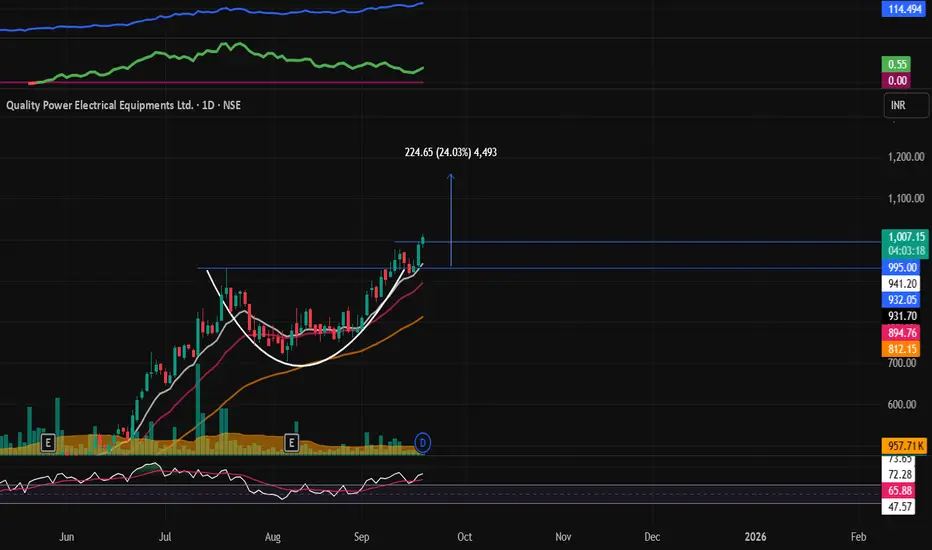
QPOWER : Breakout Stock#QPOWER #vcppattern #breakoutstock #momentumtrade #trendingstock #swingtrade
QPOWER : Momentum Pick
>> VCP Pattern
>> Breakout & Retest done
>> Trending stock
>> Good strength & Volumes building up
>> Good Upside potential
Swing Traders can lock profit at 10% and keep Trailing
Please Boost, comment and follow us for more Learnings.
Disc : Charts shared are for learning purpose only, not a Trade recommendation. Do your own research and consult your financial advisor before taking any position.
MANORAMA Industries : Momentum pick#MANORAMA #momentumtrade #swingtrade #lowriskhighreward
MANORAMA : Momentum Trade
>> Liquidity sweep visible
>> Low Risk High Reward Trade
>> Volumes dried up
>> Stock showing strength
Swing Traders can lock profit at 10% and keep Trailing
Please Boost, comment and follow us for more Learnings
Disc : Charts shared are for learning purpose only, not a Trade recommendation. Do your own research and consult your financial advisor before taking any position.

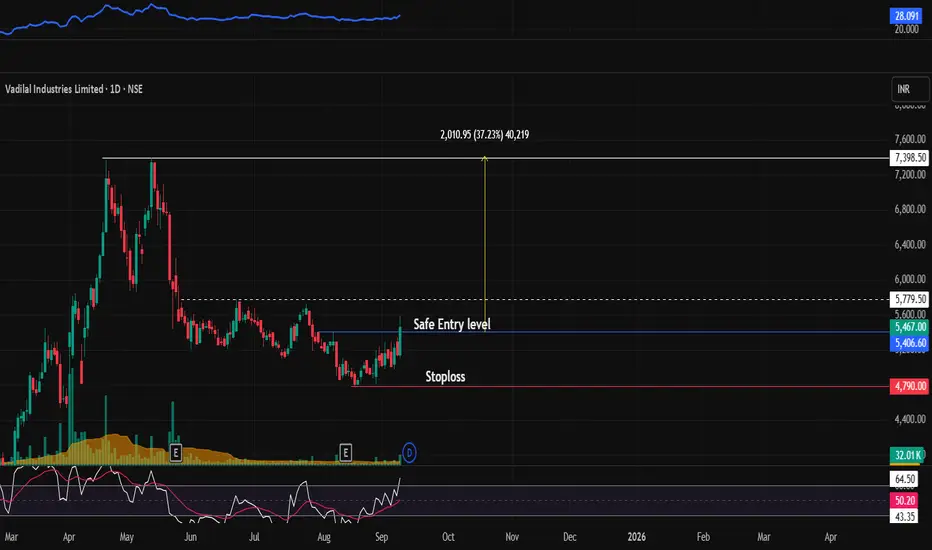
VADILALIND : Breakout Stock (Swing - Short Term)#VADILALIND #breakoutstock #Trendingstock
VADILALIND : Swing / Short term (1-3 months)
>> Strong Breakout candle
>> Good Strength in Stock
>> Volumes Picking up
>> Good upside potential
>> Low Risk High Reward
Swing Traders can lock profit at 10% and keep Trailing
Please Boost, comment and follow us for more Learnings.
Disc : Charts shared are for learning purpose only, not a Trade recommendation. Do your own research and consult your financial advisor before taking any position.
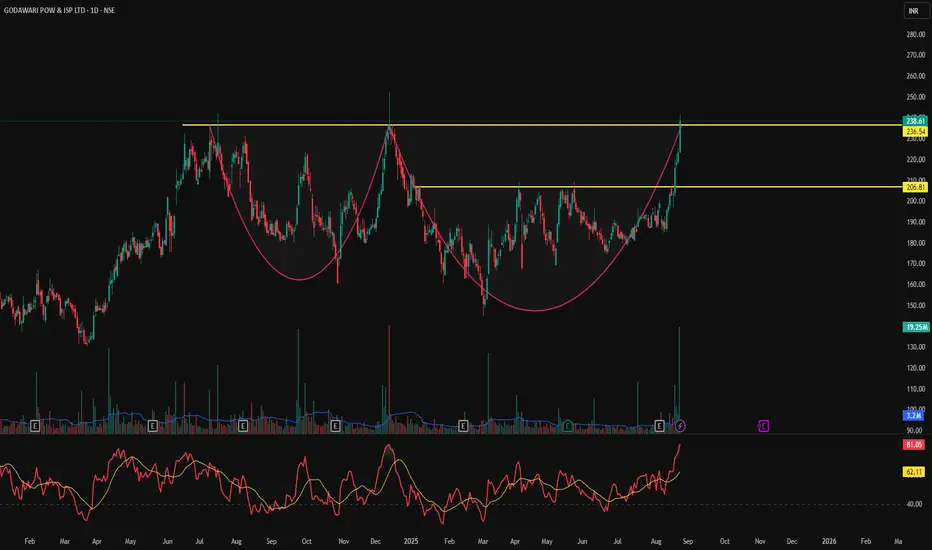
GPIL - Cup & Handle Breakout | Daily Chart📊 GPIL – Cup & Handle Breakout with Explosive Volume | RSI > 80
📅 Chart Date: August 24, 2025
📍 CMP: ₹238.61 (+6.91%)
📈 Symbol: NSE:GPIL | 1D Timeframe
🔍 Technical Analysis
☕ Cup & Handle Breakout
A multi-month Cup & Handle pattern has been completed.
Price gave a strong breakout above the neckline zone ₹206.81.
Next supply zone is around ₹236–₹240, which is being tested.
💥 Volume Confirmation
Relative Volume (RVol): 842% 🔥
Today’s volume 19.25M vs avg 3.2M — heavy institutional buying.
📈 RSI (14, close): 81.05
Stock is in the overbought zone, indicating strong momentum.
Short-term pullback possible, but trend remains bullish above breakout.
📌 Key Levels
Breakout Zone (Support): ₹206.81
Immediate Resistance: ₹236–₹240
Next Target Levels: ₹260 / ₹280
Stoploss for Swing Traders: ₹200
Entry on Retest: ₹210–₹215
Stoploss: ₹200
Targets: ₹260 / ₹280
⚠️ Disclaimer: This is an educational chart setup and not trading advice. Please conduct your own research and risk management.
📣 Follow @PriceAction_Pulse for more such clean breakouts and chart pattern analysis!
🔁 Drop a comment if GPIL is on your radar for the next breakout rally 📈
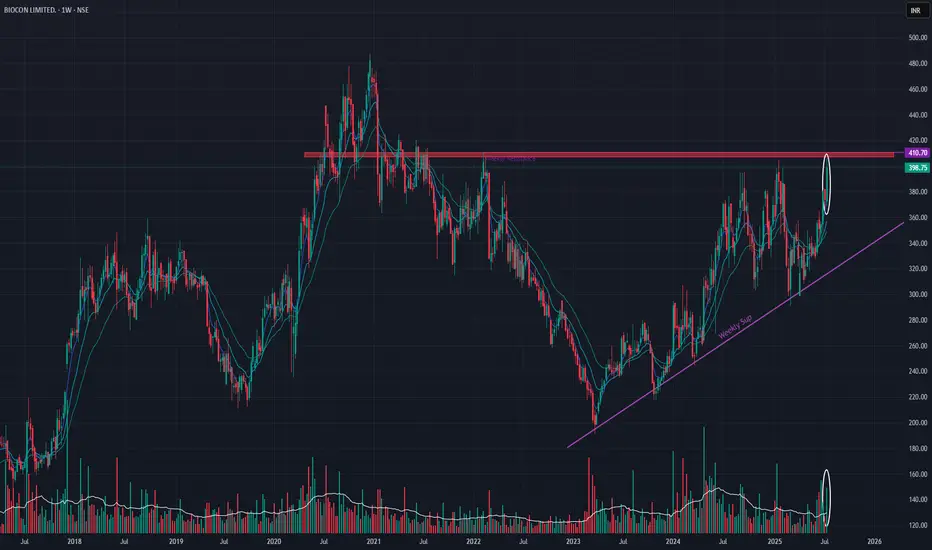
Biocon Ltd (Weekly Timeframe) - Potential BreakOutSince Feb 2021, Biocon has tried to BreakOut of the resistance zone (407 - 411) , without any success. In the recent past (Sep 2024, Jan 2025 & last week) as well it tried to BreakOut of this zone . Last week there has been a gain of +6.56% as well as HUGE spike in volume suggesting buyers interest in the stock, which could mean that the stock may gain momentum and may breakout of the resistance zone. EMA's are also in a PCO state , suggesting an uptrend.
Next week's price action could provide an insight into the stock's trend.
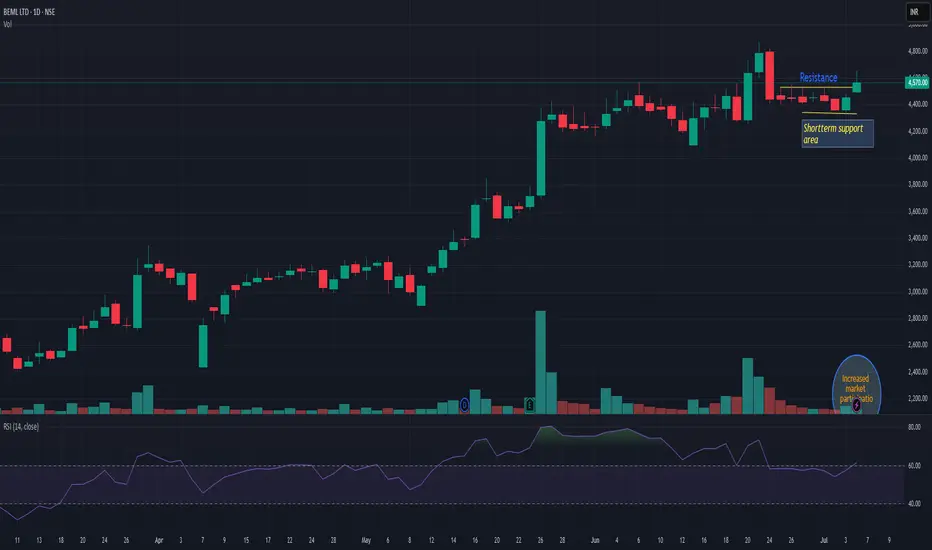
BEMLBEML is trading above resistance line with very decent volume. As long as it is trading above support line, momentum may continue. Recently fresh momentum has been observed on majority defense stock. If today it is closing above 4600 then we may see momentum for next 12-15%. Keep it on radar.
How to Trade ATH Stocks: Harness Explosive Trends with ADX !(BEL Case Study)
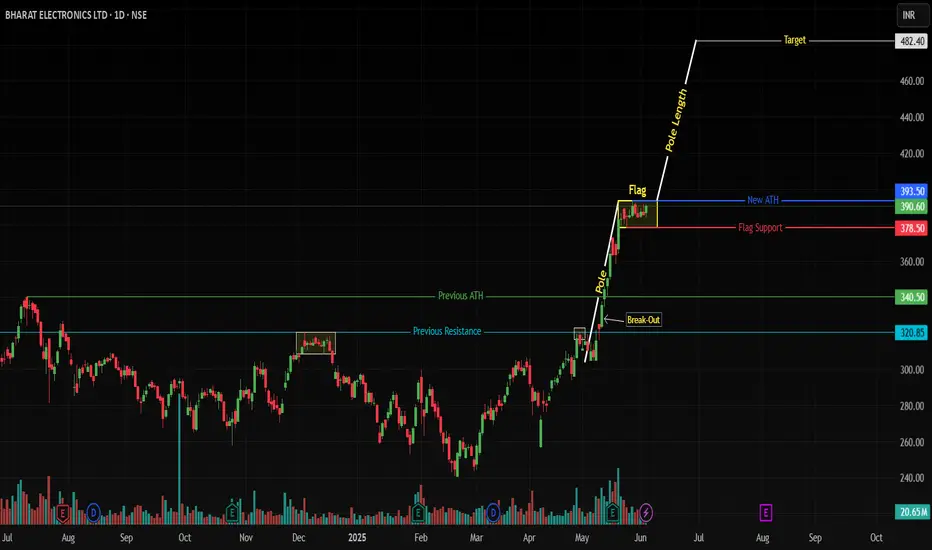
NSE:BEL (Daily) - Bull Flag at All-Time Highs
📈 Key Observations
ATH Breakout Confirmed:
Price smashed through ₹340.50 previos ATH, hitting a historic high of ₹393.50.
Consolidation in a tight bull flag (₹378.50–393.50) after a 28.97% surge – classic bullish continuation setup.
ADX: Your Trend Compass 🧭
ADX at 43.95 signals a powerful, directional trend (Readings >25 = strong trend; >40 = explosive momentum).
Ignore oscillator noise: Trends trump RSI/MACD in parabolic moves.
Pattern > Oscillators:
Bull Flag Priority: The pattern’s integrity (lower volume consolidation) outweighs short-term RSI(79)/MACD wobbles.
🚀 Trade Strategy: Trend-First Framework
✅ Entry & Targets
Trigger: Daily close above ₹393.50 (flag resistance).
Add: Retest of ₹393.50 as support.
Targets:
Short-term: ₹420 (5% above ATH)
Measured Move: ₹482 (ATH + pole height: 393.50 + 88.20)
⚔️ Stop-Loss
Conservative: ₹378.50 (flag low breach).
Aggressive: ₹385 (tight stop, honors consolidation structure).
📊 Position Sizing
Risk ≤1% capital per trade.
Reward/Risk Ratio: 4:1 (₹482 target vs. ₹378.50 stop).
💡 Why ADX Trumps RSI/MACD at ATHs
RSI/MACD are lagging in strong trends:
RSI overbought ≠ reversal – it’s fuel for momentum stocks.
MACD crosses often "whipsaw" in high-ADX environments (BEL’s ADX >40 invalidates bearish MACD signals).
ADX is proactive:
"Trends persist until ADX rolls below 30" – Focus on price, not oscillator fears.
🌐 Sector & Fundamental Tailwinds
Defense Sector Strength: India’s capex boost; BEL’s order book increasing.
Institutional Conviction: FIIs increasing stake.
🛡️ Risk Management Checklist
✅ Trade only on confirmed close above ATH.
✅ Use ADX >40 as a momentum green light.
✅ Trail stops at 20-DMA (₹365) once +10% profit.
Chart Markup:
Blue line: Bull flag Resistance at ₹393.50.
Red Line: Bull Flag Support ₹378.50
ADX(14) subchart with 40+ threshold highlighted.
💎 Final Thought: ATH breakouts are trend accelerators, not tops. BEL’s bull flag + ADX >40 frames a high-probability continuation play. Stick with the trend until ADX says otherwise.
Boost this idea if you’re tracking BEL’s breakout!
Follow for high-probability ATH trade setups.
⚠️ Disclaimer
"This is NOT financial advice. Trade at your own risk. Past performance ≠ future results. Always conduct independent research and consult a SEBI-registered advisor. The author holds no position in BEL at time of publication."
ROTOROTO is showing good strength and currently trading above previous resistance line. It is in to consolidation phase. It seems like accumulation has been observed in recent sessions. Now as long as it is closing above 279 then ROTO is very strong and available at very good risk-reward. One may expect 12% to 21% in next rally once it comes from consolidation phase.

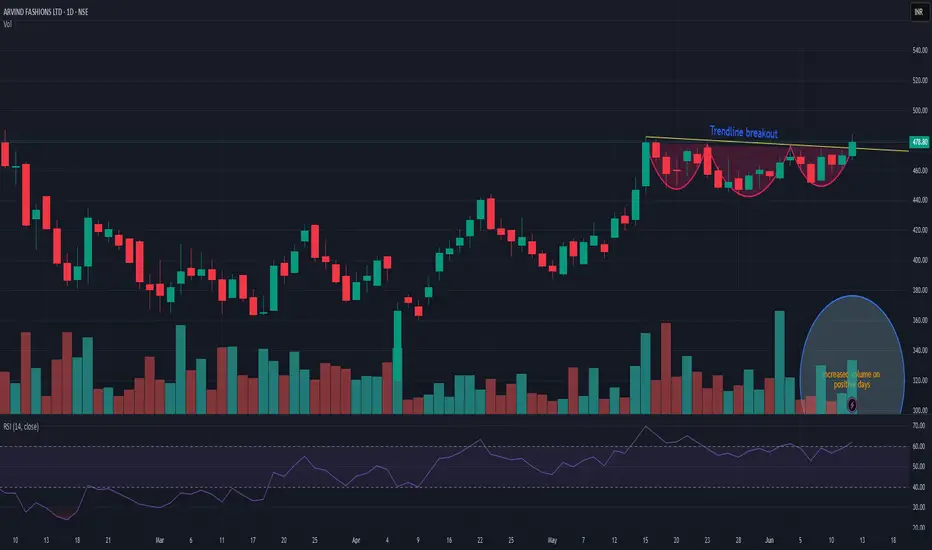
ARVINDFASNARVINDFASN showing very good strength on this negative days as well and currently trying to coming out of consolidation. As long as it is closing above 440 then dips are good to accumulate. Positive momentum may fetch the stock up to 600 in near term. And next trigger level can b above 485. Wait for the perfect entry point.
NOVAAGRINOVAAGRI giving classical VCP breakout. Recently given 2 times flag pattern breakout with high volume. And then again consolidation with dried volume. Today again formed a pole of flag with decent volume. Now as long as it is closing above resistance line which is around 51 then I think its good accumulation zone. Up side its open for large space! Track it closely.

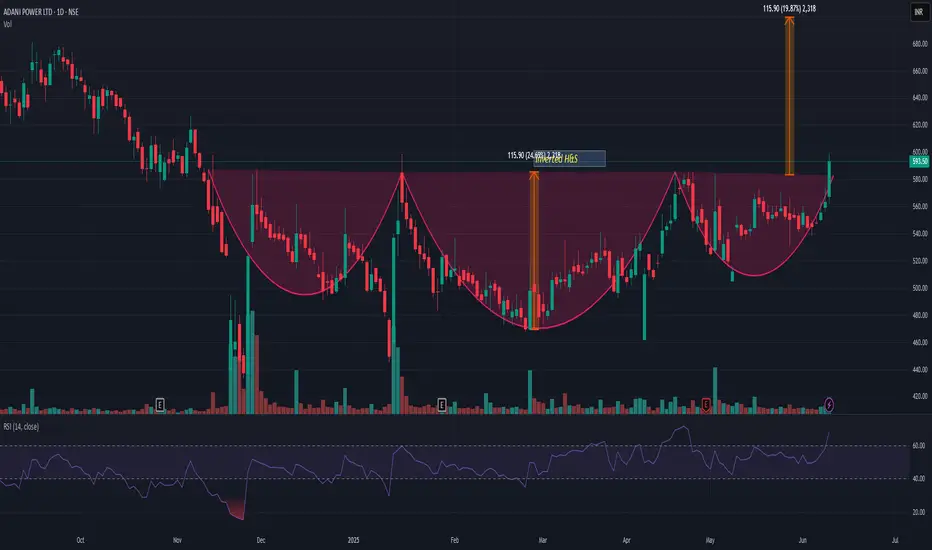
ADANIPOWERADANIPOWER has given inverted H&S breakout with very good volume. All ADANI stocks showing a strength. If we look at the pattern then it may add more 18-20% from here. My view may change we it closes below 540.
ETHOSLTDETHOSLTD has given breakout after so long and after many attempt. It may face bit resistance near 3050 level but once it crosses it may take a new ride. It has a potential to go up to 3500 and above that it may enter in to uncharted area. If I talk about fundamental event then on 12 june it will be split by 1:1. So after split we may see volume bounce as well which may lead to start a momentum rally. Now if I talk about long term chart ie weekly/monthly then on both format it is showing very good strength. I won't be surprised even if it trades above 4400 levels. My view will be changed if it goes below 2650.

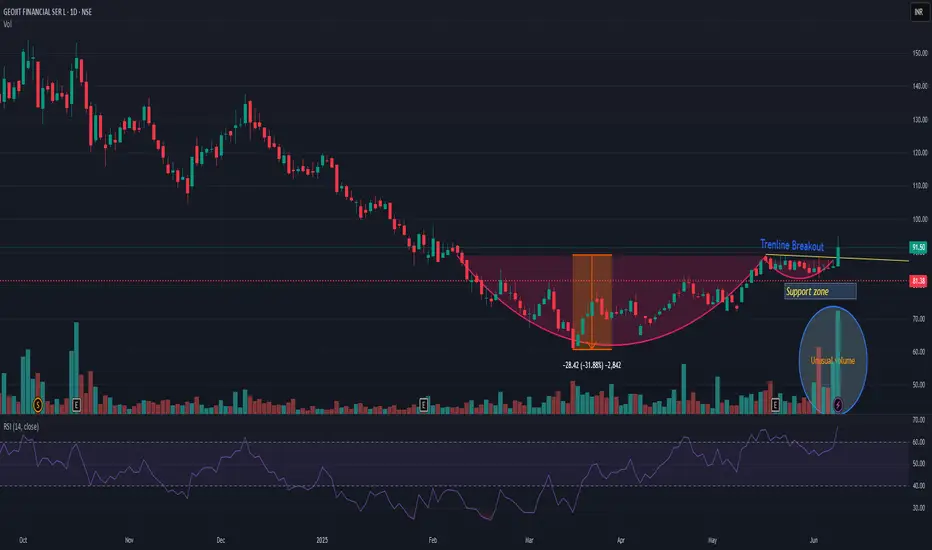
GEOJITFSLGEOJITFSL showing strength and has given short term breakout. Cup and handle pattern has also been observed. Now if I see pattern target then 25-30% up side is possible. Since September highest volume also observed today. My view will be changed if it closes below 81. Risk reward is quite in favor.
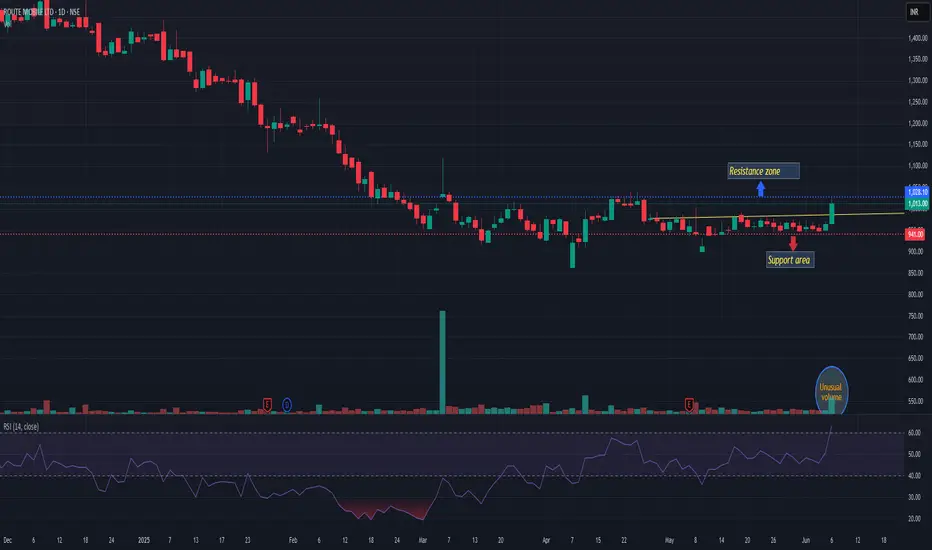
ROUTEROUTE is giving hint of reversal with unusual volume. And in mu opinion reversal will be confirmed only if it closes above 1030. If it confirmed then 15-17% from here may be possible. And if it closes below 930 may change my view. Today it is attempting to close above short term key moving averages. Keep a closer watch
Trend Continuation in SANATHAN TEXTILES LTDNSE:SANATHAN
Timeframe - 4H CHART 📊
Base after Breakout 📈
An early entry above - @473 will make Good good RR.
Stock is maintaining clear HH HL structure.
And Recent Down candles are on very low Volume signals sellers getting absorbed.
Keep on radar. ⏳
Keep Learning, Happy Trading.

HINDZINC HINDZINC has given trendline breakout with very good volume. On upperside it may face resistance near 540-45 level and lower side support can be seen near 455 levels. It has given breakout on weekly as well and seems momentum may continue. Risk reward is quite in favor.

DYCL STRONG BREAKOUT CANDIDATENSE:DYCL
Cable and WIre Industry Stock Good for Swing
#DYCL Strong Conviction - Increasing day by day.
Study the Price and Volume action closely.
Spikes are grabbing supplies from top and low volatility closing showing - accumulation.
Today price respected the previous day close and formed a higher high higher low structure.
All Major Levels are marked on chart.
Keep Learning,
Happy Trading.

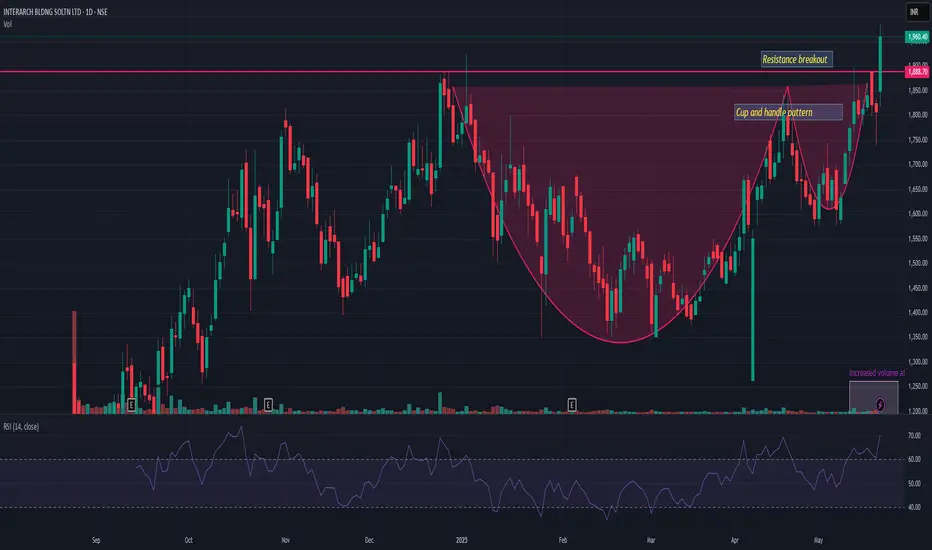
INTERARCHINTERARCH has given resistance breakout with decent volume. Posted very good result on both front QoQ and YoY. Cup and handle pattern also observed and given recent breakout of the same. Closing below 1750 may change the view. And on upper side pattern resistance may be possible near 2300. Looks very strong for momentum