ROTOROTO is showing good strength and currently trading above previous resistance line. It is in to consolidation phase. It seems like accumulation has been observed in recent sessions. Now as long as it is closing above 279 then ROTO is very strong and available at very good risk-reward. One may expect 12% to 21% in next rally once it comes from consolidation phase.
Momentumtrading

NOVAAGRINOVAAGRI giving classical VCP breakout. Recently given 2 times flag pattern breakout with high volume. And then again consolidation with dried volume. Today again formed a pole of flag with decent volume. Now as long as it is closing above resistance line which is around 51 then I think its good accumulation zone. Up side its open for large space! Track it closely.

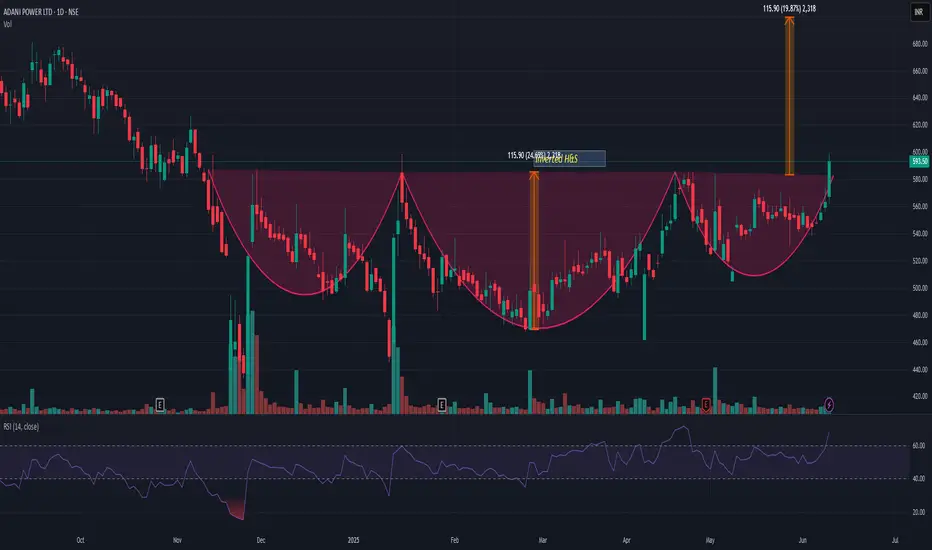
ADANIPOWERADANIPOWER has given inverted H&S breakout with very good volume. All ADANI stocks showing a strength. If we look at the pattern then it may add more 18-20% from here. My view may change we it closes below 540.
MACD + RSI Divergence Combo – The Deadly Entry Trick!Hello Traders!
In today’s educational post, we’ll break down one of the most powerful technical setups used by pro traders – the MACD + RSI Divergence Combo . When used together, these indicators don’t just show momentum — they reveal high-probability reversal zones. This setup can help you time perfect entries and avoid false breakouts or breakdowns.
Why Combine MACD and RSI Divergence?
MACD Divergence shows when the price is moving in one direction, but momentum is fading — a clear warning of potential reversal.
RSI Divergence helps confirm overbought/oversold conditions and adds strength to the reversal signal.
Combining Both gives double confirmation, increasing accuracy of entries with minimal lag.
How to Trade This Combo Setup
Step 1: Identify Divergence on MACD
Look for a higher high in price but a lower high on MACD (bearish divergence) or lower low in price with higher low on MACD (bullish divergence).
Step 2: Confirm with RSI Divergence
Now check if RSI also shows a similar divergence pattern. If yes — the setup is strong.
Step 3: Enter with Candle Confirmation
Wait for a strong reversal candle (like engulfing, hammer, or shooting star) before entering the trade.
Step 4: Place Stop-Loss
Place SL below recent swing low (for long) or above swing high (for short).
Step 5: Ride the Move with Trailing Stop
Use support/resistance or moving averages to trail your stop-loss and let profits run.
Rahul’s Tip
One divergence = a warning. Two divergences = a sniper entry!
This combo setup reduces noise and gives you clarity — especially during range-bound markets or weak trends.
Conclusion
The MACD + RSI Divergence Strategy is a reliable tool for spotting trend exhaustion and entering before the crowd. Combine this with proper candle confirmation and risk management, and you’ll have a deadly weapon in your trading toolkit!
Have you tried using this combo before? Drop your experience in the comments and let’s learn together!
If you found this post valuable, don't forget to LIKE and FOLLOW!
I regularly share real-world trading setups, actionable strategies, and learning-focused content — all from real trading experience, not theory. Stay connected if you're serious about growing as a trader!

Nicholas Darvas: The Dancer Who Became a Trading Legend!Hello Traders! Imagine going from being a professional dancer to one of the most successful traders of all time! That’s the story of Nicholas Darvas , a self-taught trader who turned $25,000 into $2.25 million in just a few years using his famous Darvas Box Trading Strategy . His journey proves that you don’t need to be a Wall Street expert to make it big in trading! Let’s dive into his trading principles and strategy.
1. Who Was Nicholas Darvas?
Darvas was a professional dancer who stumbled into the stock market while touring the world.
He developed a technical approach to trading , known as the Darvas Box Theory , which helped him ride strong trends and avoid noise.
Without any insider knowledge, he used chart patterns, price momentum, and volume breakouts to make millions in the market.
2. Darvas’ Key Trading Principles
Follow the Trend: Darvas only bought stocks in strong uptrends. He believed in riding momentum rather than predicting reversals.
Ignore Market Noise: He didn’t listen to news, tips, or opinions —only price action and volume mattered to him.
Let Winners Run, Cut Losers Quickly: He never sold his winning stocks early and immediately exited losing trades without hesitation.
Use Stop-Losses & Protect Capital: Darvas always set stop-losses below key levels to avoid deep losses.
Only Trade High-Volume Stocks: He focused on stocks that showed strong volume spikes, as these indicated institutional interest.
3. The Darvas Box Trading Strategy
Identify a Stock in a Strong Uptrend: Darvas looked for stocks that were consistently making new highs with rising volume.
Draw a "Box": He identified support and resistance levels , creating a box around price action.
Buy on Breakout: He entered only when price broke above the box’s resistance level, signaling a continuation of the uptrend.
Set a Stop-Loss: His stop-loss was placed just below the support level of the box.
Sell When the Trend Weakens: If price broke below the lower boundary of the box, he exited immediately.
4. What Traders Can Learn from Darvas
Price Action is King: You don’t need complex indicators— price and volume are enough.
Stick to Strong Stocks: Focus on high-momentum stocks rather than chasing random trades.
Discipline Beats Emotion: Trade with a clear system , don’t rely on market opinions.
Have a Risk Management Plan: Always use stop-losses and protect your capital.
Trend Trading Works: The best profits come from riding big trends—not predicting tops and bottoms.
Conclusion
Nicholas Darvas’ journey from a dancer to a millionaire trader proves that anyone can succeed in the stock market with the right strategy, discipline, and risk management. His box trading strategy is still used by traders today, helping them ride trends and maximize profits while minimizing risk.
Have you tried the Darvas Box strategy? Let’s discuss in the comments!

Momentum Trading vs. Value Investing: Which Strategy Suits You?Hello Traders!
Today, let’s break down two polar-opposite strategies: Momentum Trading and Value Investing . Both can be profitable, but they cater to vastly different mindsets. Let’s find your fit!
Momentum Trading: Ride the Trend
What It Does: Capitalizes on short-term price momentum and volatility.
Best For: Active traders who thrive on quick decisions and market noise.
Some Stocks Examples (Not a Buy or sell recommendation) :
Adani Ports (ADANIPORTS) (infrastructure momentum plays).
Tata Motors (TATAMOTORS) (EV sector volatility).
Pros:
Quick profits in trending markets.
Works well with technical indicators like RSI and MACD .
Cons:
High risk of false breakouts.
Requires constant monitoring.
Value Investing: Buy Low, Hold Long 🛡️
What It Does: Targets undervalued stocks with strong fundamentals.
Best For: Patient investors focused on long-term wealth.
Some Stocks Examples (Not a Buy or sell recommendation) :
HDFC Bank (HDFCBANK) (undervalued banking giant).
ITC (ITC) (FMCG stalwart with dividend history).
Pros:
Margin of safety with low P/E ratios .
Compounding returns over decades.
Cons:
Slow growth in sideways markets.
Requires deep fundamental analysis.
Which Strategy Wins?
Momentum Trading : Ideal for volatile markets (e.g., trading Nifty 50 breakouts).
Value Investing : Perfect for bear markets or undervalued sectors (e.g., PSU stocks).
Hybrid Approach : Use momentum for short-term gains and value picks as core holdings.
TradingView Tools to Try
For Momentum: Track volume spikes , Bollinger Bands , and trend lines .
For Value: Use fundamental screeners for ROE , debt-to-equity , and dividend history .
Final Takeaway
Momentum = Fast-paced, high-risk, high-reward.
Value = Slow and steady, low-risk compounding.
Your Turn!
Are you a momentum chaser, a value hunter, or a mix of both? Share your style below!

Mark Minervini: Master of Trend Following and Risk Management!Mark Minervini: Master of Trend Following and Stock Market Success
Hello everyone! Today, we’re diving into the world of Mark Minervini , a U.S. stock trader and author who has made a significant impact in the trading world. Known for his trend-following strategies and risk management mindset , Minervini is widely respected for his disciplined approach to the market.
Mark Minervini’s philosophy is built around timing the market right, managing risk, and investing in stocks with momentum . His success can be attributed to his ability to combine technical analysis , fundamental analysis , and strict risk management into a coherent strategy.
Mark Minervini’s Key Trading Principles
Buy High, Sell Higher: Minervini’s strategy is focused on buying stocks at breakout points , when they are moving above previous highs, signaling strong momentum and potential for larger gains.
Look for Stocks with Strong Fundamentals and Technicals: He believes in a balanced approach, using both fundamental analysis and technical indicators to identify stocks that have the potential to deliver strong returns.
The 90-90 Rule: Minervini’s 90-90 rule suggests that 90% of the time, the market moves with the top 10% performing stocks , and those top-performing stocks often deliver massive returns.
Cut Losses Quickly and Let Profits Run: A central principle of Minervini’s strategy is risk management . He advocates cutting losses quickly and letting profits run , ensuring that small losses don’t turn into bigger ones.
Risk Management Mindset: Mark Minervini stresses the importance of having a risk management mindset when trading. Managing risk is just as important as identifying profitable trades. He advises traders to always protect capital , as this is the foundation of long-term success in the market.
Stay Disciplined and Follow a System: Minervini’s success is rooted in his disciplined approach. He sticks to his rules and doesn’t deviate from his proven system, regardless of market fluctuations.
Mark Minervini’s Iconic Trades
✔ Stock Breakouts: Minervini made a fortune by buying stocks at breakout points where stocks are showing strong upward momentum.
✔ Growth Stocks in Bull Markets: He focuses on identifying high-growth stocks in strong bull markets, which consistently outperform the broader market.
✔ Precise Entry Points: Minervini does not just buy any stock but waits for specific technical patterns that suggest high-probability entry points.
What This Means for Traders:
By following Minervini’s principles, traders can:
Focus on high-performing stocks with upward momentum that break above key resistance levels.
Prioritize risk management and always be ready to cut losses to protect your capital.
Stay disciplined and follow a systematic approach that relies on precise entry points and controlled risk.
Leverage both technical and fundamental analysis to make smarter, more informed decisions.
Outcome:
Mark Minervini’s success is a result of his comprehensive approach to trading , which includes precise entry points, strong risk management, and a disciplined mindset. Traders who follow these principles can improve their results and take their trading to the next level.
What do you think of Mark Minervini’s trading approach ? Have you implemented any of his strategies in your own trades? Share your thoughts in the comments below!

Bank Nifty: Key Price Levels and Breakout Analysis for TomorrowBank Nifty Trading Idea - Key Zones to Watch
🔍 Overview:
Bank Nifty has shown strong momentum recently and is approaching critical levels. Here’s a breakdown of the key zones and potential scenarios.
⚡ Key Zones
1️⃣ Huge Resistance Zone (51,800–52,000)
This is a significant resistance area where sellers have historically dominated.
What to Watch:
If we get a perfect breakout above 52,000, the price may potentially move toward 52,324/52,526 levels in the short term.
Failing to break this level could result in a pullback to test lower zones.
2️⃣ Resistance Zone (51,600–51,700)
A minor resistance level where early signs of strength or rejection can be observed.
3️⃣ Support Zone (51,100–51,200)
This zone has been a reliable base for the ongoing rally.
What to Watch:
A pullback here could provide insights into whether the bullish trend is likely to continue.
4️⃣ Important Support Zone (50,500)
A deeper support zone, critical for maintaining the overall uptrend.
What to Watch:
A break below this level might signal a bearish shift.
📈 Momentum (MACD)
The MACD indicator is showing bullish momentum, with an upward trend and a positive histogram. This supports the chances of a continued rally unless we see a reversal signal.
💡 Trading Plan
Breakout Scenario:
A clean breakout above 52,000 could pave the way for targets near 52,324/52,526, supported by strong volume.
Pullback Scenario:
If the price pulls back to the support zone (51,100–51,200), monitor price action for signs of strength or weakness.
Reversal Scenario:
A breakdown below the important support zone (50,500) could indicate bearish momentum and deeper corrections.
If you liked this idea, hit like🚀 and follow us for more such educational content!
For other ideas, check out our profile @TraderRahulPal Don’t forget to follow us for daily insights and updates!
Disclaimer:
This analysis is for educational purposes only and not financial advice. Always conduct your own research or consult a financial advisor before making any decisions.

VBL : Breakout Candidate (1-3 Months)#VBL #breakout #swingtradesetup #swingtrading #breakoutstock #Momentumtrading
VBL : Swing Trade
>> Breakout candidate
>> Trending setup
>> Momentum Building up
>> Low Risk High Reward Trade
Swing Traders can lock profit at 10% and keep trailing
Pls Follow, Boost & comment if u like the setup or u want to discuss the setup
Disc : Charts share for learning purpose only not a Trade recommendation. Consult your Financial Advisor or do your own research before taking position in this.

EQUITAS BANK : Base Breakout Soon#EQUITASBNK #breakout #basebreakout #momentumtrading
EQUITAS BANK : Swing Trading
>> Base Breakout soon
>> Momentum Building up
>> Good Strength & Volume Rising
>> once breakout, Price can spike quickly towards 200 EMA (Blue Line). 200 EMA will act as a magnet for price.
Swing Traders can lock profit at 10% and keep trailing.
Pls Boost, comment & follow us if u like this Trade Idea.
Disc : Charts shared are for Learning purpose & not a Trade Recommendation. Consult your Financial Advisor and do your own analysis before taking position in it.

SERVOTECH : VCP Formation#servotech #vcppattern #breakout
SERVOTECH : Swing Pick
>> VCP formation Visible
>> Trending setup
>> Good Strength & Volume
>> Good Risk Reward
>> Early Entry can give 13%
>> Breakout can give u another 20%
Swing Traders can lock profit at 10% and keep trailing
Please give a Boost or comment if u r Liking the analysis & Learning from it. Keep showing ur Love by following
Disclaimer : This is not a Trade Recommendations & Charts/ stocks Mentioned are for Learning/Educational Purpose. Do your Own Analysis before Taking positions.

Double Bottom Reversal - Pullback TradePrice is oscillating in the critical area ( Point of control), presence of immediate resistances.
For upward movement, Price needs to close above 550.
This week price action is going to be crucial

IIFLSEC : Bounce Back from FVG#IIFLSEC #Threewhitesoldiers #fairvaluegap #momentumpick #Trendingstock
IIFL Securities : Swing Trade
>> Trending Setup
>> Stock in Uptrend
>> TWS & FVG Visible
>> Price Respecting FVG and showing Bounce back
>> Upside Potential upto 20%
>> Low PE Stock
Swing Traders can lock Profit at 10% and keep trailing.
If u Like the Analysis, Boost the Idea and Follow us
Disclaimer : Charts shared for Learning Purpose only, not a Trade Recommendation.

SMSPHARMA - long term chart analysis. Targets & way ahead.Long term chart Analysis of SMSPHARMA.
Momentum charts - Absolute & Relative Momentum
What can happen after Momentum charts indicate peak Momentum - explained with an example.
The strength of current trend explained.
Probable targets.

Nifty500 Analysis: Current state of the market & what to expect.Nifty500 is mainly used for analysing the Market breadth.
We look at the various phases of the market: Bullish, Bearish & Sideways,
We can understand how the Momentum charts give an early warning / indicator for a particular phase in the market.
Presently, the market has given a signal that the current Bullish phase is going to get weaker, but we are not yet Bearish.
The Bullishness is going to continue, but in a stock specific manner only.
I'm expecting a sideways market with a slight upward slope.
Thanks for tuning in.

Momentum Trading Picks - Alembic Pharma & Quess Corp.Alembic Pharma
The stock encountered several rejections around the 1,130 level, leading to a significant correction in price.
Eventually, it found support near the 460 level and began to climb upwards.
During this upward movement, a Bullish Pole & Flag pattern emerged in the stock price chart, suggesting a potential continuation of the trend.
Following a breakout, the price trended upwards with a minor pullback before recently achieving a breakthrough with strong volume support.
Quess Corp
The price had been trending upwards within a parallel channel until it broke below, leading to a correction.
After that, the stock underwent a consolidation phase before gradually moving upwards.
A reversal in the downtrend was indicated by the formation of an Inverted Head & Shoulder pattern during this period.
The recent strong breakout suggests that the price is poised to continue its upward movement.

NLCINDIA on breakout NLCINDIA gave breakout after long consolidation. upside 10-12% possible from 255

Stock to focus this weekThe price has successfully completed its cycle of expansion and compression.
And the price is trading in a small range during five trading sessions.
From these levels the price has a high tendency to move in either direction.
Keep an eye on this stock.
Disclaimer: This is my pre market analysis and my trading journal. Not a suggestion to buy or sell.

Price-Time Correlation: Through WavesPrice reflection through Waves
We all know that price does not moves in a straight line, it moves in waves. A graphical representation of price with respect to time always gives us a wavy structure. If you notice carefully, on any chart, these waves reflect different characteristics. Some will be longer and quicker than the others while some will be smaller and slow. The behavior of these waves could help us in identifying strength and weakness in price and hence rational decision making.
Waves Reflect Momentum
The quick or slow action of a wave with respect to time indicates its momentum. A longer wave in a small duration of time is said to have more momentum than a wave of same length in a larger time duration. It should be noted that in trading, momentum of a wave is a relative term. It means that momentum of one wave doesn't make much sense unless it is compared with the momentum of another wave(s). It is through this comparison that we can discover strength and weakness in price action.
Momentum or Human Behavior?
Please do remember that when I say strength and weakness, that means the strength and weakness of market participants. Ultimately it is the human action and psychology that is playing in the background. In the foreground what we see are the waves on Price and Time axis. So, a weaker up wave would mean that buyers were not very strong in that up move. Or a stronger down wave would mean that sellers were stronger in that wave and so on. This contrasting behavior may help us in understanding the market behavior more accurately and taking prudent trading decisions.
Also remember that Price-Time correlation does not focus on bottom picking but it provides additional confirmation that the correction/consolidation has been terminated and the larger trend has resumed. Secondly, while the market may behave differently in different geo-political environments, one should not expect identical outcomes all the time.
Let's go through the Example in Chart
Normally after a strong trend we see a correction/consolidation. A correction can be of any type but for the sake of simplicity I have taken the more popular 'abc' type structure.
Wave A
Very strong momentum up wave. Generally, very strong moves lead to consolidations.
Wave B
Strong momentum corrective wave
Wave C
🚀Momentum is weaker than both waves A and B.
🚀From A to B, the price corrected in one go whereas C is a 3-wave sub structure in itself.
🚀Also, C took more time compared to B but could not reach the high of A.
Inference- Buyers are not very strong at this stage so not a very good place for fresh buyers.
Wave D
🚀Momentum is even weaker than C.
🚀5-wave sub structure and huge time taken by the wave to reach the low of B reflects that sellers were not strong enough to push the market down.
Inference- Buyers could try for a low-risk trade.
Wave E
🚀Price breached the high of C and A in a smaller duration of time. So huge momentum.
Inference- Good to keep holding long positions and for fresh entry into small pullbacks.
For measuring time one can count the number of candles in a wave with the help of DateRange tool provided in ForecastingandMeasurementTools Tab on the left pane of Tradingview chart page OR sometimes simply eyeballing a chart would serve the purpose.
Disclaimer: This is a very simple but strong concept, and I am not the sole follower or proponent of it.
Hope it added to your knowledge. Do hit the 🚀 button and share your experiences regarding momentum trading in the comment 💬 section below.
Thanks.

POWERGRID : VCP Breakout#POWERGRID #vcpbreakout #VCPpattern #breakout #swingtrade #momentumtrade
Power Grid : Swing Trade
>> VCP Breakout
>> Trending Stock
>> Good Strength & Volume
>> Low Risk & High Reward
Swing Trader can lock profit at 10% and keep trailing
Please give a Boost or comment if u r Liking the analysis & Learning from it. Keep showing ur Love by following
Disclaimer : This is not a Trade Recommendations & Charts/ stocks Mentioned are for Learning/Educational Purpose. Do your Own Analysis before Taking positions.

Bhageria : VCP Breakout#Bhageria #VCPbreakout #momentumtrade #swingtrade
Bhageria Industries : VCP breakout
>> bottomed out stock
>> Breakout with Volume
>> Good Strength & volumes
>> Low Risk High Reward Trade
Swing traders ca lock profit at 10% and keep trailing
Please give a Boost or comment if u r Liking the analysis & Learning from it. Keep showing ur Love by following
Disclaimer : This is not a Trade Recommendations & Charts/ stocks Mentioned are for Learning/Educational Purpose. Do your Own Analysis before Taking positions.

MSTC READY FOR 40% GAINBuy MSTC 360 till 340 for 400,440,480. Keep stop below 320 on weekly closing basis. Fantastic VCP pattern emerging

PALREDTEC (weekly chart) - (1-3 Months)#PALREDTEC #breakoutcandidate #vcppattern #swingtrade #momentumtrade
PALREDTEC : Holding Period 1-3 Months
>> Breakout Candidate
>> Beautiful VCP pattern
>> Volumes Building up
>> Good Strength in stock
>> Low Risk High Reward Trade
Swing Traders can lock 10% profit & keep trailing
Please give a Boost or comment if u r Liking the analysis & Learning from it. Keep showing ur Love by following
Disclaimer : This is not a Trade Recommendations & Charts/ stocks Mentioned are for Learning/Educational Purpose. Do your Own Analysis before Taking positions.
