A Bounce in Nifty but... In the market, it doesn’t work like — “The market has fallen enough, so now it should go up.” Even worse is putting your money into trades just because you feel that way.
Markets fall because of fear, and overcoming fear takes time. In fact, fear often grows stronger before it fades.
That’s exactly what is happening right now.
So don’t trade with the mindset — “The market has dropped a lot, it should rise now.”
Use this time to identify setups that have already broken out and are now giving a retest or have completed one.
For now, just build your watchlist. Trade only when you see stopping volume or a pivot low forming.
Remember — Markets are driven by people. And people trade based on either Fear or Greed. Their fear has no bottom, and greed has no top.
Be patient. I’m sure you will get much better opportunities soon.
That said, a bounce can still be expected because the heaviest sector from the last rally — Defence — is now showing mean reversion.
Talking about #Nifty,
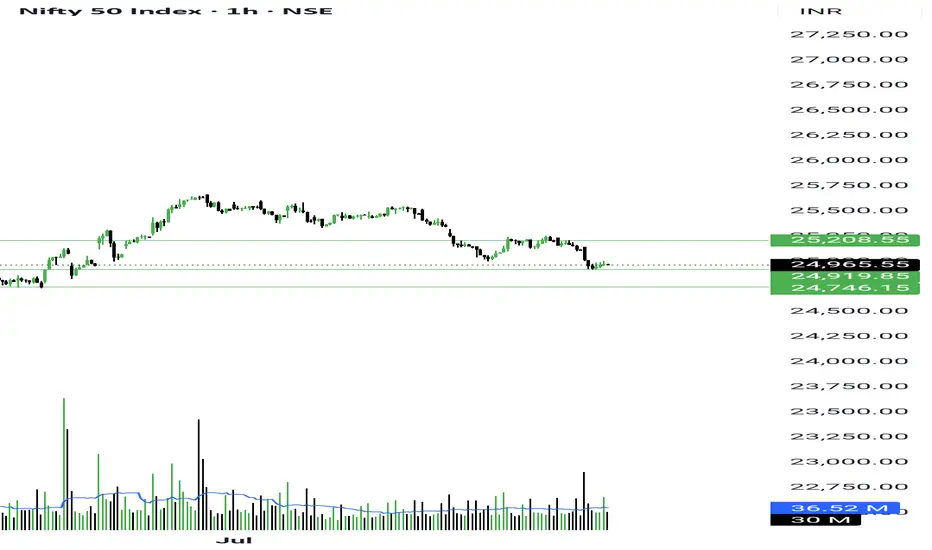
On Friday, it formed a Reversion Candle. Interestingly, seller volume was 40 million lower than Thursday’s candle.
A big candle with such low volume usually signals accumulation — which means smart money has started buying.
Since it’s earnings season, our focus will remain on the Earnings Pivot strategy.
NSE:NIFTY levels:
- Support - 24920. Good if consolidate here for 1-2 days.
- Resistance: 25150 — above this, strong short covering can push it to 25400
But I doubt if this bounce will be buyable yet because next week is monthly expiry. Bears may close their shorts, so the market might just move up to grab short-side liquidity around 25333.
However, if we get a monthly close above 25333, that will be a strong bullish sign.
NSE:BANKNIFTY levels:
- Support: 55950
- Resistance: 56750
Sector-wise, NSE:CNXPHARMA and NSE:CNXFINANCE are showing traction.
Still, I strongly suggest sticking to stocks with Earnings Pivot setups.
In this market, that’s the safest strategy.
My this week's trades:
NSE:IXIGO - BOOKED ON UPPER-CIRCUIT
NSE:EIEL - 12% BOOKED
NSE:GARUDA - 19.5% BOOKED
NSE:DENTA - 18% BOOKED
NSE:CUPID - - 23% AND HOLDING
NSE:SPORTKING - 16% AND HOLDING
That’s all for now.
Take care.
Have a profitable week ahead.
Niftyfinancialservices
NIFTY FINANCE H4, THERE'S POSSIBLITY OF SHORT THINGS FOUND
-T-LINE Breakdown & Retest
-Pending Liquidity
-Upside liquidity sweeped today
- HUGE GAP DOWN SIDE EXPECTED TO FILLED
TLL THEN , STAY FOCUSED

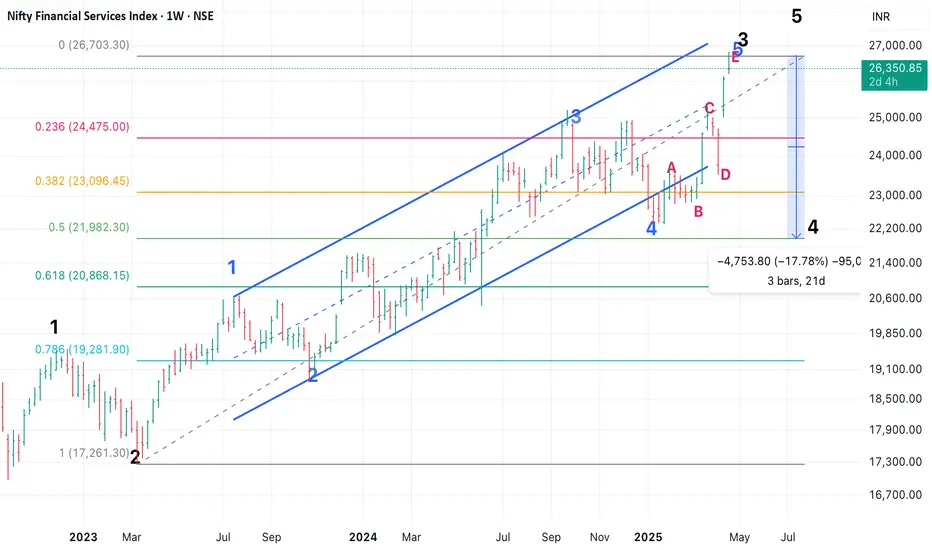
Nifty Financial Services - EW Analysis - Good RR ShortNifty Financial Services showed resilience in the entire fall and led the way up in recovery as it had a 5 of 3 up (from March 23 lows) pending, which got done in Nifty and most other indices in Dec 2023.
Now it has completed that 4 and should lead on the way down. Expecting at least a 14% correction in index till 23150 (38.2% retracement). Next target will be 22020 (50% retracement).
My bet is on 50% retracement, as Bajaj Twins and HDFC Bank and ICICI Bank have completed a corrective bounce and should test/ break recent lows.
Bajaj Twins have much larger correction possibility. Will share in other posts.
Nifty Finance Fuels Market Recovery with 5% Weekly Leap◉ Nifty Finance Sector Outlook NSE:CNXFINANCE
● The finance sector is exhibiting a bullish trend, with the Nifty Financial Services Index gaining over 5% in the past week.
● The index is currently moving within a rising parallel channel, having rebounded strongly from its trendline support.
● It is now approaching a key resistance zone, and a decisive breakout above this level could signal further upward momentum.
● For the uptrend to sustain, the index must breach and hold above this resistance.
Here’s a look at some promising stocks from the sector that could see potential upside:
◉ ICICI Bank NSE:ICICIBANK
● The stock has mirrored the index's pattern, displaying strong bullish momentum.
● It is currently trading just below its all-time high, with the potential to break through and set new records.
● Increasing trading volumes further reinforce the bullish sentiment, indicating strong buyer interest.
◉ Kotak Mahindra Bank NSE:KOTAKBANK
● After a prolonged consolidation phase, the stock has broken out of a downward-trending parallel channel.
● This breakout positions the stock for further upside movement, marking a potential shift in its trend.
◉ Bajaj Finance NSE:BAJFINANCE
● The stock has been in an extended consolidation phase, forming an Ascending Triangle pattern.
● Following a successful breakout from this pattern, the stock has shown resilience and is now poised for an upward move.

CNXFINANCE-Nifty Financial Services - Long -Cup and Handle DailyCNXFINANCE
Technical analysis of the Nifty Financial Services Index (CNXFINANCE) on a daily time frame, using candlesticks to show price movement.
Here’s a breakdown of the key elements:
Cup and Handle Pattern: The chart highlight a "cup and handle" formation, which is a bullish continuation pattern. The cup is seen as the rounded bottom part of the formation, followed by a small handle that tends to consolidate before a breakout.
Breakout Level: The breakout point is marked at 23,917.55, and the price has successfully broken above this level, now trading around 24,326.90, suggesting bullish momentum.
Target Levels:
The first target appears to be 25,329.60, as per the measured move from the height of the cup.
The calculation shows a 6.27% increase from the breakout level, projecting this target.
Support Levels:
Price Action: The candlestick shows a strong bullish move, and the index is testing higher levels, suggesting that the momentum could take it towards the 25,329.60 target.
in.tradingview.com
SCRIPTS
AU SMALL FINANCE BANK
AXIS BANK
BAJAJ FINANCE
BAJAJ FINSERV
CHOLAMANDALAM INVEST
HDFC AMC
HDFC BANK
HDFC LIFE INSURANCE
ICICI BANK
ICICI LOMBARD GENERAL INSURANCE
ICICI PRUDENTIAL LIFE INSURANCE
INDIAN ENERGY EXCHANGE
KOTAK MAHINDRA BANK
LIC HOUSING
MUTHOOT FINANCE
POWER FINANCE CORPORATION
REC
SBI
SBI CARDS
SBI LIFE INSURANCE

LICI FOR SHORT My view on this script Bearish.
Target 1 :979
Target 2:966
Stoploss:1010
#Niftyfinance #Lifeinsurancecorporationofindia

BAJAJFINSERV LIMITED FOR LONGMy view on this script is bullish.
It has potential to Reversal from this zone.
Target 1=1619(1:1)
Target 2=1632(1:2)
Stoploss=1593

nifty finserviceslong only after the closing of 15 min. candle above 19920...
Educational purpose only..

NIFTYFINANCE weekly line chartIn the current senerio most of the twitter & youtube channel is worry to the correction and they show bear market start; but the price line chart show this is the only pullback; if you are wating for opportunity this is the time to buy the stock

Finnifty Support & Resistance Levels with Confirm Target Support and Resistance Zones For Finnifty Intraday Trading
Support Zones For Finnifty Intraday Trading
First Support Zone For Finnifty –19180-19193
Second Support Zone For Finnifty – 19150 -19160
Third Support Zone For Finnifty – 19078 -19087
Resistance Zones For Finnifty Intraday Trading
First Resistance Zone For Nifty Financial Services – 19252 - 19262
Second Resistance Zone For Nifty Financial Services – 19313 - 19325
Third Resistance Zone For Nifty Financial Services – 19413 - 19425
Importent Signal from finnifty Option Chain Analysis
PCR ratio as per Option Chain Analysis – 0.65 ( Bearish )
Major Support as Per finnifty Open Interest Analysis – 19200
Major Resistance as Per finnifty Open Interest Analysis – 19400

Simple Trade Setup | FINNIFTY | 11/10/2022 [INTRADAY]NSE:CNXFINANCE
Trade Setup for 11-10-2022
1) Don't Jump in to trade at the beginning of the market. Let it get settle for 15-20min first and judge the price action.
2) Everything is mentioned on the chart. I hope it is easy to understand.
3) All the levels will work as support, resistance, entry and exit w.r.t price action near that level.
4) Avoid gap up or gap down chase. Wait and trade between levels.
Please refer below chart for levels.
Hope I made it easy to understand it.
Do comment your doubt or suggestion.
Note: Trade with Strict SL. It may or may not hit all the levels. So one can book profit / loss at respective level considering how price action works near that level.

Simple Trade Setup | FINNIFTY | 04-10-2022 (EXPIRY) [INTRADAY ] NSE:CNXFINANCE
Observations:
1) On 15 min TF we can see a trendline.
Please refer below chart : 15min time frame.
-------------------------------------
Trade Setup for 04-10-2022
1) Don't Jump in to trade at the beginning of the market. Let it get settle for 15-20min first and judge the price action.
2) Everything is mentioned on the chart. I hope it is easy to understand.
3) All the levels will work as support, resistance, entry and exit w.r.t price action near that level.
4) Avoid gap up or gap down chase. Wait and trade between levels.
Please refer below chart for levels.
Hope I made it easy to understand it.
Do comment your doubt or suggestion.
Note: Trade with Strict SL. It may or may not hit all the levels. So one can book profit / loss at respective level considering how price action works near that level.

REC LTD - BULLISH ENGULFING 📊 Script: RECLTD (REC LIMITED)
📊 Nifty50 Stock: NO
📊 Sectoral Index: NIFTY FINANCIAL SERVICES / NIFTY MIDCAP 50
📊 Sector: Financial Services
📊 Industry: Finance Institution
Key highlights: 💡⚡
📈 Script is trading towards upper band of Bollinger band (BB).
📈 Already crossover in MACD .
📈 Already Crossover in Double Moving Averages.
📈 Double candlestick pattern BULLISH ENGULFING seen which indicate Bullishness in stock.
📈 Right now RSI is around 70.
📈 One can go for Swing Trade.
⏱️ C.M.P 📑💰- 105.45
🟢 Target 🎯🏆 - 114/117
⚠️ Stoploss ☠️🚫 - 100
⚠️ Important: Always maintain your Risk & Reward Ratio.
✅Like and follow to never miss a new idea!✅
Disclaimer: I am not SEBI Registered Advisor. My posts are purely for training and educational purposes.
Eat🍜 Sleep😴 TradingView📈 Repeat🔁
Happy learning with trading. Cheers!🥂

#manappuramFinance support NSE:MANAPPURAM
📌 To Trade on This Chart, You Should Have Reversal Trading Knowledge. As Harmonic is One Of The Best Reversal Trading Strategy, But Always Remember That Harmonic Patterns Also Can Fail (there is no holly grail In Stock Market). That's Why One Should Must Have Knowledge Of Reversal Trading To Trade On Harmonic Patterns.
📌 That Dash Line Is Called PRZ, From That Dash Line To that Horizontal Simple Line Area Is Whole PRZ(Price Reversal Zone).
📌 As One can see, This Pattern has Been Made on Extended levels, that's why stop loss quite big as per this pattern. So wait for perfect reversal first then only go for long and ones enter in trade then strictly follow stop loss and here as per my own experience one should keep Stop Loss as closing basis.
(PRZ :- Potential Reversal Zone, SL :- Stop Loss, TF :- Time Frame)
PRZ 1 :- 139.55
SL :- 122 (Closing Basis)
Target 1:- 148
Target 2:- 154
Target 3:- 161 and more Trailing basis
Note:- As Per this harmonic pattern , stop loss is quite big, so Trade on reversal only if you don’t know what is reversal, Kindly note that and ask in live session so next time you could be able to identify reversal by your self. Even ask doubts in comments, below.
******whatever charts or levels sharing here or on any other platforms are just for educational purpose only, Not A Recommendation To Buy Or Sell. Please do your own analysis before taking any trade on them. We are not SEBI registered.

AB Capital | Flag BO | Golden Cross Over | 25%-50% PotentialNSE:ABCAPITAL
Flag Breakout CMP > 112
Tgt : 140 -148 - 168 - 192
SL : 99
Potential : 25% - 50%
Golden Cross Over and RSI > 58 on Weekly Charts

📊 #coromandel INTL swing opportunity NSE:COROMANDEL
coromandel intl share at support so stop loss would be small. This can be a good swing trade opportunity. Trade as per your trade setup.
******whatever charts or levels sharing here are just for educational purpose only, not a recommendation. Please do your own analysis before taking any trade on them. We are not SEBI registered.

📊 #muthootfin Flag & PollNSE:MUTHOOTFIN
Flag & Poll breakout, target can b big stop loss as per your risk appetite.
******whatever charts or levels sharing here are just for educational purpose only not a recommendation. please do your own analysis before taking any trade on them. we are not SEBI registered.

📊 #banknifty intraday levels for 6-07-2021NSE:BANKNIFTY
📊 Each levels Act as support and resistance📈📉. one can trade on 3min, 5min and 15 min as per their trade set up. for reference one can check our old published ideas.
if any candle taking support from any level then try to identify that is that reversal candle at support or what if that is reversal candle then go long above that reversal candle and stop loss can be below that support line or that reversal candle's low whichever lower, same way if any candle getting resistance from any resistance level and if one can find reversal candle for short over there then one can short below that candle and stop loss can be that resistance line or that reversal candle's high whichever higher. even one use their own trade setup with these levels. everyday levels are different and same way the candles which gonna be formed on support or resistance can be different so cant say here perfect numbers to buy or sell or stop loss . hope one can understand that better to trade with own wisdom in live market even check future chart as well for better profitable trade.
Be independent trader
take charge of your own trades
Learn . Apply . Grow
******whatever charts or levels sharing here are just for educational purpose only not a recommendation. please do your own analysis before taking any trade on them. we are not SEBI registered.

📊 #nifty #nifty50 intraday levels for 6th July 21NSE:NIFTY
📊 Each levels Act as support and resistance📈📉. one can trade on 3min, 5min and 15 min as per their trade set up. for reference one can check our old published ideas.
if any candle taking support from any level then try to identify that is that reversal candle at support or what if that is reversal candle then go long above that reversal candle and stop loss can be below that support line or that reversal candle's low whichever lower, same way if any candle getting resistance from any resistance level and if one can find reversal candle for short over there then one can short below that candle and stop loss can be that resistance line or that reversal candle's high whichever higher. even one use their own trade setup with these levels. everyday levels are different and same way the candles which gonna be formed on support or resistance can be different so cant say here perfect numbers to buy or sell or stop loss . hope one can understand that better to trade with own wisdom in live market even check future chart as well for better profitable trade.
Be independent trader
take charge of your own trades
Learn . Apply . Grow
******whatever charts or levels sharing here are just for educational purpose only not a recommendation. please do your own analysis before taking any trade on them. we are not SEBI registered.

📊 #chilafin At Harmonic PRZNSE:CHOLAFIN
If u follow me since long then you must know now that Harmonic is all about reversal trading strategy and by help of this strategy you can find most accurate top and bottoms of any swing on ant time frame. and if you follow me since long then you must even know that we have shared many mind-blowing swing trades.
And as I said Harmonic is purely reversal trading strategy so you should have knowledge of reversal trading if you wanna trade on our Harmonic charts.
some times we might not get reversal at PRZ levels as you know there is no 100% strategy in Stock market but at that time you have to follow proper risk management and positioning and sizing so you can save your hard earned money from major losses.
To trade on this chart you must have knowledge of perfect reversal then only trade on our charts else take just take this chart as educational purpose only.
as we can see in chart that there are two harmonic patterns are there. and here we have to follow closing basis stop loss of second pattern.
so if we consider all PRZ here then from 507 to 491 Zone is your reversal zone her and if find reversal in this zone then one can trade with given stop loss which comes at 482 Closing Basis.
Be independent trader.
Take charge of your own Trades.
Learn . Apply . Grow
******whatever charts or levels sharing here are just for educational purpose only not a recommendation. please do your own analysis before taking any trade on them. we are not SEBI registered.

BO in IBULHSGFIN.There is an Ascending Triangle Pattern Breakout given by IBULHSGFIN on this Friday on weekly chart. So, I think we can see more upside levels on this counter.
First Targets :- 310
Second Target :- 360
Third Target :- 425
Stop loss as per risk appetite. Support is around 220.00

🔰 CholaFin | Amazing Parallel channel🔰 MY thought process :
⭐Amazing channel pattern, as historic data says: it comes to this trend line ( supportive one ) takes support and goes back to top one :)
⭐Buy low - Sell high type strategy it is :) well if it breakouts the channel that's a bonus:: hold a little more :)
⭐Risk: below the previous candle low and TGT 1 can be top of the channel.
🔰Am I taking this trade now: No---Reason: Already in the trades of Naukri and PPL as posted last time :) also took a small position in Coal India today as posted guys :)
Also keeping an eye on JSW steel too seems bullish to me :) , All the analysis already posted :)
🔰 {Some info}
➼My name is Apoorv and I am a 2nd year Engineering student, I want to pursue trading as my career, and thus whatsoever setups or trades I potentially see on my charting platform, I post it here and share them with you all.
➼I hope you will love my simple analysis style.
➼Feel free to suggest your view on this as learning is earning here :)
➼I take my trades on my Zerodha account :)
➼These charts are my and only my work, my thought process, just from an educational point of view and no calls.
<<<<<>>>>>

Bajaj Finance | On demand of follower :) 🔰 MY thought process :
⭐ Well As nifty touching ATM once again so we can also see a good move in BJFin too, but instead it produced an evening star on the D chart = bearish sign, that too at resistance, Q is will that make it bearish = yep but only intraday basis, and that would be against the trend trade wrt overall market sentiments :), so I would not touch BJfin until it breaks through the lvl of 5834 or gives a breakaway GAP above that lvl = super bullish sign.
⭐It has taken support from the right place and gave a break of the trendline on Day chart = further up move also it retested its move = a smooth entry there too, now it is consolidating in a range :) which is good for us, as soon as the box breaks for above the trade is initiated.
⭐Which TF, well 1hr or 30mins would be better, patience is always better, but if your RR ratio is better on smaller TF then go for it :) as per your risk management system :)
⭐It's a good one I myself will keep an eye on this :) thanks for bringing this up mate :)
🔰Am I taking this trade now: No---Reason: Already in the trades of Naukri and PPL as posted last time :) also took a small position in Coal India today as posted guys :)
🔰 {Some info}
➼My name is Apoorv and I am a 2nd year Engineering student, I want to pursue trading as my career, and thus whatsoever setups or trades I potentially see on my charting platform, I post it here and share them with you all.
➼I hope you will love my simple analysis style.
➼Feel free to suggest your view on this as learning is earning here :)
➼I take my trades on my Zerodha account :)
➼These charts are my and only my work, my thought process, just from an educational point of view and no calls.
<<<<<>>>>>
