NIFTY : Detailed Intraday Trading Plan | 30-Jan-2026
(Timeframe: 15-Min | Index: NIFTY 50 | Options Friendly)
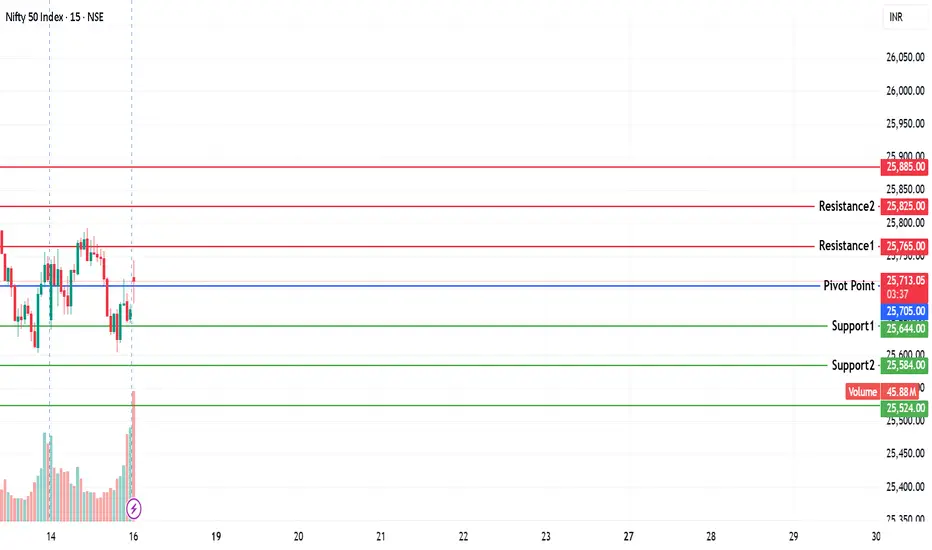
🔑 Key Reference Levels (From Chart)
🔸 25,670 – Last Intraday Resistance (Major Supply Zone)
🔸 25,509 – 25,564 – Opening Resistance / Support Zone (Decision Area)
🔸 25,382 – 25,384 – Immediate Opening Support
🔸 25,273 – Gap-Down Opening Support
🔸 25,162 – Last Intraday Support (Demand Zone)
🧠 Market Context & Psychology
NIFTY has shown strong recovery with higher highs and higher lows, indicating bullish intent. However, price is approaching important intraday resistance zones, where profit booking and fresh selling pressure can emerge.
👉 Hence, reaction at opening zones will decide the day’s direction.
🚀 Scenario 1: GAP UP Opening (100+ Points)
(Opening above ~25,520–25,550)
🔹 Market Psychology
A big gap up shows overnight bullish sentiment, but smart money often waits near resistance to test buyers’ strength.
🔹 Trading Plan
🟢 If price holds above 25,550 on 15-min closing:
🟢 Expect trend continuation towards 25,670
🟢 Look for Call buying / Bull Call Spread
🔻 If price fails to sustain above 25,550:
🔻 Expect gap-fill or pullback towards 25,500 – 25,382
🔻 Avoid chasing calls at open
🔹 Why this works
🧠 Gap-up buyers are emotional; institutions wait for acceptance above resistance before pushing higher.
➖ Scenario 2: FLAT Opening
(Opening between 25,450 – 25,520)
🔹 Market Psychology
Flat opening indicates indecision. Market will first hunt liquidity on either side.
🔹 Trading Plan
🟢 Above 25,509–25,564 zone with volume:
🟢 Bias turns bullish → Targets 25,670
🟢 Prefer Call spreads or scalping calls
🔻 Below 25,382 support on 15-min close:
🔻 Expect short-term weakness towards 25,273
🔻 Consider Put buying / Bear Put Spread
🔹 Why this works
🧠 Flat opens usually expand after support or resistance breakdown — patience gives better risk-reward.
🔻 Scenario 3: GAP DOWN Opening (100+ Points)
(Opening near or below ~25,273)
🔹 Market Psychology
Gap down triggers panic selling, but strong supports attract dip buyers.
🔹 Trading Plan
🟢 If 25,273 holds with rejection wicks:
🟢 Expect mean reversion bounce towards 25,382 – 25,509
🟢 Suitable for short-covering trades
🔻 If 25,273 breaks decisively:
🔻 Downside opens till 25,162
🔻 Favor Put buying with strict SL
🔹 Why this works
🧠 Big supports are watched by institutions; breakdown confirms supply dominance.
🛡️ Risk Management Tips for Options Traders
🟢 Trade only after first 15-min candle closes
🟢 Avoid over-trading near opening volatility
🟢 Use spreads instead of naked buying in high VIX
🟢 Risk max 1–2% capital per trade
🟢 Book partial profits near resistance/support levels
🟢 Avoid revenge trades ❌
🧾 Summary & Conclusion
📌 NIFTY remains structurally bullish, but approaching critical resistance zones
📌 Opening behavior around 25,509–25,564 will be the key trigger
📌 Trade reaction, not prediction
📌 Focus on price acceptance and 15-min confirmation
👉 Discipline + Patience = Consistency 💪📈
⚠️ Disclaimer
This analysis is for educational purposes only.
I am not a SEBI registered analyst.
Please consult your financial advisor before taking any trade.
Trading in the stock market involves risk.
Niftyoutlook

NIFTY KEY LEVELS FOR 30.01.2026NIFTY KEY LEVELS FOR 30.01.2026
Timeframe: 3 Minutes
If the candle stays above the pivot point, it is considered a bullish bias; if it remains below, it indicates a bearish bias. Price may reverse near Resistance 1 or Support 1. If it moves further, the next potential reversal zone is near Resistance 2 or Support 2. If these levels are also broken, we can expect the trend.
When a support or resistance level is broken, it often reverses its role; a broken resistance becomes the new support, and a broken support becomes the new resistance.
If the range(R2-S2) is narrow, the market may become volatile or trend strongly. If the range is wide, the market is more likely to remain sideways
please like and share my idea if you find it helpful
📢 Disclaimer
I am not a SEBI-registered financial adviser.
The information, views, and ideas shared here are purely for educational and informational purposes only. They are not intended as investment advice or a recommendation to buy, sell, or hold any financial instruments.
Please consult with your SEBI-registered financial advisor before making any trading or investment decisions.
Trading and investing in the stock market involves risk, and you should do your own research and analysis. You are solely responsible for any decisions made based on this research.

NIFTY KEY LEVELS FOR 29.01.2026NIFTY KEY LEVELS FOR 29.01.2026
Timeframe: 3 Minutes
If the candle stays above the pivot point, it is considered a bullish bias; if it remains below, it indicates a bearish bias. Price may reverse near Resistance 1 or Support 1. If it moves further, the next potential reversal zone is near Resistance 2 or Support 2. If these levels are also broken, we can expect the trend.
When a support or resistance level is broken, it often reverses its role; a broken resistance becomes the new support, and a broken support becomes the new resistance.
If the range(R2-S2) is narrow, the market may become volatile or trend strongly. If the range is wide, the market is more likely to remain sideways
please like and share my idea if you find it helpful
📢 Disclaimer
I am not a SEBI-registered financial adviser.
The information, views, and ideas shared here are purely for educational and informational purposes only. They are not intended as investment advice or a recommendation to buy, sell, or hold any financial instruments.
Please consult with your SEBI-registered financial advisor before making any trading or investment decisions.
Trading and investing in the stock market involves risk, and you should do your own research and analysis. You are solely responsible for any decisions made based on this research.

Market Outlook & Trade Setup – Friday, 30th January 2025Major indices showed a sharp recovery yesterday and even crossed the opening day high. Silver and Gold has corrected by more than 6% overnight so some selling pressure could be seen.
We have the Budget on Sunday, 1st Feb, 2026, so heavy positions might not be build in the market today.
🔹 NIFTY
* Previous Close: 25,418
* Expected Range: 25,000 – 25,500
🔹 SENSEX
* Previous Close: 82,566
* Expected Range: 82,500 - 82,600
🌍 Global & Market Sentiment
* DJIA: +55 | S&P: -9
💰 Institutional Activity (Cash Market)
* FII: Net Sellers: - ₹ 394 Cr
* DII: Net Buyers: + ₹ 2639 Cr
🔥 Events this Week: US --- Trump Speech & FED Rate announcement
📌 Sectoral Focus
Metal, Energy
👉 Commodities in Focus: Gold, Silver, Copper, Crude, Natural Gas
💯 Important Quarterly Results: Cupid, GHCL, HUDCO, IEX, ITC,REC, Voltas
📈 Trade smart. Manage risk. Stay disciplined.

NIFTY KEY LEVELS FOR 28.01.2026NIFTY KEY LEVELS FOR 28.01.2026
Timeframe: 3 Minutes
If the candle stays above the pivot point, it is considered a bullish bias; if it remains below, it indicates a bearish bias. Price may reverse near Resistance 1 or Support 1. If it moves further, the next potential reversal zone is near Resistance 2 or Support 2. If these levels are also broken, we can expect the trend.
When a support or resistance level is broken, it often reverses its role; a broken resistance becomes the new support, and a broken support becomes the new resistance.
If the range(R2-S2) is narrow, the market may become volatile or trend strongly. If the range is wide, the market is more likely to remain sideways
please like and share my idea if you find it helpful
📢 Disclaimer
I am not a SEBI-registered financial adviser.
The information, views, and ideas shared here are purely for educational and informational purposes only. They are not intended as investment advice or a recommendation to buy, sell, or hold any financial instruments.
Please consult with your SEBI-registered financial advisor before making any trading or investment decisions.
Trading and investing in the stock market involves risk, and you should do your own research and analysis. You are solely responsible for any decisions made based on this research.

NIFTY KEY LEVELS FOR 27.01.2026NIFTY KEY LEVELS FOR 27.01.2026
Timeframe: 3 Minutes
If the candle stays above the pivot point, it is considered a bullish bias; if it remains below, it indicates a bearish bias. Price may reverse near Resistance 1 or Support 1. If it moves further, the next potential reversal zone is near Resistance 2 or Support 2. If these levels are also broken, we can expect the trend.
When a support or resistance level is broken, it often reverses its role; a broken resistance becomes the new support, and a broken support becomes the new resistance.
If the range(R2-S2) is narrow, the market may become volatile or trend strongly. If the range is wide, the market is more likely to remain sideways
please like and share my idea if you find it helpful
📢 Disclaimer
I am not a SEBI-registered financial adviser.
The information, views, and ideas shared here are purely for educational and informational purposes only. They are not intended as investment advice or a recommendation to buy, sell, or hold any financial instruments.
Please consult with your SEBI-registered financial advisor before making any trading or investment decisions.
Trading and investing in the stock market involves risk, and you should do your own research and analysis. You are solely responsible for any decisions made based on this research.

#NIFTY Intraday Support and Resistance Levels - 27/01/2026A gap-up opening near the 25200 zone in Nifty indicates an attempt by the market to stabilize after recent selling pressure, but the broader structure still suggests a range-bound to weak undertone unless key resistance levels are decisively crossed. The gap-up itself is not a confirmation of trend reversal; instead, it places the index right at an important decision-making area, where both buyers and sellers are active. The initial 30 minutes of trade will be critical to judge whether the gap sustains or starts filling.
From a technical perspective, the 25250–25300 region is acting as a major intraday resistance. This zone has previously seen supply and rejection, which means any upside move without volume support may struggle here. A reversal long setup becomes valid only if Nifty sustains above 25250, with follow-through buying. In such a case, upside targets can be projected towards 25350, 25400, and 25450+, where partial profit booking is advisable due to overhead supply and previous breakdown levels.
On the downside, 25200–25150 is the immediate support band. Failure to hold above this level, especially if the gap starts getting filled, can invite fresh selling pressure. A breakdown below 25200 opens up a short-selling opportunity, with downside targets around 25100, 25050, and 25000. These levels are psychologically and technically important, and price reactions here should be watched closely for potential intraday bounces.
If selling momentum intensifies and Nifty breaks below 24950, it would signal continuation of the broader bearish structure. Below this level, the index may slide towards 24850, 24800, and 24750, where stronger demand zones are placed. These lower levels can act as temporary support, but trend reversal should only be considered after clear price confirmation and structure change.
Overall, the market is showing a gap-up within a corrective or consolidation phase, not a confirmed bullish trend yet. Traders should remain level-driven, avoid chasing the opening move, and wait for price acceptance above resistance or breakdown below support. Tight stop-losses, partial profit booking, and disciplined risk management are essential, as volatility and false breakouts are likely around the current zone.

NIFTY : Trading levels and Plan for 27-Jan-2026📘 NIFTY TRADING PLAN – 27 JAN 2026
⏱ Timeframe: 15-Min
📊 Gap Considered: 100+ Points
🎯 Approach: Trade only after price acceptance / rejection
🔼 GAP UP OPENING SCENARIO 🚀
If NIFTY opens with a strong gap-up, avoid emotional buying in the first few candles.
📍 Key Resistance Zone: 25,177 – 25,230
• This zone acted as supply earlier
• High probability of consolidation or rejection
🟢 Bullish Continuation Plan:
15-min candle closes above 25,230
Follow-up candle shows higher low
Targets → 25,300 → 25,347
🔴 Rejection / Pullback Plan:
Failure to sustain above 25,177
Expect retracement towards 25,081
🧠 Options Strategy:
• Bull Call Spread (ATM CE Buy + OTM CE Sell)
• Avoid naked CE buying near resistance
➡️ FLAT / RANGE OPENING SCENARIO ⚖️
Flat open indicates indecision and option decay opportunity.
🚧 NO TRADE ZONE: 25,109 – 25,177
• Whipsaw probability is high
• Directional trades only after breakout
🟢 Upside Plan:
Acceptance above 25,177
Targets → 25,230 → 25,300
🔴 Downside Plan:
Breakdown below 25,109
Drift towards 25,081
🧠 Options Strategy:
• Short Strangle / Iron Condor
• Only with strict SL on breakout
🔽 GAP DOWN OPENING SCENARIO 📉
Gap-down open tests buyer strength early.
🟢 Opening Support Zone: 25,029 – 25,081
• Buyers may attempt initial bounce
🟢 Bounce Confirmation:
Rejection wicks near support
Higher low on 15-min chart
Upside target → 25,109 → 25,177
🔴 Breakdown Scenario:
Sustained trade below 25,029
Next downside zone → 24,854 – 24,781
🧠 Options Strategy:
• Bear Put Spread if breakdown confirms
• Avoid panic selling near support
🛡 OPTIONS RISK MANAGEMENT TIPS
Never trade inside NO-TRADE ZONE
Prefer spreads over naked options
Risk max 1–2% capital per trade
Book partial profits near levels
One trade = one idea (no revenge trading)
📌 SUMMARY & CONCLUSION
• 25,109 – 25,177 is the key decision zone
• Directional move only after acceptance
• Gap days reward patience, not speed
• Let price confirm → then execute 📊
⚠️ DISCLAIMER
This analysis is for educational purposes only.
I am not a SEBI registered analyst.
Markets involve risk—trade responsibly.

Dalal Street Shaken Ahead of Monthly Expiry — What’s Next?Indian equity markets witnessed a sharp corrective move last week, with the Nifty sliding nearly 2.5% to close around 25,050. The sell-off came at a sensitive juncture—just ahead of monthly expiry.
Adding to the nervousness, India VIX jumped sharply by 24.8% to 14.19, signaling a sudden rise in uncertainty and trader caution.
A combination of geopolitical tensions, pre-Union Budget 2026 jitters, and mixed Q3 earnings weighed heavily on market sentiment, prompting profit booking across sectors.
◉ Technical Setup
Nifty is currently testing the lower end of its rising channel, a technically important area. A mild relief bounce is possible from these levels.
However, a decisive breakdown below the channel support could trigger another leg of sharp selling in the coming sessions, making this zone extremely crucial for near-term direction.
◉ Key Levels to Watch
Support Zones
25,000 – 24,900: Immediate psychological and technical support
24,500 – 24,400: Strong base with heavy put writer concentration
Resistance Zones
25,400 – 25,500: Immediate hurdle with significant call writing
26,000 – 26,100: Major supply zone and strong resistance
◉ Near-Term View
Volatility is likely to remain elevated in the coming week. While the broader structure has weakened, a short-term bounce from the 25,000 zone cannot be ruled out, given oversold conditions and strong psychological support.
That said, any recovery should be viewed with caution and may face stiff resistance at higher levels.
◉ Suggested Strategy
A cautious, stock-specific strategy is preferred for the week ahead. Short-term oversold signals may support a bounce, but the broader trend has weakened. Avoid aggressive longs and focus on protecting gains.

NIFTY Faces Pressure: Can 24,300 Hold?NIFTY has turned weak after falling around 2.5% on the weekly chart. The index has made a double top near 26,250, which usually means the market is finding it hard to move higher from that area.
On the weekly chart, the candles look bearish. NIFTY is currently holding near an important support around 25,000 (50 EMA). If this level breaks, the market may move lower towards 24,300 and even 23,900.
On the daily chart, NIFTY is trading below all major moving averages (20, 50, 100 & 200 EMA). In the past, whenever NIFTY stayed below these averages, it usually corrected further. Right now, there is no strong support before 24,600.
On the monthly chart, a double top is visible again, showing weakness at higher levels. However, there is decent support near 24,300–24,240, which is also close to the monthly 20 EMA.
Momentum is also weakening. RSI is showing bearish divergence on weekly and monthly charts, which suggests upside strength is fading.
Resistance Levels :- 25,200 – 25,300, 25,500, 26,250
Support Levels :- 24,987, 24,600, 24,300 – 24,240, 23,900
Overall View
As long as NIFTY stays below 25,500, the trend remains weak. Market direction will become clearer near the 24,300 support zone.

NIFTY KEY LEVELS FOR 23.01.2026NIFTY KEY LEVELS FOR 23.01.2026
Timeframe: 3 Minutes
If the candle stays above the pivot point, it is considered a bullish bias; if it remains below, it indicates a bearish bias. Price may reverse near Resistance 1 or Support 1. If it moves further, the next potential reversal zone is near Resistance 2 or Support 2. If these levels are also broken, we can expect the trend.
When a support or resistance level is broken, it often reverses its role; a broken resistance becomes the new support, and a broken support becomes the new resistance.
If the range(R2-S2) is narrow, the market may become volatile or trend strongly. If the range is wide, the market is more likely to remain sideways
please like and share my idea if you find it helpful
📢 Disclaimer
I am not a SEBI-registered financial adviser.
The information, views, and ideas shared here are purely for educational and informational purposes only. They are not intended as investment advice or a recommendation to buy, sell, or hold any financial instruments.
Please consult with your SEBI-registered financial advisor before making any trading or investment decisions.
Trading and investing in the stock market involves risk, and you should do your own research and analysis. You are solely responsible for any decisions made based on this research.

#NIFTY Intraday Support and Resistance Levels - 23/01/2026A flat opening is expected in Nifty 50, indicating continuation of the ongoing consolidation after the recent sharp sell-off and recovery attempts. The index is currently trading in a well-defined range, where buyers and sellers are both active near key levels, resulting in choppy price action. This kind of opening usually suggests that the market is waiting for fresh triggers and confirmation before committing to a directional move, especially after multiple volatile sessions.
From a technical standpoint, the 25250–25300 zone is acting as an important intraday support and decision-making area. If Nifty manages to sustain above 25250, it signals short-term strength and opens the door for a reversal-based long trade. In such a case, upside targets can be expected near 25350, followed by 25400 and 25450+, where previous supply zones are placed. However, traders should note that this upside is likely to face resistance near 25450, which remains a strong hurdle unless there is a clear breakout with volume.
On the downside, the 25450–25400 zone continues to behave as a strong resistance area. Any rejection or failure to sustain above this region can trigger selling pressure again. Short positions can be considered near 25450–25400 with a cautious approach, aiming for pullbacks towards 25350, 25300, and 25250. This makes the upper range a selling-on-rise zone rather than a breakout-buying zone, unless price decisively closes above resistance.
If Nifty breaks and sustains below 25200, the structure may turn weak once again. A breakdown below this level can accelerate downside momentum towards 25100, 25050, and 25000, which are important psychological and technical supports. Any sharp move into these lower levels could invite temporary bounces, but overall sentiment would remain cautious as long as the index trades below the major resistance zones.
Overall, the broader view suggests a range-bound market with mild bearish undertones, where aggressive trades should be avoided. Traders are advised to focus on level-based trades, book partial profits quickly, and keep strict stop-losses. Patience will be key, as a clear directional move is likely to emerge only after Nifty breaks out decisively from this consolidation range.

Lets Talk about Nifty I make educational content videos on Trading - Swing Trading in Indian markets especially
In this video I am talking about Nifty in general as a index nothing else - no direction - no predication - I am a setup and data backed trader and follow my setups and not general trends or bias shared commonly .

NIFTY KEY LEVELS FOR 22.01.2026NIFTY KEY LEVELS FOR 22.01.2026
Timeframe: 3 Minutes
Unable to post on time due to a technical glitch. Sorry for the delayed post.
If the candle stays above the pivot point, it is considered a bullish bias; if it remains below, it indicates a bearish bias. Price may reverse near Resistance 1 or Support 1. If it moves further, the next potential reversal zone is near Resistance 2 or Support 2. If these levels are also broken, we can expect the trend.
When a support or resistance level is broken, it often reverses its role; a broken resistance becomes the new support, and a broken support becomes the new resistance.
If the range(R2-S2) is narrow, the market may become volatile or trend strongly. If the range is wide, the market is more likely to remain sideways
please like and share my idea if you find it helpful
📢 Disclaimer
I am not a SEBI-registered financial adviser.
The information, views, and ideas shared here are purely for educational and informational purposes only. They are not intended as investment advice or a recommendation to buy, sell, or hold any financial instruments.
Please consult with your SEBI-registered financial advisor before making any trading or investment decisions.
Trading and investing in the stock market involves risk, and you should do your own research and analysis. You are solely responsible for any decisions made based on this research.

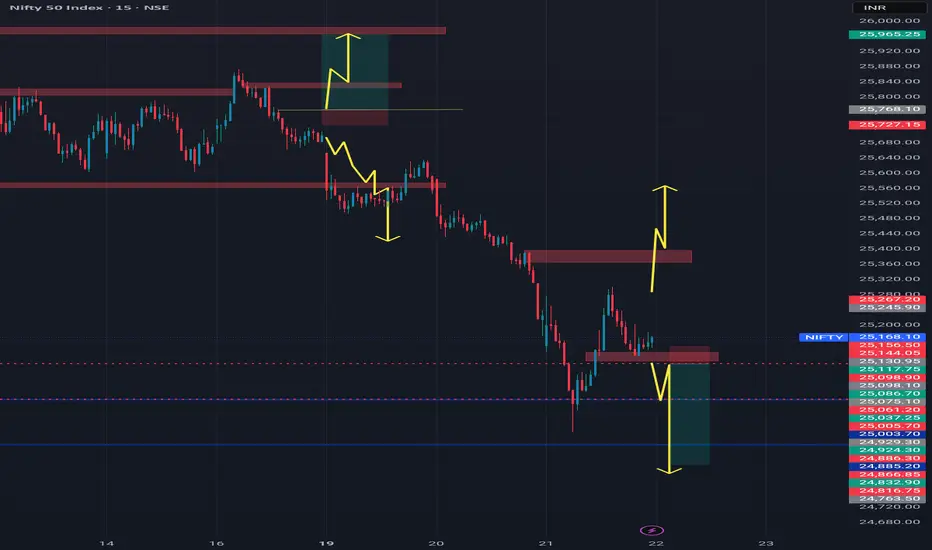
NIFTY : Trading levels and Plan for 22-Jan-2026
Timeframe: 15-minute
Gap Considered: 100+ points
Market Context: Sharp sell-off followed by a relief bounce; index is still below key resistance, indicating pullback within a broader corrective structure.
🔼 SCENARIO 1: GAP UP OPENING (100+ points) 🚀
If NIFTY opens above 25,316, it signals continuation of short-covering from lower levels.
The 25,316–25,370 zone will act as the first supply area.
Sustained 15-min close above 25,370 can open upside toward:
• 25,499 – 25,537 (Last Intraday Resistance zone)
Above 25,537, momentum extension toward 25,600+ is possible, but only with strong volume.
Failure to sustain above 25,316 = trap zone → expect pullback.
📌 Educational Note:
Gap-up markets after a fall often face supply. Prefer buy-on-dips rather than chasing green candles.
📌 Options Thought:
• Bull Call Spread (risk-defined)
• Avoid naked CE buying at resistance
• Book partial profits early 📈
➡️ SCENARIO 2: FLAT / RANGE OPENING ⚖️
If NIFTY opens inside 25,228 – 25,316, the market is likely to stay balanced and choppy initially.
This zone acts as Opening Support / Resistance + No-Trade Zone.
False breakouts are highly probable.
Upside confirmation only above 25,370.
Downside weakness resumes below 25,228.
Wait for a 15-min close outside the zone before acting.
📌 Educational Note:
Flat opens after volatile sessions usually mean time correction, not price correction.
📌 Options Thought:
• Theta strategies (Iron Fly / Short Strangle) only with SL
• Avoid aggressive directional bets
• Reduce quantity ⏳
🔽 SCENARIO 3: GAP DOWN OPENING (100+ points) 📉
If NIFTY opens below 25,228, sellers remain in control.
Immediate support lies near 25,109.
Breakdown below 25,109 exposes:
• 25,000 (Last Intraday Support – psychological level)
Below 25,000, selling pressure can accelerate.
Any bounce toward 25,228–25,316 should be treated as sell-on-rise.
📌 Educational Note:
In gap-down scenarios, capital protection is priority — trend is your friend.
📌 Options Thought:
• Bear Put Spread preferred over naked PE
• Avoid PE selling in trending markets
• Trail SL aggressively 📉
🧠 Risk Management Tips for Options Trading 🛡️
Risk only 1–2% of capital per trade.
Expiry proximity = faster premium decay.
Use spreads to manage volatility risk.
No confirmation candle = no trade.
Avoid overtrading in no-trade zones.
📌 Summary & Conclusion ✨
NIFTY is in a pullback phase within a broader corrective structure.
📍 25,228–25,316 remains the key decision zone.
📍 Strength only above 25,370 → 25,537.
📍 Weakness continues below 25,228 → 25,000.
Patience and level-based trading will be crucial today.
⚠️ Disclaimer
This analysis is for educational purposes only.
I am not a SEBI registered analyst.
Markets are uncertain and I may be wrong.
Please consult your financial advisor before trading.

NiftyNifty has attempted multiple recoveries after the fall, consistently taking support near the 25100 level. If the index opens with a gap down below 25100 and forms a strong bearish candle, a further downside move towards 24750 can be expected. A bullish move is likely only after a decisive break above 25400. Until then price action remain sideways within the 25300-25100 range.
NIFTY KEY LEVELS FOR 21.01.2026NIFTY KEY LEVELS FOR 21.01.2026
Timeframe: 3 Minutes
Unable to post on time due to a technical glitch. Sorry for the delayed post.
If the candle stays above the pivot point, it is considered a bullish bias; if it remains below, it indicates a bearish bias. Price may reverse near Resistance 1 or Support 1. If it moves further, the next potential reversal zone is near Resistance 2 or Support 2. If these levels are also broken, we can expect the trend.
When a support or resistance level is broken, it often reverses its role; a broken resistance becomes the new support, and a broken support becomes the new resistance.
If the range(R2-S2) is narrow, the market may become volatile or trend strongly. If the range is wide, the market is more likely to remain sideways
please like and share my idea if you find it helpful
📢 Disclaimer
I am not a SEBI-registered financial adviser.
The information, views, and ideas shared here are purely for educational and informational purposes only. They are not intended as investment advice or a recommendation to buy, sell, or hold any financial instruments.
Please consult with your SEBI-registered financial advisor before making any trading or investment decisions.
Trading and investing in the stock market involves risk, and you should do your own research and analysis. You are solely responsible for any decisions made based on this research.

NIFTY : Trading levels and Plan for 21-Jan-2025📘 NIFTY Trading Plan – 21 Jan 2026
Timeframe: 15-minute
Gap Considered: 100+ points
Market Context: Strong sell-off followed by base formation; market trading near a decision / no-trade zone after sharp momentum move
🔼 SCENARIO 1: GAP UP OPENING (100+ points) 🚀
If NIFTY opens above 25,316, it indicates short-covering after the recent decline.
Immediate hurdle lies at 25,388 – 25,415 (Opening / Last Intraday Resistance).
Sustained 15-min close above 25,415 is required for bullish continuation.
Upside targets to watch:
• 25,485
• 25,540+ (only if momentum expands)
Any rejection from resistance with weak candles = profit-booking zone.
Avoid aggressive long entries exactly at resistance; wait for pullback & hold.
📌 Options Thought (Gap Up):
• Prefer Bull Call Spread instead of naked CE
• Book partial profits near resistance zones
• Trail SL aggressively 📈
➡️ SCENARIO 2: FLAT / RANGE OPENING ⚖️
If NIFTY opens inside 25,227 – 25,316, market is likely to remain range-bound initially.
This entire zone acts as a NO TRADE / Balance Zone.
Expect whipsaws and false breakouts.
Upside trade triggers only above 25,415.
Downside pressure resumes below 25,227.
Patience is key — let price show intent first.
📌 Options Thought (Flat Market):
• Ideal environment for Theta-based strategies ⏳
• Short strangle / Iron Condor only with strict SL
• Avoid overtrading inside the range
🔽 SCENARIO 3: GAP DOWN OPENING (100+ points) 📉
If NIFTY opens below 25,227, bears remain in control.
First important support lies at 25,043 (Last Intraday Support).
A bounce is possible, but trend remains weak below 25,316.
Breakdown below 25,043 opens downside toward:
• 24,900 – 24,890 (Major Buyer / Trend Reversal Zone)
Avoid bottom-fishing unless strong reversal structure forms.
📌 Options Thought (Gap Down):
• Prefer Bear Put Spread or directional PE with tight SL
• Avoid selling PE in trending markets
• Focus on quick scalps & disciplined exits 📉
🧠 Risk Management Tips for Options Trading 🛡️
Risk only 1–2% capital per trade.
Avoid revenge trading after SL.
Expiry proximity = faster decay & sharper moves.
Use spreads to control volatility risk.
No confirmation = no trade.
📌 Summary & Conclusion ✨
NIFTY is currently trading near a key balance zone after a sharp fall.
📍 25,227 – 25,316 remains the critical decision area.
📍 Strength only above 25,415 with acceptance.
📍 Weakness continues below 25,227, with eyes on 25,043 → 24,900.
Trade light, respect levels, and let the market confirm direction.
⚠️ Disclaimer
This analysis is for educational purposes only.
I am not a SEBI registered analyst.
Markets are uncertain and I may be wrong.
Please consult your financial advisor before trading.

NIFTY KEY LEVELS FOR 20.01.2026NIFTY KEY LEVELS FOR 20.01.2026
Timeframe: 3 Minutes
Sorry for the Delayed post..
If the candle stays above the pivot point, it is considered a bullish bias; if it remains below, it indicates a bearish bias. Price may reverse near Resistance 1 or Support 1. If it moves further, the next potential reversal zone is near Resistance 2 or Support 2. If these levels are also broken, we can expect the trend.
When a support or resistance level is broken, it often reverses its role; a broken resistance becomes the new support, and a broken support becomes the new resistance.
If the range(R2-S2) is narrow, the market may become volatile or trend strongly. If the range is wide, the market is more likely to remain sideways
please like and share my idea if you find it helpful
📢 Disclaimer
I am not a SEBI-registered financial adviser.
The information, views, and ideas shared here are purely for educational and informational purposes only. They are not intended as investment advice or a recommendation to buy, sell, or hold any financial instruments.
Please consult with your SEBI-registered financial advisor before making any trading or investment decisions.
Trading and investing in the stock market involves risk, and you should do your own research and analysis. You are solely responsible for any decisions made based on this research.

NIFTY : Trading levels and Plan for 20-Jan📘 NIFTY Trading Plan – 20 Jan 2026
Timeframe: 15-minute
Gap Criteria Considered: 100+ points
Market Structure: Short-term corrective phase after rejection from upper range, base formation near intraday support
🔼 SCENARIO 1: GAP UP OPENING (100+ points) 🚀
If NIFTY opens above 25,667, it signals bullish intent with short-covering momentum.
Immediate resistance zone lies at 25,667 – 25,682 (Opening / Last Resistance).
Sustained price acceptance above 25,682 on a 15-min close can trigger upside continuation.
Upside targets to watch:
• 25,740
• 25,791
Expect minor pullbacks near resistance; fresh longs only on pullback + hold above broken levels.
Avoid chasing gap-up candles without retest confirmation.
📌 Options Strategy (Gap Up):
• Bull Call Spread (ATM Buy + OTM Sell)
• Avoid naked CE buying near resistance
• Trail profits aggressively as volatility expands 📈
➡️ SCENARIO 2: FLAT / RANGE OPENING ⚖️
If NIFTY opens within 25,529 – 25,568, market enters a balance / no-trade zone.
This zone acts as Opening Support Zone for flat markets.
Expect whipsaws and fake breakouts initially.
Upside trade activates only above 25,682.
Downside pressure increases below 25,529.
Best environment for patience and structure-based entries.
📌 Options Strategy (Flat Market):
• Short Strangle / Iron Condor (only for experienced traders)
• Focus on theta decay ⏳
• Keep strict SL on breakout from range
🔽 SCENARIO 3: GAP DOWN OPENING (100+ points) 📉
If NIFTY opens below 25,529, bears gain control early.
First support zone is 25,422 – 25,364 (Intraday Demand Zone).
Expect a technical bounce, but trend remains weak below resistance.
Breakdown below 25,364 can open deeper downside.
Avoid bottom fishing until strong bullish reversal candle appears.
📌 Options Strategy (Gap Down):
• Bear Put Spread preferred
• Avoid aggressive PE selling in trending markets
• Quick scalps only, book fast 📉
🧠 Risk Management Tips for Options Trading 🛡️
Risk only 1–2% of capital per trade.
Expiry week = faster premium decay & sharp moves.
Prefer spreads over naked option buying.
No revenge trading after SL hits.
Always wait for 15-min structure confirmation before entry.
📌 Summary & Conclusion ✨
NIFTY is currently trading near a short-term balance zone.
📍 25,529 – 25,568 is the key decision-making area.
📍 Sustained move above 25,682 may revive bullish momentum.
📍 Below 25,529, downside risk increases sharply toward 25,422.
Trade light, respect levels, and let price confirm direction.
⚠️ Disclaimer
This content is for educational purposes only.
I am not a SEBI registered analyst.
Markets are uncertain, and I can be wrong.
Please consult your financial advisor before trading.

NIFTY KEY LEVELS FOR 19.01.2026NIFTY KEY LEVELS FOR 19.01.2026
Timeframe: 3 Minutes
Sorry for the Delayed post..
If the candle stays above the pivot point, it is considered a bullish bias; if it remains below, it indicates a bearish bias. Price may reverse near Resistance 1 or Support 1. If it moves further, the next potential reversal zone is near Resistance 2 or Support 2. If these levels are also broken, we can expect the trend.
When a support or resistance level is broken, it often reverses its role; a broken resistance becomes the new support, and a broken support becomes the new resistance.
If the range(R2-S2) is narrow, the market may become volatile or trend strongly. If the range is wide, the market is more likely to remain sideways
please like and share my idea if you find it helpful
📢 Disclaimer
I am not a SEBI-registered financial adviser.
The information, views, and ideas shared here are purely for educational and informational purposes only. They are not intended as investment advice or a recommendation to buy, sell, or hold any financial instruments.
Please consult with your SEBI-registered financial advisor before making any trading or investment decisions.
Trading and investing in the stock market involves risk, and you should do your own research and analysis. You are solely responsible for any decisions made based on this research.

NIFTY : Trading levels and Plan for 19-Jan-2026📘 NIFTY Trading Plan – 19 Jan 2026
Timeframe: 15-minute
Gap Consideration: 100+ points
Market Context: Range expansion attempt after corrective swings, key balance area in focus
🔼 SCENARIO 1: GAP UP OPENING (100+ points) 🚀
If NIFTY opens above 25,780, it indicates bullish intent with short-covering.
Immediate hurdle lies at 25,915–25,945 (Last Intraday Resistance zone).
Sustained 15-min close above 25,945 can trigger upside extension.
Next upside projection comes near 26,044.
Expect volatility and profit booking near resistance zones.
Fresh longs only on pullback + hold above resistance.
📌 Options Strategy (Gap Up):
• Bull Call Spread (ATM Buy + OTM Sell)
• Avoid aggressive naked CE near resistance
• Trail profits aggressively 📈
➡️ SCENARIO 2: FLAT / RANGE OPENING ⚖️
If NIFTY opens within 25,660–25,738, expect a no-trade / chop zone.
This zone is marked as Opening Support–Resistance.
Market likely to trap both buyers and sellers initially.
Upside trade only above 25,780 with confirmation.
Downside bias activates below 25,560.
Best suited for option sellers if IV permits.
📌 Options Strategy (Flat Market):
• Short Strangle / Iron Fly (experienced traders only)
• Focus on theta decay ⏳
• Avoid directional bias inside range
🔽 SCENARIO 3: GAP DOWN OPENING (100+ points) 📉
If NIFTY opens below 25,560, selling pressure may resume.
First support zone is 25,530–25,567 (Opening / Last Intraday Support).
Minor bounce possible, but trend remains weak below resistance.
Breakdown below 25,530 opens downside towards:
• 25,423
Avoid bottom fishing without confirmation candle.
📌 Options Strategy (Gap Down):
• Bear Put Spread preferred
• Avoid selling PE in trending downside
• Quick scalps only, book fast 📉
🧠 Risk Management Tips for Options Trading 🛡️
Risk only 1–2% of capital per trade.
Expiry proximity = faster decay & sharper moves.
Prefer spreads over naked buying.
One trade = one idea. No revenge trading.
Always wait for 15-min structure confirmation.
📌 Summary & Conclusion ✨
NIFTY is trading near a critical balance zone.
📍 25,660–25,738 remains the decision-making range.
📍 Break above 25,945 may revive bullish momentum.
📍 Below 25,530, downside risk increases sharply.
Trade light, respect levels, and let the market confirm direction.
⚠️ Disclaimer
This content is for educational purposes only.
I am not a SEBI registered analyst.
Markets are uncertain, and I can be wrong.
Please consult your financial advisor before trading.

NIFTY KEY LEVELS FOR 16.01.2026NIFTY KEY LEVELS FOR 16.01.2026
Timeframe: 3 Minutes
If the candle stays above the pivot point, it is considered a bullish bias; if it remains below, it indicates a bearish bias. Price may reverse near Resistance 1 or Support 1. If it moves further, the next potential reversal zone is near Resistance 2 or Support 2. If these levels are also broken, we can expect the trend.
When a support or resistance level is broken, it often reverses its role; a broken resistance becomes the new support, and a broken support becomes the new resistance.
If the range(R2-S2) is narrow, the market may become volatile or trend strongly. If the range is wide, the market is more likely to remain sideways
please like and share my idea if you find it helpful
📢 Disclaimer
I am not a SEBI-registered financial adviser.
The information, views, and ideas shared here are purely for educational and informational purposes only. They are not intended as investment advice or a recommendation to buy, sell, or hold any financial instruments.
Please consult with your SEBI-registered financial advisor before making any trading or investment decisions.
Trading and investing in the stock market involves risk, and you should do your own research and analysis. You are solely responsible for any decisions made based on this research.