Nifty 50 – Tomorrow’s Intraday Trade Plan (1st July 2025)
🔴 Bullish Zones (Call Option Focus)
₹25,790.00 – Above 10M Closing Shot Cover Level
₹25,770.00 – Above 10M Hold CE by Entry Level
₹25,700.00 – Above 10M Hold CE by Entry Level
₹25,590.00 – Above 10M Hold Positive Trade View
₹25,413.00 – Above Opening S1 10M Hold CE by Level
₹25,290.00 – Above 10M Hold CE by Level
₹25,113.00 – Above 10M Hold CE by Safe Zone Level
🔵 Bearish Zones (Put Option Focus)
₹25,790.00 – Below 10M Hold PE by Safe Zone
₹25,690.00 – Below 10M Hold PE by Risky Zone
₹25,590.00 – Below 10M Hold Negative Trade View
₹25,363.00 – Below Opening R1 10M Hold PE by Level
₹25,250.00 – Below 10M Hold PE by Level
< ₹25,113.00 – Below 10M Hold = UNWINDING Zone
Niftyprediction

NIFTY : Trading levels and Plan for 30-JUN-2025
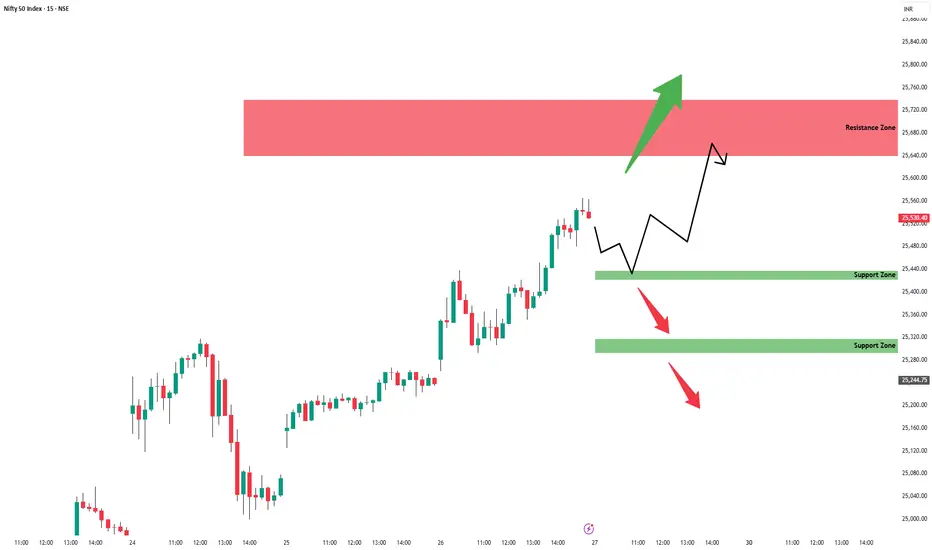
\ 📊 NIFTY 50 TRADING PLAN – 30-Jun-2025\
📍 \ Previous Close:\ 25,632
📏 \ Gap Opening Consideration:\ ±100 points
📈 \ Chart Timeframe:\ 15-min
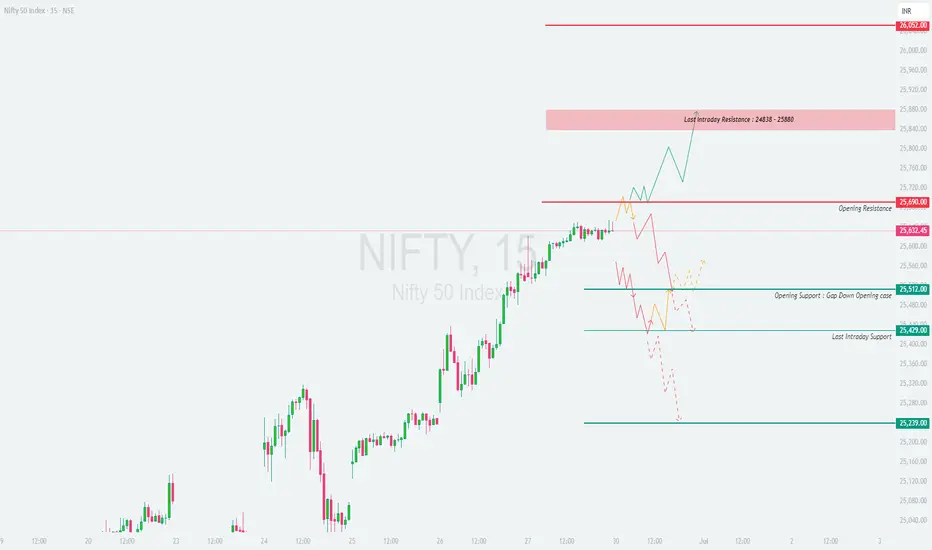
🧩 \ Key Zones:\ Resistance – 25,690 / Support – 25,429 / Last Resistance – 25,838–25,880
---
\
\ \ 🚀 GAP-UP OPENING (Above 25,730):\
If NIFTY opens above \ 25,730\ , it will quickly enter the \ Last Intraday Resistance Zone (25,838 – 25,880)\ . This area is likely to act as a supply zone where profit booking may kick in. Traders should avoid aggressive longs near resistance unless a breakout is confirmed with strong momentum.
✅ \ Plan of Action:\
• Wait for price action to stabilize near 25,838
• Go long only if there's a breakout above 25,880 with strong volume
• Watch for bearish patterns like shooting stars or bearish engulfing near this zone
🎯 \ Trade Setup:\
– \ Buy above:\ 25,880
– \ Target:\ 26,000+
– \ SL:\ Below 25,730 or initial range low
📘 \ Tip:\ Avoid FOMO entries in first 15 minutes. Let the candle confirm breakout strength.
\ \ ⚖️ FLAT OPENING (Near 25,630 – 25,690):\
A flat opening near \ 25,632\ brings the market directly around the \ Opening Resistance of 25,690\ . This area could lead to sideways choppiness if there’s no directional conviction. Best strategy is to wait for a breakout or breakdown from this zone.
✅ \ Plan of Action:\
• Observe price behavior between 25,690 (resistance) and 25,512 (support)
• Go long if price breaks and sustains above 25,690 with strength
• Go short if breakdown below 25,512 is seen
🎯 \ Trade Setup Options:\
– \ Buy above:\ 25,690
– \ Sell below:\ 25,512
– \ Target:\ 25,838 or 25,429 depending on breakout/breakdown
– \ SL:\ Opposite zone or prior swing candle
📘 \ Tip:\ Wait for at least a 15-min candle close outside the range for confirmation.
\ \ 📉 GAP-DOWN OPENING (Below 25,512):\
If NIFTY opens below \ 25,512\ , it enters the \ Opening Support Zone for Gap-Down Cases\ . Immediate support lies at \ 25,429\ , which could act as a reversal point. However, if that breaks, NIFTY may fall towards \ 25,239\ .
✅ \ Plan of Action:\
• Watch for a bounce at 25,429 for possible reversal trades
• If price breaks below 25,429 and sustains, initiate short trades
• Look for bullish candles like hammers for reversal signals
🎯 \ Trade Setup:\
– \ Sell below:\ 25,429
– \ Target:\ 25,239
– \ SL:\ Above 25,512
📘 \ Tip:\ Avoid aggressive buying in early dip unless price holds and consolidates above support levels.
---
\ 🧭 KEY LEVELS TO WATCH:\
🔴 \ Opening Resistance:\ 25,690
🟥 \ Last Intraday Resistance:\ 25,838 – 25,880
🟩 \ Opening Support (Gap Down):\ 25,512
🟦 \ Last Intraday Support:\ 25,429
🟫 \ Major Support:\ 25,239
---
\ 💡 OPTIONS TRADING – RISK MANAGEMENT TIPS:\
✅ Trade near ATM options for quick deltas
✅ Don’t hold naked options if VIX is falling
✅ Always set stop-loss for option premiums
✅ Avoid averaging into losing trades
✅ For gap-ups, consider Bear Call Spreads
✅ For gap-downs, look into Bull Put Spreads
🛑 Never trade based on emotion; follow structure and levels only.
---
\ 📌 SUMMARY – ACTIONABLE ZONES:\
• ✅ \ Bullish above:\ 25,690 → Upside potential till 25,880+
• ⚠️ \ Choppy zone:\ 25,512 – 25,690 → Avoid forced trades
• ❌ \ Bearish below:\ 25,429 → Downside open till 25,239
🎯 \ Best Trades:\ Buy above 25,880 (momentum breakout), Sell below 25,429 (breakdown confirmation)
---
\ ⚠️ DISCLAIMER:\
I am not a SEBI-registered analyst. This analysis is shared for educational purposes only. Please do your own research or consult a registered financial advisor before taking trades. Always use strict stop-loss and risk management protocols.
NIFTY INTRADAY LEVELS ( EDUCATIONAL PURPOSE ) 30/06/2025🔷 Nifty Intraday Trade Plan – 30 June
📊 Analysis: 15-min TF | Execution: 1-min TF
🔹 GAP-UP Opening (Above 25,700)
📍 Plan: Avoid chasing longs. Wait for rejection or reversal
🔁 Entry: Sell on breakdown below 5-min low
🛑 SL: 15–20 pts above high
🎯 Target: 25,500–25,540
🔹 GAP-DOWN Opening (Below 25,500)
📍 Plan: Avoid panic selling. Look for reversal candle
🔁 Entry: Buy if price reclaims 5-min opening high
🛑 SL: 15–20 pts below swing low
🎯 Target: 25,650–25,700
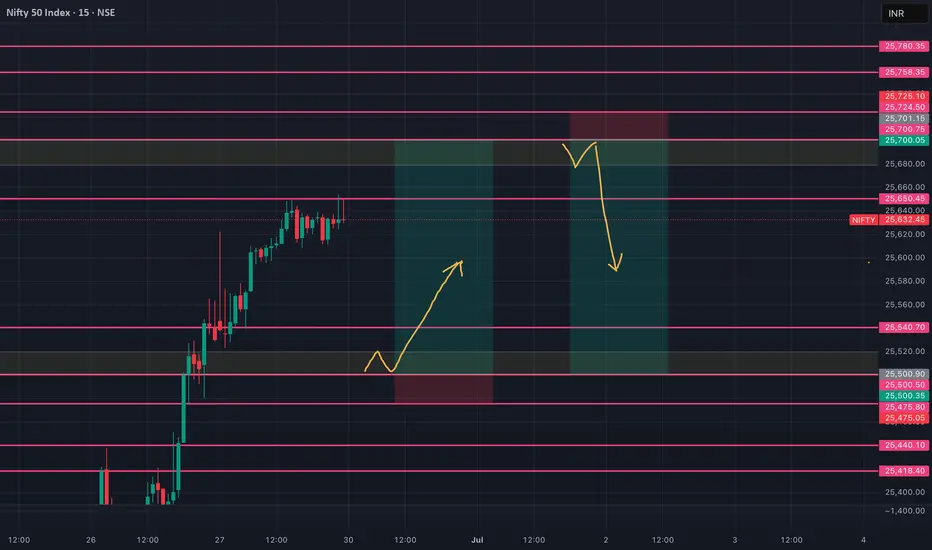
🔹 NORMAL OPEN (Between 25,500–25,700)
🔁 Range Play Setup
📍 Sell near 25,680–700 (resistance zone)
📍 Buy near 25,500–520 (support zone)
🛑 SL: 15–20 pts beyond trigger level
🎯 Target: 30–40 pts
🔺 Breakout Trade Setup
🔁 Entry: Above 25,700 breakout candle
🛑 SL: Below breakout bar
🎯 Target: 25,760–780
🔻 Breakdown Trade Setup
🔁 Entry: Below 25,500 breakdown
🛑 SL: Above breakdown bar
🎯 Target: 25,440–420
💡 KEY INTRADAY TIPS
✔ Avoid overtrading in opening 5 min
✔ Focus on clean 1-min structure
✔ Size small until confirmation
✔ Follow strict SL & trail profits
NIFTY Intraday Trade Setup For 30 Jun 2025NIFTY Intraday Trade Setup For 30 Jun 2025
Bullish-Above 25685
Invalid-Below 25635
T- 25885
Bearish-Below 25520
Invalid- Above 25570
T- 25340
NIFTY has closed on a bullish note last week. It gave a range breakout which was valid for more than a month. It is at a striking distance to ATH which may be taken out in the coming weeks. 25500 is a strong intraday support zone. We have planned a sell below the same (25520), but consider only in the second attempt. In case of a pullback breakout above 25685 we will long for the target of 25685. 25685-25930 will be a resistance zone in intraday.
In case of a big gap up/down, wait till 10 o'clock and mark the high and low of the trading range (5MIN). Trade on this range breakout.
==========
I am Not SEBI Registered
This is my personal analysis for my personal trading. Kindly consult your financial advisor before taking any actions based on this.

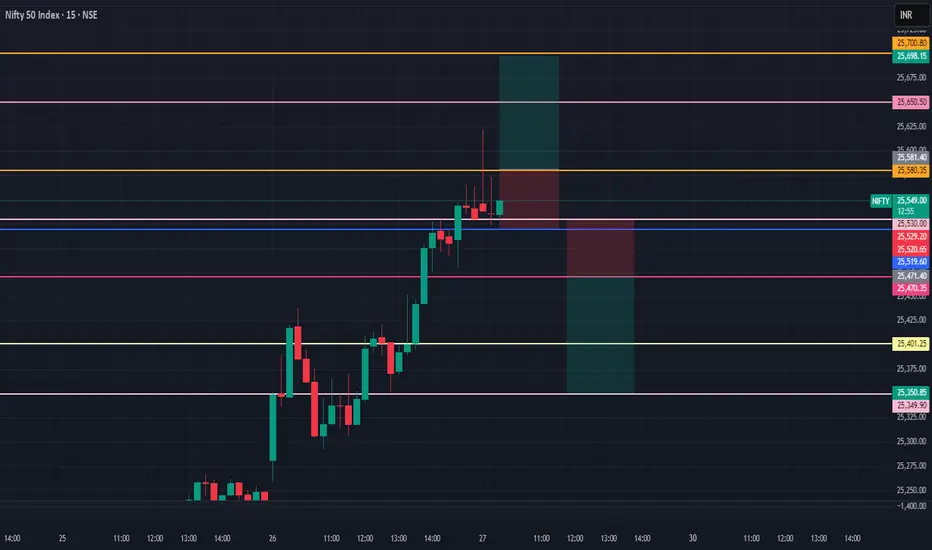
NIFTY LEVELS FOR INTRADAY ( EDUCATIONAL PURPOSE) 27/06/2025📊 Nifty Intraday Scalping Strategy – 27th June
📈 Chart Analysis: 15-min 📉 Execution: 1-min
🚀 Strong Momentum Above 25,550
🔼 If Gap-Up or Breakout Above 25,580:
✅ Buy above 25,580 on 1-min breakout
🎯 Target: 25,650 / 25,700
🛑 SL: 25,520
⚠️ Wait for retest if opening is volatile
📉 If Gap-Down Below 25,480:
✅ Sell below 25,470 on weakness
🎯 Target: 25,400 / 25,350
🛑 SL: 25,530
⚠️ No short if 25,450 holds with volume support
🔁 Sideways Note:
🔹 Don’t chase trades in first 5 mins
🔹 Use VWAP & 1-min candle structure for clean entries
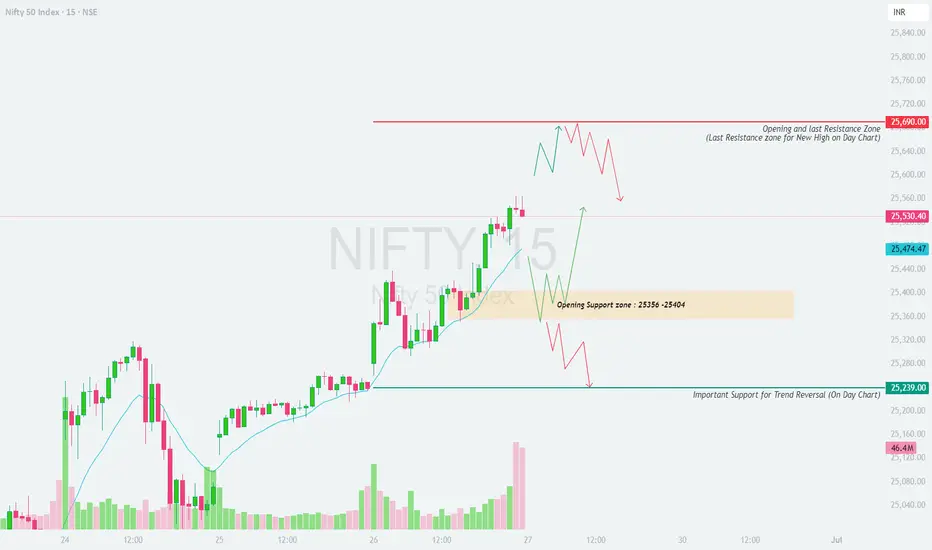
NIFTY : Trading levels and plan for 27-Jun-2025📊 NIFTY TRADING PLAN – 27-Jun-2025
📍 Previous Close: 25,530
📏 Gap Opening Reference: ±100 points
🕓 Chart Timeframe: 15-Min
🧠 Approach: Actionable plan based on reaction zones + trend-following confirmation
🚀 GAP-UP OPENING (Above 25,690):
A 100+ point gap-up above 25,690 takes Nifty straight into the Opening and Last Resistance Zone — a zone marked for possible exhaustion, where further upside needs strong momentum or risk of rejection increases.
✅ Plan of Action:
• Watch early 15-min candle — strength above 25,690 = bullish extension
• A rejection with long upper wick may signal reversal
• If breakout sustains → New intraday high potential
🎯 Trade Setup:
– Long above 25,690 (on candle close)
– Target: 25,800+
– SL: Below 25,650
– Avoid shorting aggressively unless clean rejection observed
📘 Tip: Always wait for a breakout retest before jumping into longs in such extended zones. Avoid chasing in the first 5 mins.
⚖️ FLAT OPENING (Between 25,530 – 25,474):
A flat open will place Nifty just below the upper resistance. Volatility may expand in either direction from here, so patience is key.
✅ Plan of Action:
• First 15–30 mins are crucial for market direction
• If Nifty crosses 25,690 → breakout trade setup
• If it fails and comes back below 25,474 → shorting opportunity toward support zone
🎯 Trade Setup Options:
– Long above 25,690 (with volume)
– Short below 25,474 (weakness confirmation)
– Targets: 25,690 (upside) | 25,404 (downside)
– SL: Based on 15-min close above/below key level
📘 Tip: This zone demands trader discipline — don’t be early in either direction. Let the chart structure develop.
📉 GAP-DOWN OPENING (Below 25,404):
Nifty opening below 25,404 shifts the focus to the Opening Support Zone (25,404–25,356) and if broken, to the Major Support for Trend Reversal (25,239) . This creates a clean downside structure if sellers take control.
✅ Plan of Action:
• If Nifty holds within 25,356–25,404 zone and shows reversal signs → possible bounce
• Breakdown below 25,239 → could trigger trend reversal toward deeper supports
🎯 Trade Setup:
– Short below 25,356 with confirmation
– Target: 25,239 → 25,100
– Long only if bullish structure holds within support zone
– SL: Above 25,404 (for shorts)
📘 Tip: Avoid averaging down. If price bounces near 25,239, wait for reversal signal to confirm buyer interest.
📌 KEY ZONES TO TRACK:
🔴 Resistance Zone: 25,690 (Last Resistance — potential exhaustion)
🟧 Opening Support Zone: 25,404 – 25,356
🟩 Trend Reversal Support: 25,239
💡 OPTIONS TRADING & RISK MANAGEMENT TIPS:
✅ Use Vertical Spreads (Bull Call / Bear Put) in directional setups to reduce premium risk
✅ Avoid trading in overlapping zones unless a clear breakout occurs
✅ Don’t hold naked options near expiry without clear trend — use spreads
✅ Protect your capital : Never risk more than 1.5–2% of total capital per trade
✅ SL must always be respected based on candle close
✅ Keep tracking OI shifts and IV spikes — adjust strikes if momentum fades
🔍 SUMMARY:
• 🔼 Bullish Above: 25,690 → Scope for new high
• ⚠️ Flat Opening Zone: 25,530 – 25,474 → Wait and watch
• 🔽 Bearish Below: 25,404 → Breakdown may extend
• 🛑 Trend Shift Point: 25,239 — strong support, if breached = caution
⚠️ DISCLAIMER:
I am not a SEBI-registered advisor. This plan is purely for educational purposes. Please consult your financial advisor before acting on any trade ideas. Always use proper position sizing, stop-loss, and risk controls to protect your capital.
Nifty - Intraday levels & Prediction for - 27 Jun 2025Nifty Prediction for Tomorrow:
Trend : Sideways to Moderately BULLISH
Sentiment : Positive
Expectation : Nifty will fill 25640 - 25740 Gap tomorrow after some consolidation.
Look for Buy/Sell at Demand and Supply zone for profitable trades.
Demand and Supply Zones - When price breaks the zone, Demand zone will become Resistance and Supply zone will become Support. If Nifty Sustains above 24900 tomorrow we can see good rally upto 25080 Resistance. Any breakout above 25100 and next resistance 25200
Refer the chart for detailed Intraday Support and Resistance levels.
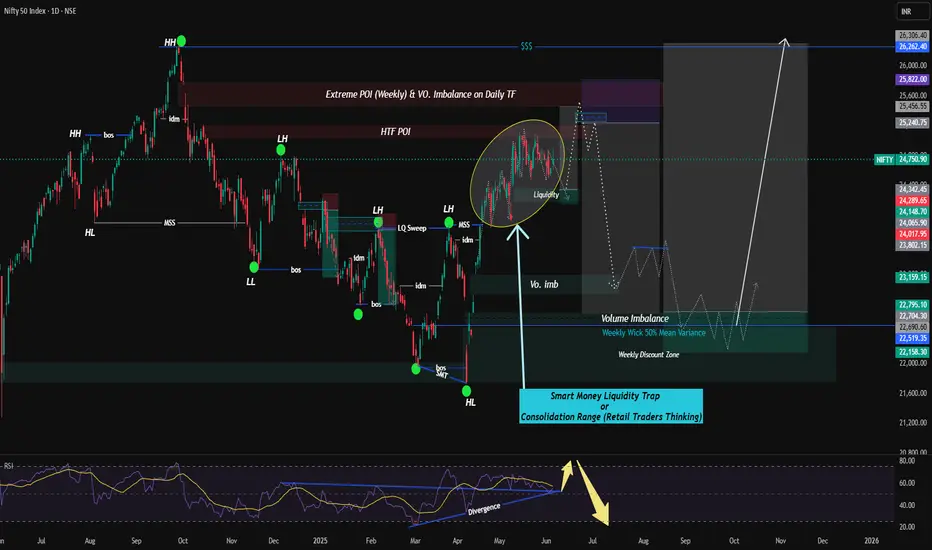
Nifty Analysis - Smart Money Concepts or LiquidityI would like to present my Nifty Analysis based on Liquidity or Smart Money Concepts.
This Analysis is based on Multi-time frame (Weekly & Daily) Time Frame. here chart is used on Daily Time Frame.
Current Scenario - (Weekly TF Analysis)
==Weekly Time Frame Analysis -
The current move is retracing into a weekly POI zone which also has-
-Daily Imbalance
-HTF Supply Block
-Smart Money Trap Zone (marked)
Right now, HTF is still in broad bearish retracement structure.
==Daily TF Annalysis -
-Price is consolidating in a range within a clearly defined HTF POI (High Probability Reversal Area)
-Inside the range:
-Multiple internal BOS & MSS
-Clean liquidity pool build-up (marked in yellow)
-Potential for buy-side liquidity sweep followed by sell-off into discount
Price Projection & Bias -----
1. Short-Term Bias (Next 3–5 Weeks): Downside after Extreme POI liquidity grab
-Expectation is there will be a Fakeout above the liquidity pool (25,500–25,800), or in retail language say it is Stop Loss Hunt then sell-off.
-Target: Volume Imbalance near 23,200–22,700.
-This will be aligned with - Liquidity sweep , Mitigation of volume imbalance , Entry into Weekly Discount Zone.
2. Mid-Term Bias or say 2-3 months expectation (After Re-accumulation)
-If price reacts with storng bullish order flow from 22500-22000 range then expect -
-Reversal into bullish structure
-Target - 26200 or 26400
-Supported by mean reversion + reaccumulating idea
(For Entry Module)
- Consider 15min to 1 hour Time frame setup for confirmation before taking shorts from above supply zone.
- expect a long setup around 22200-22400 only if bullish BOS + FVG Filled and also consider HTF Liquidity sweep near weekly wick discount zone or say 50% mean reversion.
Disclaimer -- (Views are only for Educational Purpose only. Always consult your financial Advisor before doing Any Investments).
Your Views or Comments are welcomed.
Nifty 50 Intraday Trade Plan for June 27, 2025✅ Bullish Trade Plan (Call Option / CE)
Above 25478 hold
🔹 Level: Above Opening S1 10m Hold CE By level
🔸 Action: Buy CE if price sustains above this level
🔸 Target 1: 25,638 – Above 10M hold positive trade view
🔸 Target 2: 25,770 – Above 10m hold CE by entry level
🔸 Target 3: 25,880 – Below 10m hold PE by Safe Zone
🔸 Target 4: 25,900 – Above 10m Closing Shot cover level
❌ Bearish Trade Plan (Put Option / PE)
Below 25,638
🔹 Level: Below Opening R1 10m Hold PE By level
🔸 Action: Buy PE if price falls below this level
🔸 Target 1: 25,378 – Below 10m hold PE By level
🔸 Target 2: 25,178 – Above 10M hold CE By Safe Zone level

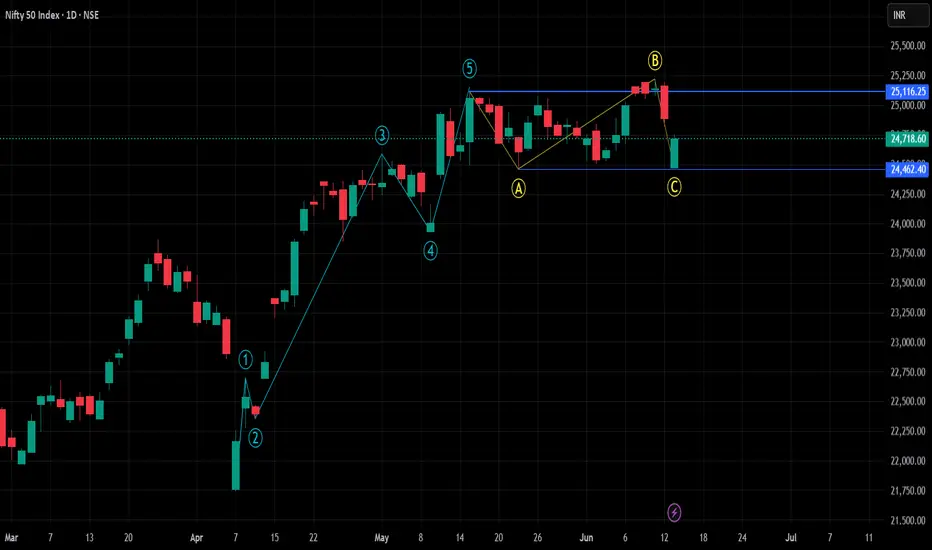
Nifty 50 Daily Wave Count - Trend - PatternHi, friends
Today we saw negative gap down opening and market recover very positively after a one deep.
But at the end of the day Nifty index gave negative close.
After impulsive move , we can see running flat type of corrective pattern that follows the 3-3-5 wave structure. It's similar to an expanded flat, where Wave B extends beyond the start of Wave A, but unlike the expanded flat, Wave C fails to reach the end of Wave A. This means the price retraces beyond the 100% level of Wave A in Wave B, but the subsequent Wave C doesn't complete the correction by exceeding Wave A's end point.
here i am assuming wave c is over . here i marked bottom of wave A, if low of wave A breaks then the running flat pattern will be invalided.
NIFTY Levels For Intraday (Educational Purpose) 29/06/2025📊 Nifty Intraday Plan (for 1-Min Chart Traders) – 26th June
🟢 Gap-Up Opening Strategy
✅ Buy above: 25,270
🎯 Targets: 25,320 / 25,380
🛑 SL: 25,210
⚠️ Avoid entry if no strong volume or if price gets rejected near 25,300.
🔴 Gap-Down Opening Strategy
✅ Sell below: 25,180
🎯 Targets: 25,120 / 25,050
🛑 SL: 25,240
⚠️ Avoid selling if Nifty holds above 25,200 after 15 mins.
📍 Use 1-min chart with candle + volume confirmation.
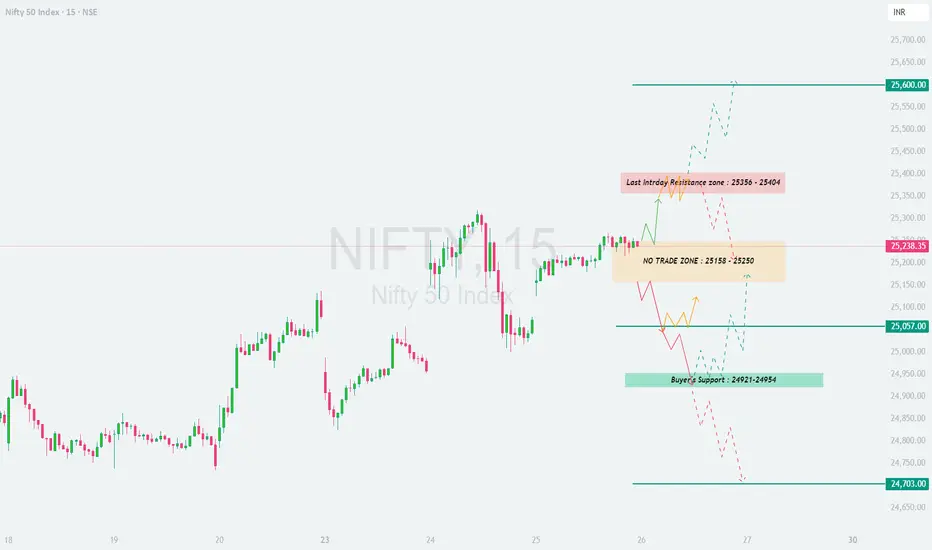
NIFTY : Trading levels and Plan for 26-Jun-2025\ 📈 NIFTY TRADING PLAN – 26-Jun-2025\
📍 \ Previous Close:\ 25,238
📏 \ Gap Opening Consideration:\ ±100 points
🕒 \ Chart Timeframe:\ 15-Minutes
🧩 \ Strategy Focus:\ Zone-based reaction + Breakout/Breakdown with confirmation
---
\
\ \ 🚀 GAP-UP OPENING (Above 25,356):\
If Nifty opens 100+ points above and trades above \ 25,356\ , it will directly enter the \ Last Intraday Resistance Zone (25,356 – 25,404)\ . Sustained strength above this zone could trigger a move toward the upper resistance at \ 25,600\ .
✅ \ Plan of Action:\
• Observe price reaction near 25,404 — look for rejection or breakout
• If breakout sustains with volume, trend continuation possible
• A rejection here might signal intraday reversal or consolidation
🎯 \ Trade Setup:\
– Long above 25,404 with confirmation
– Target: 25,600
– SL: Below 25,356
– Short only if clear rejection occurs below 25,356 with volume
📘 \ Pro Tip:\ Don’t jump into trades immediately post open — let the first 15-minute candle confirm the bias.
\ \ ⚖️ FLAT OPENING (Between 25,158 – 25,250):\
This region is marked as \ NO TRADE ZONE\ , where indecision and false moves are more likely. Trapped buyers/sellers from previous sessions often create sideways or volatile price action here.
✅ \ Plan of Action:\
• Avoid trading within this zone
• Wait for a breakout above 25,250 or a breakdown below 25,158
• Entry only after 15–30 minutes of trend confirmation
🎯 \ Trade Setup:\
– Long above 25,250 → Target: 25,356
– Short below 25,158 → Target: 25,057
– SL: Outside of range boundary
📘 \ Pro Tip:\ Protect your capital — “no trade” is also a strategy. Trade only when structure forms outside the zone.
\ \ 📉 GAP-DOWN OPENING (Below 25,057):\
Opening below the \ Opening Support (25,057)\ brings the \ Buyer’s Support Zone (24,921 – 24,954)\ into focus. A reversal bounce or further breakdown will depend on early price action around this zone.
✅ \ Plan of Action:\
• Look for bullish candles or wicks from 24,921 zone for potential intraday reversal
• If breakdown below 24,921 occurs, expect move toward \ 24,703\
• Be cautious during volatile flushes in first 5–10 mins
🎯 \ Trade Setup:\
– Long only on strong reversal at 24,921–24,954
– Short below 24,921 with momentum
– Target: 24,703
– SL: Tight SL below support for longs or above resistance for shorts
📘 \ Pro Tip:\ Lower supports attract buying interest — ideal for low-risk reversals, but only with confirmation.
---
\ 📊 KEY LEVELS TO WATCH:\
🟧 \ NO TRADE ZONE:\ 25,158 – 25,250
🟥 \ Resistance Zone:\ 25,356 – 25,404
🟢 \ Opening Support:\ 25,057
🟦 \ Buyer’s Support Zone:\ 24,921 – 24,954
🔻 \ Breakdown Support:\ 24,703
---
\ 🛡️ OPTIONS TRADING & RISK MANAGEMENT TIPS:\
✅ Use \ Bull Call Spreads\ above resistance to reduce premium decay risk
✅ In sideways zones, prefer \ Iron Condors or Short Straddles\ (only if IV is high)
✅ Avoid naked OTM options inside no trade zone – theta kills premium
✅ Never chase after missed trades – wait for next setup
✅ SL should always be based on \ 15-min closing candles\
✅ Maintain risk per trade ≤ \ 2% of capital\
---
\ 📌 SUMMARY:\
• 🔼 \ Bullish Above:\ 25,404 → Next stop: 25,600
• ⛔ \ Avoid trading inside:\ 25,158 – 25,250
• 🔽 \ Bearish Below:\ 25,057 → Watch 24,921
• 🧲 \ Reversal or flush below:\ 24,921 → Can test 24,703
---
\ ⚠️ DISCLAIMER:\
I am not a SEBI-registered advisor. All trade setups shared are for educational purposes only. Always perform your own analysis or consult a financial expert before entering any trades. Use strict stop-loss and adhere to risk management at all times.
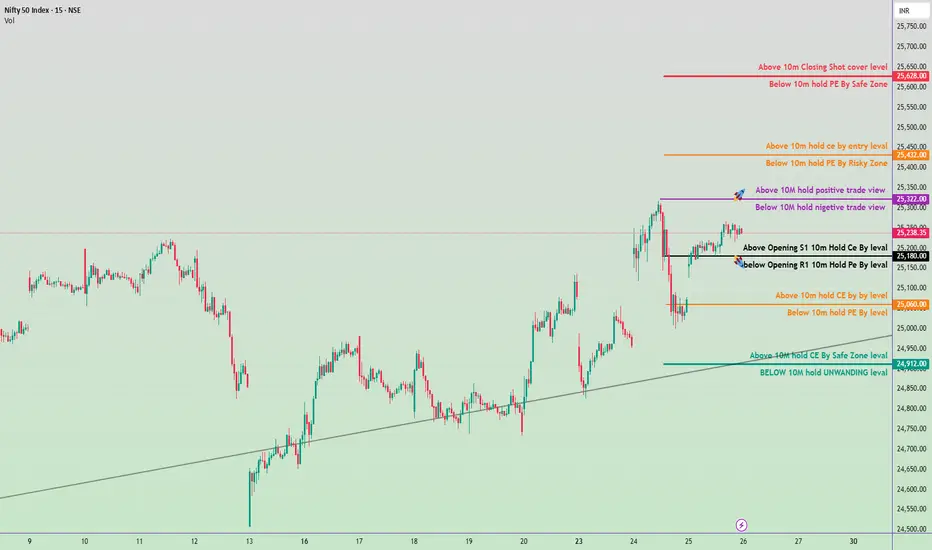
June 26, 2025 Nifty 50 breakout & breakdawon Levals✅ Bullish View Zones:
(Call Option CE Focus)
Above 25,630 – 10m Closing Shot cover level
Above 25,432 – 10m hold CE by Entry level
Above 25,322 – 10M hold: Positive trade view
Above 25,180 – Opening S1 + 10m hold CE by level
Above 25,060 – 10m hold CE by level
Above 24,912 – 10M hold CE by Safe Zone level
❌ Bearish View Zones:
(Put Option PE Focus)
Below 25,630 – 10m hold PE by Safe Zone
Below 25,432 – 10m hold PE by Risky Zone
Below 25,322 – 10M hold: Negative trade view
Below 25,180 – Opening R1 + 10m hold PE by level
Below 25,060 – 10m hold PE by level
Below 24,912 – 10M hold UNWINDING level
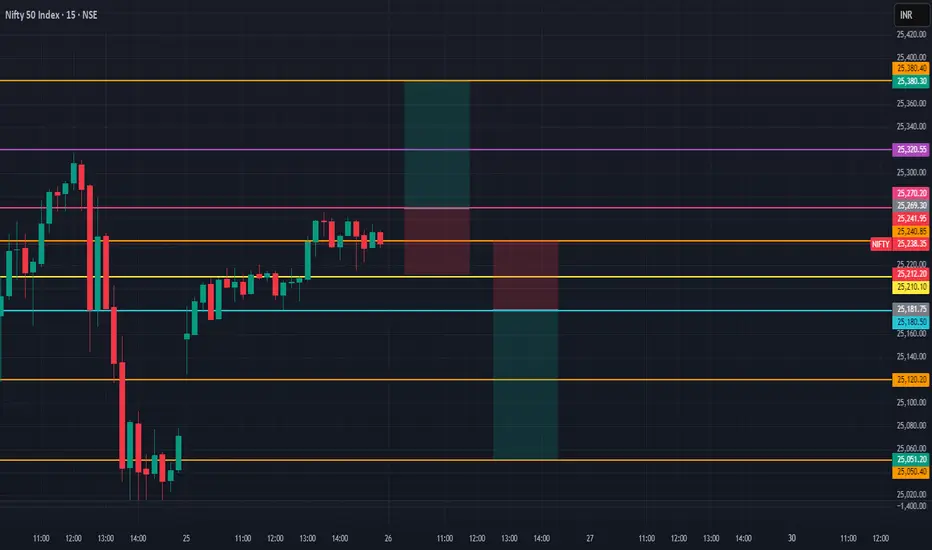
NIFTY Levels For Intraday ( Educational Purpose) 25/06/2025📊 Nifty Intraday Strategy – 25.06.2025
🔎 Structure: 15-min | Execution: 1-min
🔼 Buy Above: 25,110
🎯 Target: 25,180 / 25,240
🛑 SL: 25,060
🔽 Sell Below: 24,980
🎯 Target: 24,920 / 24,860
🛑 SL: 25,030
📈 Gap-Up Opening:
▪️ Wait near 25,180–25,240 zone
▪️ Avoid long entries until rejection or breakout confirmation (1-min + volume)
📉 Gap-Down Opening:
▪️ Watch 24,900–24,860 for reversal
▪️ Go long only after bullish engulfing / strong 1-min candle with volume
⚠️ Do’s & Don’ts:
✅ Use 1-min for trigger after breakout
❌ Don’t jump in first 5 mins
✅ Maintain 1:2 risk-reward
🚫 Avoid trading during news spike
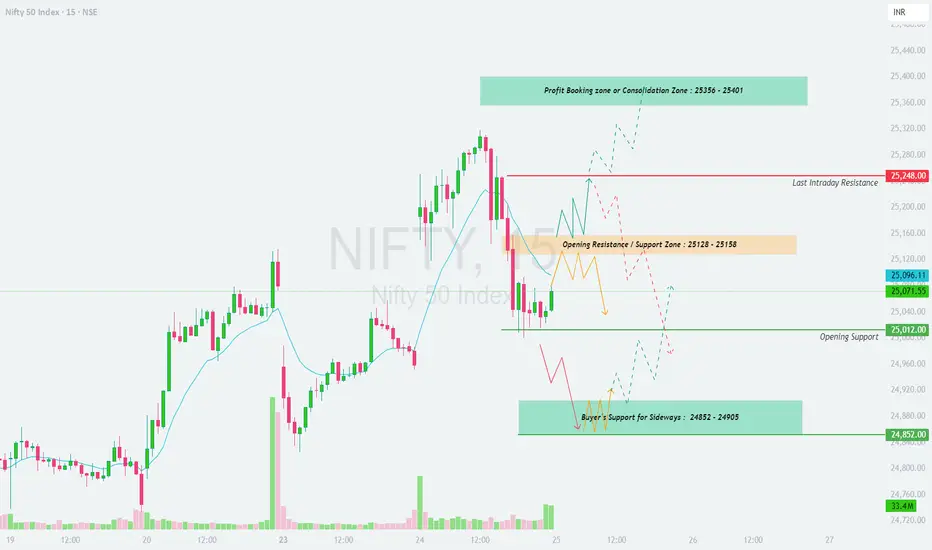
NIFTY : Trading levels and Plan for 25-Jun-2025\ 📊 NIFTY TRADING PLAN – 25-Jun-2025\
📍 \ Previous Close:\ 25,071.55
📏 \ Gap Opening Consideration:\ ±100 Points
🕒 \ Time Frame Analyzed:\ 5-Min Chart
📦 \ Volume Check:\ 9.16M (aiding intraday trend confirmation)
---
\
\ \ 🚀 GAP-UP OPENING (Above 25,148):\
If Nifty opens above the \ Opening Resistance Zone (25,128 – 25,158)\ , it immediately faces \ Last Intraday Resistance\ at \ 25,248\ . Sustained buying above this level may push prices toward the \ Profit Booking / Consolidation Zone (25,356 – 25,401)\ .
✅ \ Plan of Action:\
• Avoid jumping in at open — let first 15–30 minutes settle the tone
• Breakout above 25,248 = clear bullish structure
• Watch for profit booking at 25,356–25,401
🎯 \ Trade Setup:\
– Long above 25,248 with volume confirmation
– Target: 25,356 → 25,401
– SL: Below 25,158
– Short only if rejection seen near 25,248–25,356
📘 \ Pro Tip:\ Book partial profits at 1st target and trail rest.
\ \ ⚖️ FLAT OPENING (Between 25,012 – 25,128):\
This is a reaction zone where Nifty may oscillate inside the \ Opening Resistance/Support Band\ . Directional clarity may only come post breakout from this zone.
✅ \ Plan of Action:\
• Avoid early trades inside 25,012–25,128 zone
• Break above 25,128 = upside momentum
• Breakdown below 25,012 = weakness
🎯 \ Trade Setup:\
– Long above 25,128 (strong bullish candle)
– Short below 25,012 (bearish breakdown confirmation)
– SL: 30–40 pts from entry depending on volatility
– Prefer confirmation candle with decent volume
📘 \ Pro Tip:\ Stay flexible — it may be a sideways trap if no breakout happens in the first 45 mins.
\ \ 📉 GAP-DOWN OPENING (Below 24,912):\
Gap-downs below \ Opening Support (25,012)\ could test the critical \ Buyer’s Support for Sideways Zone – 24,852 to 24,905\ . This is a make-or-break area for the bulls.
✅ \ Plan of Action:\
• Observe price behavior near 24,852
• Reversal from here offers intraday long opportunity
• Breakdown confirms bearish pressure
🎯 \ Trade Setup:\
– Long near 24,852 (if bullish candle forms)
– Short below 24,852 (breakdown scenario)
– Target: 24,780 / 24,720
– SL: Above 25,012 for shorts, below 24,830 for longs
📘 \ Pro Tip:\ This is where "smart money" often plays — watch candle structure, not emotions.
---
\ 💡 OPTIONS TRADING – RISK MANAGEMENT TIPS:\
✅ \ 1. Avoid buying options near expiry without confirmation; theta will eat premiums fast.\
✅ \ 2. Use spreads (like bull call or bear put) in choppy markets.\
✅ \ 3. Always use Stop Loss based on structure — not emotions or PnL.\
✅ \ 4. Keep risk per trade below 2% of capital.\
✅ \ 5. Use 15-min chart candle closing to exit on SL breach.\
---
\ 📌 SUMMARY – LEVELS TO MONITOR:\
🟥 \ Last Intraday Resistance:\ 25,248
🟧 \ Opening Resistance/Support:\ 25,128 – 25,158
🟩 \ Opening Support:\ 25,012
🟦 \ Sideways Support Zone:\ 24,852 – 24,905
🟫 \ Breakdown Confirmation Target:\ Below 24,852 → 24,780
---
\ 🎯 CONCLUSION:\
• 🔼 \ Bullish Bias:\ Only above 25,248 with strength
• ⏸️ \ Sideways Bias:\ 25,012–25,128 — avoid unless breakout confirmed
• 🔽 \ Bearish Bias:\ Below 25,012 → Eyes on 24,852
\ ⚖️ Discipline + Risk Management > Prediction!\ Stay aligned with price structure and manage your capital smartly. 💰🧠📉
---
\ ⚠️ DISCLAIMER:\
I am not a SEBI-registered analyst. This analysis is purely educational and intended to assist in structured thinking. Please consult your financial advisor before acting on any trading decisions. Always apply strict stop-loss and position sizing.
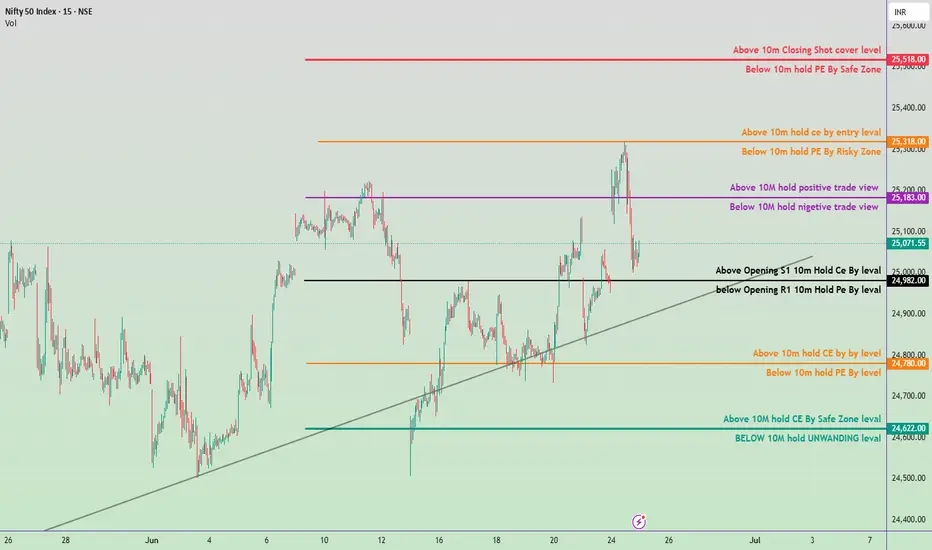
June 25, Nifty 50 intraday trade plan for tomorrow✅ Bullish Zones (Call Buyer Favorable):
🔺 Above 25,518
→ Closing short-covering level
Strong breakout / upside momentum
🟧 Above 25,318
→ 10M hold CE by entry level
Safe CE entry zone
🟪 Above 25,183
→ Positive trade view zone
⚫ Above 24,982
→ Opening S1 CE hold level
🟩 Above 24,622
→ Safe zone for CE buying
❌ Bearish Zones (Put Buyer Favorable):
🔻 Below 25,518
→ Safe zone for PE buyers
🟧 Below 25,318
→ Risk zone for PE buyers
🟪 Below 25,183
→ Negative trade view zone
⚫ Below 24,982
→ Opening R1 PE hold level
🟧 Below 24,780
→ 10M PE hold level
🟦 Below 24,622
→ Unwinding zone – Weak market signal
📊 Tomorrow’s Trading Strategy
Opening Above 25,183
Look for CE Buying Opportunities.
Target 25,318 → 25,518.
Opening Between 25,071–24,982
Neutral to cautious zone.
Wait for price action confirmation near key levels.
Opening Below 24,780
Look for PE Buying or CE Selling.
Possible test of 24,622 → 24,500 zone.
Trendline Support Near 24,850
If broken, expect downside acceleration.
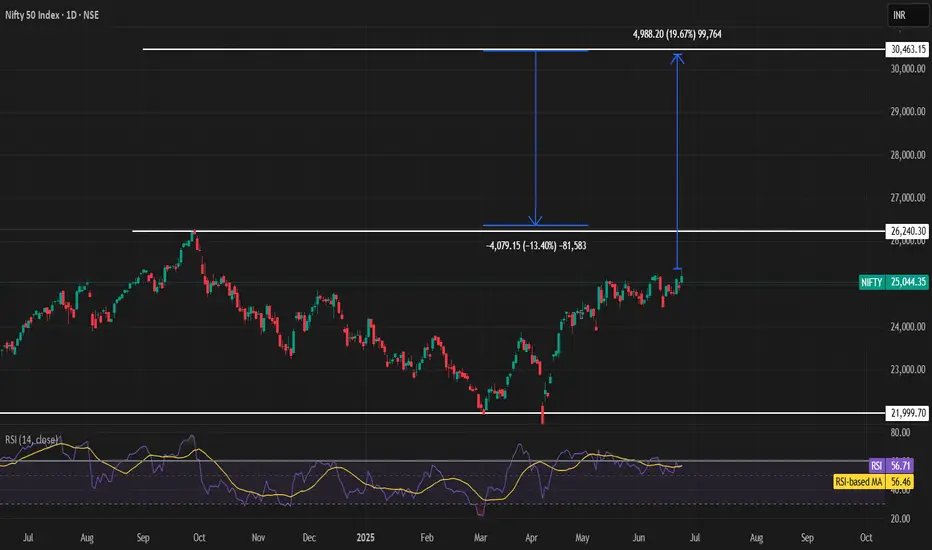
Nifty positional target of 30,000In my view, if Nifty breaks above the 26,260 level and manages to close above it, we can expect a positional target of 30,000. Please stay calm and avoid panic. Trade with discipline and follow me for more free ideas.
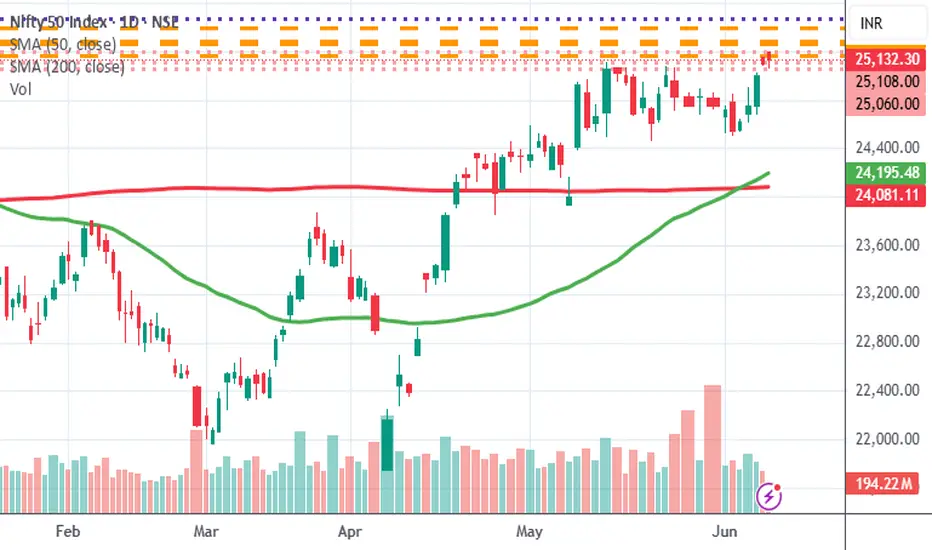
Nifty Likely to test 25260 - Set up in progressWatching Nifty as it forms a rising channel on the daily chart. If current momentum sustains, we may see a move forward 25,260 in the coming sessions.
Nifty Intraday Levels (Educational purpose) 24/06/2025📈 NIFTY Intraday Levels
🟢 Opening: 25,179.90
📊 Trend Bias: Bullish continuation with possible profit booking
🔼 Buy Above: 25,220
🎯 Targets: 25,280 / 25,350
🛑 SL: 25,140
🔽 Sell Below: 25,100
🎯 Targets: 25,040 / 24,980
🛑 SL: 25,180
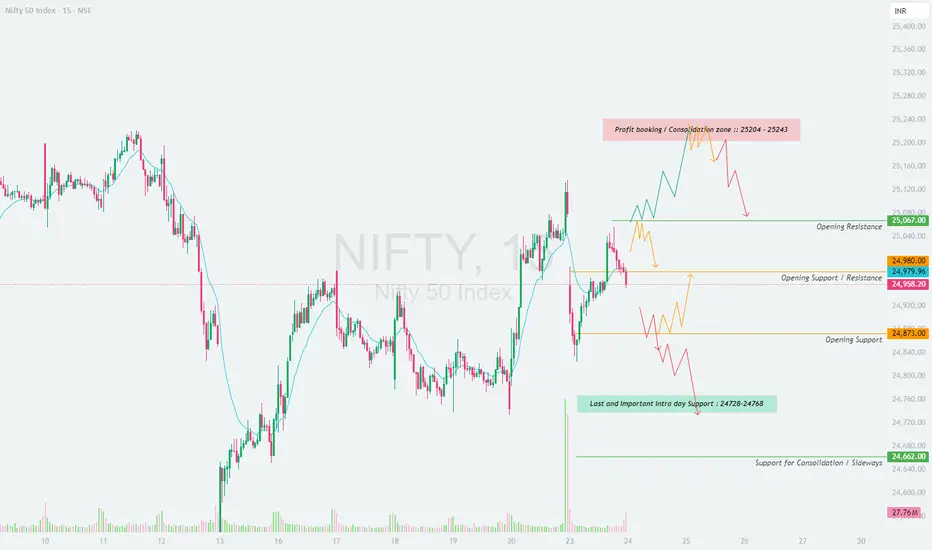
NIFTY : Trade plan and level for 24-Jun-25
\ 📈 NIFTY 50 TRADING PLAN – 24-Jun-2025\
📍 \ Previous Close:\ 24,958.20
📏 \ Gap Threshold:\ 100+ points
🕒 \ Chart Timeframe:\ 15-min
---
\
\ \ 🚀 GAP-UP OPENING (Above 25,087):\
If Nifty opens above the \ Opening Resistance at 25,087\ , it would enter the red zone labeled \ Profit Booking / Consolidation Zone :: 25,204 – 25,243\ .
✅ \ Plan of Action:\
• Wait for 15–30 minutes to check if the price sustains above 25,087.
• If the price shows strength and crosses 25,204, it can trigger a short-term bullish move up to 25,243+.
• However, if the index shows a reversal in the red zone, profit booking may trigger a pullback to 25,087.
🎯 \ Trade Setup:\
– Buy on breakout + sustain above 25,204
– Target: 25,243–25,275
– SL: 25,080
– OR wait to short near 25,243 if reversal pattern forms
📘 \ Pro Tip:\ Avoid aggressive longs in the consolidation zone. Better to trade with breakout confirmations.
\ \ 📘 FLAT OPENING (Between 24,980 – 25,087):\
A flat opening puts Nifty in a narrow decision zone between \ Opening Resistance (25,087)\ and \ Opening Support/Resistance flip zone (24,980)\ .
✅ \ Plan of Action:\
• Avoid trading inside this range initially as volatility traps are common.
• A breakout above 25,087 = bullish continuation.
• Breakdown below 24,980 = early signs of weakness toward lower support levels.
🎯 \ Trade Setup:\
– Buy above 25,087 with volume
– Sell below 24,980 only if price sustains
– SL: 15–25 pts depending on entry type
📘 \ Pro Tip:\ Do not anticipate the breakout or breakdown—wait for confirmation and volume spikes to participate.
\ \ 📉 GAP-DOWN OPENING (Below 24,873):\
A gap-down below \ Opening Support (24,873)\ pushes Nifty into weaker terrain. The next reliable demand zone is the \ Last Important Intraday Support: 24,728–24,768\ .
✅ \ Plan of Action:\
• Look for price behavior near 24,728–24,768.
• If this zone holds, expect a bounce back toward 24,873
• If it breaks, downside may extend to \ Support for Consolidation / Sideways at 24,662\
🎯 \ Trade Setup:\
– Sell on breakdown below 24,728
– SL: 24,775
– Buy only if strong bullish reversal pattern forms around 24,728
📘 \ Pro Tip:\ Gap-down trades are riskier—patience pays. Avoid trading the first candle. Let sentiment unfold.
---
\ 💡 OPTIONS RISK MANAGEMENT TIPS:\
✅ \ 1. Avoid buying options inside tight ranges or sideways zones\
✅ \ 2. Use spreads (like Bull Call or Bear Put) when IV is high or near resistance zones\
✅ \ 3. Exit positions on major reversal signals or key levels break\
✅ \ 4. Always use stop-losses and pre-defined capital exposure per trade\
✅ \ 5. Don't overtrade on volatile days. Sit out if unclear!\
---
\ 📌 SUMMARY – KEY LEVELS FOR 24-Jun-2025:\
🔺 \ Profit Booking Zone:\ 25,204 – 25,243
🟥 \ Opening Resistance:\ 25,087
🟧 \ Opening Support/Resistance Flip:\ 24,980
🟨 \ Opening Support:\ 24,873
🟩 \ Key Intraday Support:\ 24,728 – 24,768
🟦 \ Lower Demand Zone:\ 24,662
---
\ 📚 CONCLUSION:\
• 🔼 \ Above 25,204:\ Bulls may extend to 25,243+
• ⏸ \ Between 24,980–25,087:\ Volatile – wait for clarity
• 🔽 \ Below 24,873:\ Bearish tone, support at 24,728
Patience and precision are more valuable than prediction. Wait for confirmation, and always protect your capital. 🎯📉📈
---
\ ⚠️ DISCLAIMER:\
I am not a SEBI-registered analyst. This trading plan is prepared purely for educational purposes. Please consult your financial advisor before taking any trades based on this information. Trade responsibly and with proper risk management.
Nifty - Intraday levels & Prediction for - 24 Jun 2025Nifty Prediction for Tomorrow:
Trend : BULLISH
Sentiment : Positive
Expectation : Nifty made Bullish Harami candle today, with strong Buying momentum. So Nifty likely to open Gap up tomorrow and rally continuation. If Nifty Sustains above 25080 for 15m we can see Stron uptrend upto 25300 / 25500 levels..
Look for Buy/Sell at Demand and Supply zone for profitable trades.
Demand and Supply Zones - When price breaks the zone, Demand zone will become Resistance and Supply zone will become Support. If Nifty Sustains above 24900 tomorrow we can see good rally upto 25080 Resistance. Any breakout above 25100 and next resistance 25200
Refer the chart for detailed Intraday Support and Resistance levels.
NIFTY 24400 is TARGET!!!!!nifty is breaking levels in daily timeframes.
Now it starts to break in hourly as shown in the charts.
Past week nifty is so bullish , but I view this as a manipulation.
So my expectations from my experience is 24400 by this/or next week.
This is totally my view only , not a financial advise.
Thank you for reading this.

NIFTY Index Intraday Levels(For Educational purpose) 23/05/2025📈 Nifty Intraday Trade Setup – 23/06/2025 (Monday)
🕒 Timeframe: 1-Min Chart
📊 Market Outlook: Volatile with directional bias
🔼 Buy Above: 25,150 (with strong volume)
🎯 Target 1: 25,220
🎯 Target 2: 25,300
🛑 Stop Loss: 25,070
⚠️ Entry only after 5-min candle closes above 25,150
🔽 Sell Below: 24,960 (on breakdown)
🎯 Target 1: 24,880
🎯 Target 2: 24,800
🛑 Stop Loss: 25,040
⚠️ Only if price fails to hold 25,000 zone
📍 Key Levels to Watch:
🔹 Resistance: 25,150
🔹 S/R Flip Zone: 25,000 – 25,040
🔹 Support: 24,880 – 24,800
🔹 Demand Zone: 24,680
📌 Pro Tips:
✅ Watch opening 15 mins carefully
✅ Use VWAP & EMA (20/50) for trend confirmation
✅ Trade with discipline, not emotion
