Nifty daily analysis for 13/09/23.After a gap up opening, there was a profit booking and market consolidated as it has already stretched alot and it may take a halt or market may become volatile.
On the hourly charts, there was profit booking in the first hour and market remained inside the candle whole day closing almost flat.
Nifty has hit a new ATH and there should be a halt or a retracement before carrying on with the bullish momentum.
Markets can't just go up without any rest or retracement and after a movement there will be a sideway to volatile market. Watch the market to consolidate or retest the lower support levels.
On 15 minute time frame, market has near to the 20 ema and is taking resistance from the round number figure of 20k.
Support :- 19920-50, 19860
Resistance :- 20020, 20110(ATH)
Wait for the price action near the levels before entering the market.
Niftyview

Nifty levels - Sep 13, 2023Nifty support and resistance levels are valuable tools for making informed trading decisions, specifically when combined with the analysis of 5-minute timeframe candlesticks and VWAP. By closely monitoring these levels and observing the price movements within this timeframe, traders can enhance the accuracy of their entry and exit points. It is important to bear in mind that support and resistance levels are not fixed, and they can change over time as market conditions evolve.
The dashed lines on the chart indicate the reaction levels, serving as additional points of significance to consider. Furthermore, take note of the response at the levels of the High, Low, and Close values from the day prior.
We hope you find this information beneficial in your trading endeavors.
* If you found the idea appealing, kindly tap the Boost icon located at the bottom right. We encourage you to share your thoughts and comments regarding it.
Wishing you success in your trading activities!

NIFTY 12.09.2023 LEVELS..Nifty Spot : 19936.35
Dear Followers Kindly Don't Take Any Buy or Sell Trades Today... Please Watch My Option STRIKES & Level One Week.
Draw The Lines Buy, Sl, T1 to T5 Lines In Your Broker Application
Trailing Purpose Only.
Option Strike : 19800 CE
Buy At : 106, Sl : 95, Next Sl : 63
Target : 132
Target : 159
Target : 185
Target : 212
Target : 238
Target : 264
Target : 291
Target : 317
Option Strike : 19800 PE :
Buy At : 74, Sl : 67, Next Sl : 45
Target : 93
Target : 111
Target : 130
Target : 149
Target : 167
Target : 186
Target : 204
Target : 223
Every Target Point Is An New Buy Entry. First You Conform The Trend..
Market Goes Uptrend Or Downtrend. Then Only You Entre CE or PE Strike.
If You Enter... Stop Loss is Below The Entry 15 To 25 Points.. Otherwise You Loss The Money.
Kindly Watch My Break Even Point. Every Day.
Above The Break Even Point UPTREND Starts
Below The Break Even Point DOWNTREND Starts.
Don"t Enter Blindly.

#nifty"Good morning! As of September 12th, There is no significant difference between the last session. Global market sentiment is positive, based on the Dow Jones alone. The market trend is bullish, and there is a possibility that the market might open with a gap-up. If the gap-up sustains, we can expect the rally to continue with minor corrections. On the other hand, if the gap-up doesn't hold, we can anticipate a minor correction."

Nifty Intraday Trade Setup | 12th SepExpectations: Volatile Day
Intraday Levels:
Buy Above - 20020
Sell Below - 19910
To motivate us, Please like the idea If you agree with the analysis.
Happy Trading!
InvestPro India Team

HINDUNILVR DAILYLOOKS GOOD.
Hindustan Unilever Limited (HUL) is a British-owned Indian consumer goods company headquartered in Mumbai. It is a subsidiary of the British company Unilever. Its products include foods, beverages, cleaning agents, personal care products, water purifiers and other fast-moving consumer goods (FMCGs).
ONLY FOR EDUCATIONAL PURPOSE.

11 Sep ’23 Post Mortem on Nifty - @20000 a day to remember 🎇🎇Nifty Analysis
Recap from yesterday: For Monday I wish to change the status from bullish to 50% bullish & 50% neutral — that’s because I would like to wait for this news flow to get priced in. The euphoria and FOMO alone should drive Nifty50 to new ATHs, however I do not wish to get into new bullish positions till then.
The 50% neutral, 50% bullish stance was taken to give some time for the traders to digest the I-CRR news. Seems like nobody was interested to wait. As soon as we opened - the intention to go up was very clear - how so? Just look at the OTM put prices. All the signs of aggressive put writing with near ATM credit and far OTM debit. Since this pattern was holding throughout the day, I personally went ahead with some long positions.
In today’s price action, there were no reversal or pullback attempts and all the sectors were in green - a rarity usually. And as per DOW theory - if all the sectors are in green - its a true indicator of trend.
On the 1hr TF - just notice the pace at which Nifty50 regained the lost points. It took 42 days and 1hr for Nifty to fall from 19991 to 19223 and just 10 days & 6 hrs to regain it. Which also indicates its a structural bull market.
For tomorrow I wish to continue with the bullish stance, although I would like to take some safety net via long PUTS as we have the CPI (Inflation) data coming up this week.

Nifty daily analysis for 12/09/23.A new ALL TIME HIGH for Nifty today.
The market were looking bullish from the very first minute and finally crossed the 20k level in the last hour of the trading session.
Nifty has travelled to 20 k levels from 19300 levels and now it can take a halt before crossing the level. It has formed a marubozu candle and has closed near the round figure level.
On the hourly charts, the market is trading above the moving averages and has closed near the day high.
While the nifty is at its ATH there is no resistance and the levels for the resistance are taken by the fibonacci levels.
Support :- 19930, 19865
Resistance :- 19200, 19310
Wait for the price action near the levels before entering the market.

Nifty levels - Sep 12, 2023Nifty support and resistance levels are valuable tools for making informed trading decisions, specifically when combined with the analysis of 5-minute timeframe candlesticks and VWAP. By closely monitoring these levels and observing the price movements within this timeframe, traders can enhance the accuracy of their entry and exit points. It is important to bear in mind that support and resistance levels are not fixed, and they can change over time as market conditions evolve.
The dashed lines on the chart indicate the reaction levels, serving as additional points of significance to consider. Furthermore, take note of the response at the levels of the High, Low, and Close values from the day prior.
We hope you find this information beneficial in your trading endeavors.
* If you found the idea appealing, kindly tap the Boost icon located at the bottom right. We encourage you to share your thoughts and comments regarding it.
Wishing you success in your trading activities!

Big Bears to start Party soon Nifty almost completed double correction at 19991.
Very few will agree with the count but this is what I am expecting now.
Nifty should start travelling towards south anytime soon.
This time it will start a big bear cycle which is likely to continue for next 1 year (atleast).
No overnight longs with index is suggested.
Will update if this wave counting gets invalidated.
Let the bear party begins.
All the best.

#nifty"Good morning! As of September 11th, global market sentiment is slightly positive, based on the Dow Jones alone. The market trend is bullish, and there is a possibility that the market might open with a slight gap-up. If the gap-up sustains, we can expect the rally to continue with minor corrections. On the other hand, if the gap-up doesn't hold, we can anticipate a minor correction."

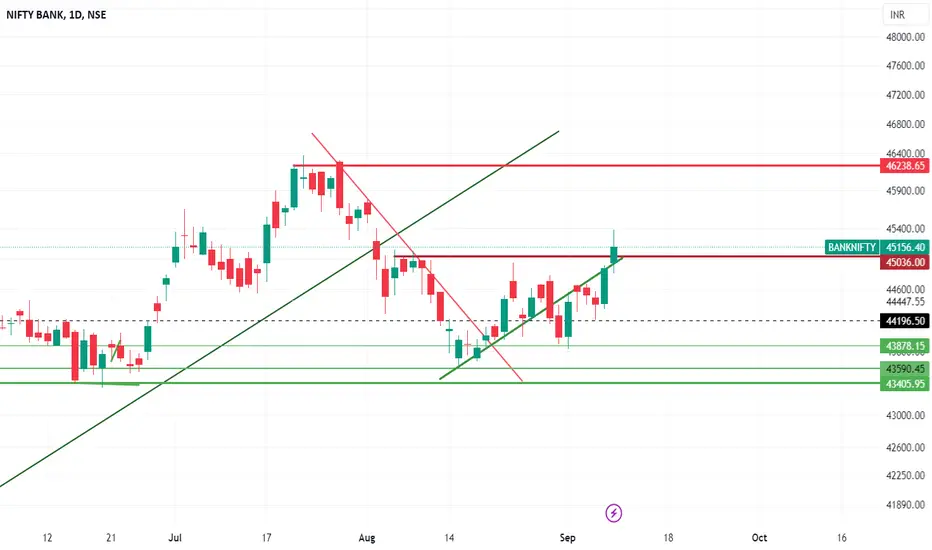
Bank Nifty Daily analysis - 1D chartThe Bank Nifty has found strong support at the 45,000 level and is making its way toward the 46,000 range, indicating an upward trend in the Indian market. If the Bank Nifty continues to exhibit strength over the next two to three trading sessions, it could drive the Nifty index to reach new all-time highs, accompanied by increased trading volumes and solid support.
However, there is a significant concern looming over this market rally, and that pertains to the decreasing value of the Indian Rupee compared to the US Dollar. Presently, the Rupee is trading approximately 0.5% lower than its historical highs, potentially leading foreign institutional investors (FIIs) to consider booking their profits. If the US Dollar continues to appreciate, and market volatility (VIX) remains low, any sudden downward movement could spell trouble for the market, potentially disrupting overall market sentiment.
Nifty weekly analysis for 11/09/23.Nifty has given a nice bullish move of 2% on the weekly charts and has closed above 19800 levels.
There is a nice bullish marubozu candle on the weekly charts and it has come after a consolidation.
On the daily charts, market hit our targets on 19850 and reversed after hitting the target and has closed 92 points high forming a doji candle on the high.
Nifty has travelled nicely giving retest and moving higher. Indian market looks bullish and there are chance of nifty reaching the recent high.
On the hourly charts, there is a bullish flag and pole pattern and market has closed above both the moving averages.
On 15 minute charts, there is a clear depiction of consolidation and breakout and how it can give big target. Nifty gave break out and consolidated and continued the up move after another consolidation.
Support :- 19805, 19740
Resistance ;- 19860, 19970-90
No major resistance is there for nifty and can retest the recent high. If the market continues to travel after breaching the ATH, it can reach 20500 levels soon.
Wait for the price action near the levels before entering the market.

Nifty Trading Plan for Second week of Sept 2023 Nifty End of Day Analysis Helps Traders to Understand the Nifty sentiment and Identify Potential Trading Opportunities for the Next Trading Day in Nifty future or Nifty option
Nifty Support
Nifty Support 1 - 19358
Nifty Support 2 - 19240
Nifty Support 3 - 19180
Nifty Resistance
Nifty Resistance 1 - 19470
Nifty Resistance 2 - 19570
Nifty Resistance 3 - 19680
Nifty Trend Signal From Open Interest Analysis
PCR ratio as per Option Chain Analysis - 1.1 ( Bullish)
Max Pain As per Option Chain Analysis - 19400
Major Resistance as Per Nifty Open Interest Analysis - 19600
Major Support as Per Nifty Open Interest Analysis - 19300
Long Opportunity in Nifty for Intraday Trading
On Friday Nifty took Support sustained above 19250 and Completed the Target of 19460
Tomorrow First Buying opportunity will be above 19360 and if the Nifty Open Gap up then the Buying opportunity will be Near 19460 or 19480
Nifty Short opportunity
As we Know Nifty just changed a short-term downtrend, so Now don't expect big downside movement till Nifty goes below 19300
If nifty Sustain below 19570 then try to buy nifty Put or Short nifty keep a small stop loss and a small target
If Nifty Goes below 19350 then Take a short trade for big targets
If you Like our Trading Plan Please Like and Share

08 Sep ’23 Post Mortem on Nifty + discontinuation of I-CRR newsNifty Analysis
Recap from yesterday “On the 1hr TF the W pattern worked out quite good. The next 2 resistance points will be 19786 and 19852 if we are continuing the breakout rally. If we were to fall the first support will be the resistance we just broke i.e. 19678 followed by 19581. For tomorrow I wish to continue my bullish stance unless the first support of 19678 is taken out in the first 2 hours.”
Let the chart not deceive you, we really went up 142pts ~ 0.72% from the low to the high and today’s low was still above yesterday’s close. Since the chart was set to “Auto” resolution on “Log” scale - the up move may not look that much.
What an impressive rally today, I assume most of the analysts would have switched their bias to the long side after yesterday’s show. Today’s outperformance was quite predictable still the near ATM call options had a humongous price swing. Option premiums usually rise when the uncertainty goes up - and seeing the rally today the price jumps in 20100, 20200, 20300 & 20500 were more than unusual. 20100 CE which closed for 5.45 yesterday opened at 6.5 and rallied upto 13.5 ~ 248% before closing at 9.35.
We took out the first resistance point by 11.15 today and touched the 2nd resistance point by 14.15 to only close lower. The 2 resistance points are highlighted in orange horizontal lines.
I was feeling quite carried away that the technical analysis was working exactly as in the script. Nifty falling in a bearish channel from 21st July and then breaking out from 1st Sep. Just today I realized the real reason behind this is the I-CRR news flow - read here. Remember the fall started when the RBI Governor announced the 10% increment in CRR in his last MPC address. Now there is news that 75% of it might be removed immediately. This was the reason the banks started rallying all of a sudden from 2pm on 6th Sep. Do you recollect the article I wrote about HDFCBK being the lone wolf fighting for banknifty?
Now you might have understood how a 41% weightage on BankNifty can make a lot of difference.
For Monday I wish to change the status from bullish to 50% bullish & 50% neutral - that's because I would like to wait for this news flow to get priced in. The euphoria and FOMO alone should drive Nifty50 to new ATHs, however I do not wish to get into new bullish positions till then.

Nifty levels - Sep 11, 2023Nifty support and resistance levels are valuable tools for making informed trading decisions, specifically when combined with the analysis of 5-minute timeframe candlesticks and VWAP. By closely monitoring these levels and observing the price movements within this timeframe, traders can enhance the accuracy of their entry and exit points. It is important to bear in mind that support and resistance levels are not fixed, and they can change over time as market conditions evolve.
The dashed lines on the chart indicate the reaction levels, serving as additional points of significance to consider. Furthermore, take note of the response at the levels of the High, Low, and Close values from the day prior.
We hope you find this information beneficial in your trading endeavors.
* If you found the idea appealing, kindly tap the Boost icon located at the bottom right. We encourage you to share your thoughts and comments regarding it.
Wishing you success in your trading activities!

Nifty daily analysis for 08/09/23.The market finally has given a nice trending move and has closed 116 point higher.
On the hourly charts, nifty took a slight pull back and started moving in the upward direction slow. During the second half it gave the break out and travelled, finding resistance around 19730 levels.
A nice bullish candle on the daily charts is showing some positivity and if the global markets support, nifty can travel higher.
On 15 minute time frame, it constantly took support from 20 ema closed very bullish.
Support :- 19640, 19550
Resistance :- 19785, 19845
The market has consolidated alot and the up move can continue owing to the G-20 summit.
Wait for the price action near the levels before entering the market.

Nifty spot bearish cup&handle formationNifty spot bearish cup&handle formation in 1 hr timeframe
closing only below 19250 and sustaining 20 minutes can lead to 19110
and 19010
DC : only for educational purpose only

#nifty"Good morning! As of September 8th, the global market sentiment is slightly positive, based on the Dow Jones alone. The market trend is bullish, and there is a possibility that the market might open with a slight gap-up. If the gap-up sustains, we can expect the rally to continue with minor corrections. On the other hand, if the initial market experiences sharp declines and reaches yesterday's minor high, that's a sign of a trend reversal."

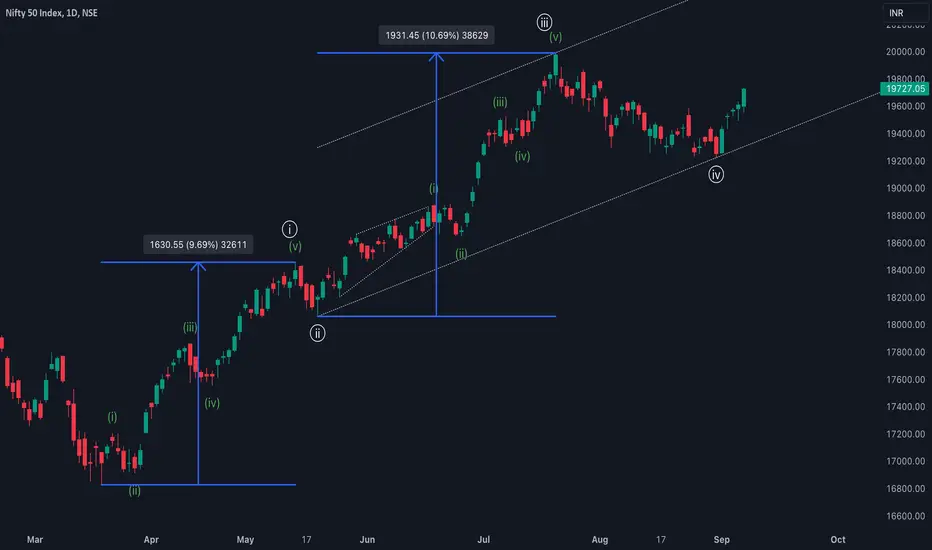
Why I am expecting an extended move in NiftyI have shared nifty wave count on day chart.
Apart from wave counting, you can see I have marked the length of wave 1 and wave 3,
which is approximately equal in terms of %age, i.e. approx 10%.
Well as per Elliot wave theory, one of the waves has to be longest.
Usually the longest wave is wave 3, but if in case 1 and 3 is equal, chances is very high to have an extended wave 5.
This is the reason why I am expecting an extended move this time in its 5th.
Lets see how it goes from here.
Keep learning guys.
Best of luck
07 Sep ’23 Post Mortem on Nifty Super rally in last 90 mtsNifty Weekly Analysis
You may not believe that Nifty has added 444pts ~ 2.31% between the last expiry and today. The bulk of the moves came on 1st Sep and then today.
On the weekly timeframe Nifty just broke out from the bullish flag consolidation formation signalling further fire power ahead. Will the global markets play spoilsport is the only question here.
Nifty Today Analysis
Recap from yesterday “Also the 14.15 green candle negates the 5 prior red candles creating a bullish ambience. For tomorrow, I wish to continue the bullish stance and the first target in sight would be to take out the next swing level of 19678.”
It was not a surprise that when I posted the bullish view on tradingview minds this morning, I got a -4 downvote. Almost all the analysts were looking for bearish opportunities on Nifty and BankNifty and the opening moves would have given the illusion of downfall. We fell 71pts ~ 0.36% by 09.35 enough for most to go short and that too on expiry day.
What happened after that was a reclamation of 19600 levels by Nifty, we even hit a new swing high of 19642 at 11.15. And honestly I thought thats it - we will consolidate sideways and end the day around those levels.
I was totally surprised when Nifty rallied 144pts ~ 0.74% between 11.40 to 14.35. In fact I had 2 bullish CE long positions that I exited prematurely at a small profit. If I knew Nifty had more firepower to take out the 19700 today - I would have hung on to it & made a fortune 🙂
From a weekly expiry standpoint - the options premium near ATM and far OTM were real pathetic. Something that I realized today is that when we had BankNifty & Nifty expiring together - we could jump in and out on strikes that gave max bang for bucks. Since BN is now set to expire on Wednesdays, there are no more arbitrage opportunities. If the conditions like today persist in the foreseeable future - then option selling wont be able to attract a fresh crowd.
On the 1hr TF the W pattern worked out quite good. The next 2 resistance points will be 19786 and 19852 if we are continuing the breakout rally. If we were to fall the first support will be the resistance we just broke i.e. 19678 followed by 19581. For tomorrow I wish to continue my bullish stance unless the first support of 19678 is taken out in the first 2 hours.

Nifty Trade plan 28-08-20231.Nifty Trend - bearish for short term
2. Sell on rise would be suitable in current market structure

Nifty levels - Sep 8, 2023Nifty support and resistance levels are valuable tools for making informed trading decisions, specifically when combined with the analysis of 5-minute timeframe candlesticks and VWAP. By closely monitoring these levels and observing the price movements within this timeframe, traders can enhance the accuracy of their entry and exit points. It is important to bear in mind that support and resistance levels are not fixed, and they can change over time as market conditions evolve.
The dashed lines on the chart indicate the reaction levels, serving as additional points of significance to consider. Furthermore, take note of the response at the levels of the High, Low, and Close values from the day prior.
We hope you find this information beneficial in your trading endeavors.
* If you found the idea appealing, kindly tap the Boost icon located at the bottom right. We encourage you to share your thoughts and comments regarding it.
Wishing you success in your trading activities!
