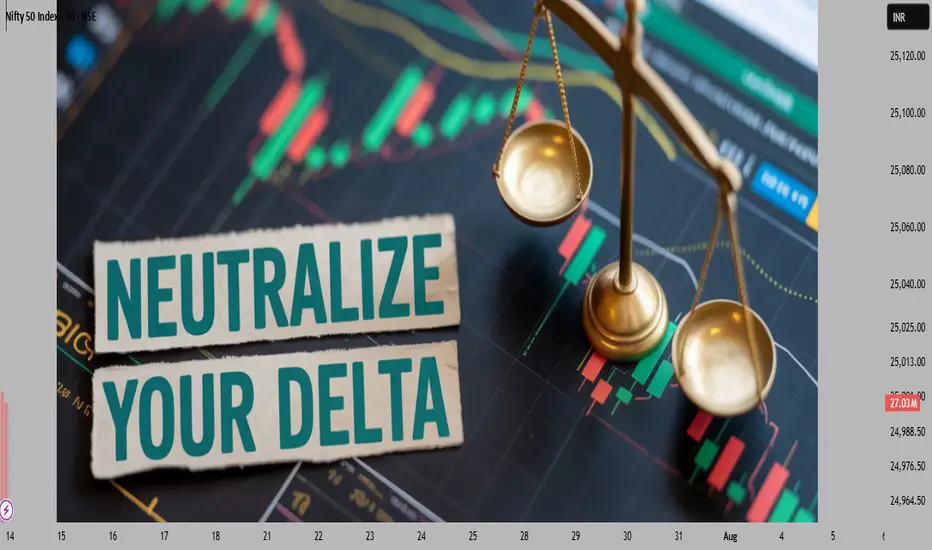
Delta Neutral Strategy – How Pros Make Money Without Direction!Hello Traders!
Most traders believe profits only come from predicting market direction. But professionals know a secret: you don’t always need to predict — you can neutralise! Today’s post is about the powerful Delta Neutral Strategy , a technique used by institutions and smart option writers to earn consistently even in sideways or uncertain markets.
What is a Delta Neutral Strategy?
It’s a position where the overall delta (directional exposure) of your trades is zero . That means, whether the market goes slightly up or down, your position stays unaffected — and you focus on time decay (theta) or volatility crush (vega) to generate profits.
Why Pros Love Delta Neutral Trades
No Need to Predict Direction: You’re not betting on bullish or bearish trends — you profit from time and volatility.
Ideal for Range-Bound Markets: When markets are consolidating, delta neutral setups thrive.
Lower Risk, Higher Consistency: With proper hedging, these setups offer smoother equity curves and capital protection.
Scalable Strategy: Institutions run massive delta-neutral books — it’s a proven method for large funds.
Popular Delta Neutral Setups
Short Straddles & Strangles: Collect premium from both Call and Put options — best for low volatility or strong resistance/support zones.
Iron Condor: A defined-risk variation that profits in a narrow range, great for weekly expiry strategies.
Calendar Spreads: Benefit from time decay differences between near and far expiry options.
Risk Management is Key!
Delta neutral doesn’t mean zero risk. Use proper stop-loss, position sizing, and adjustment techniques to control loss during trending moves or volatility spikes.
Rahul’s Tip
“Neutral is powerful — when used right.” Mastering delta-neutral trading can unlock consistent profits without playing guessing games on direction. Just let the premiums work in your favour!
Conclusion
The Delta Neutral Strategy is not just for pros — even retail traders can learn it and build a consistent, low-stress income model. If you’re tired of predicting every move, maybe it’s time to shift to a strategy where direction doesn’t matter — risk management does .
Have you tried delta-neutral trades before? Please share your experience below and let’s grow together!
Optionselling
Nifty June Iron Condor Strategy–Range is Back Premiums are JuicyHello Traders!
Here’s a plan for calm minds who want to generate passive monthly income by leveraging the power of non-directional option selling. Based on the current Nifty structure and OI data, I’ve spotted a new range-bound opportunity — perfect for executing a safe, hedged Iron Condor setup.
Why This Strategy Now? (Based on Chart Analysis)
Resistance Zone: 25400-25500 (Heavy supply, multiple rejection visible)
Support Zone: 23400-23500 (Major bounce levels, strong OI support)
Nifty is currently trading near 24500, well inside this range — perfect for deploying a neutral premium-selling setup.
Strategy Setup (Iron Condor – 26 June 2025 Monthly Expiry)
Sell 25400 CE @ ₹123
(to protect upside move rejection)
Buy 25800 CE @ ₹56
(risk protection on breakout)
Sell 23650 PE @ ₹99
(to protect downside move rejection)
Buy 23200 PE @ ₹51.4
(risk protection on breakdown)
Strategy Highlights
(Screenshot – )
Why This Works? (OI Logic + Technical View)
Strong resistance visible at 25400–25500 zone with rising CE OI
Solid put writing zone at 23400–23500 — confirms downside support
Volatility is stable, time decay is in our favor — perfect for Iron Condor writers
Risk Management & Exit Plans
Exit early if either side breaks with volume
Don’t hold till expiry — aim to exit around 70–80% max profit
Always keep SL alert at breakdown range breaches
Rahul’s Tip
"Option writing is not for thrill, it’s for discipline. Iron Condor is a weapon when range is visible — use it like a sniper, not like a gambler."
Conclusion
If your view is Nifty likely to stay between 23400–25400 for the next few weeks, this Iron Condor setup offers high-quality time-based potential. Use proper lot sizing and risk control — let the theta do the work for you!
Have you ever deployed an Iron Condor on Nifty? What was your experience? Drop your thoughts in the comments!
If you liked this post, don’t forget to LIKE and FOLLOW!
I regularly share high-quality trading setups based on real analysis, OI data, and smart risk-managed strategies.
Disclaimer: This analysis is for educational purposes only. Please consult a financial advisor before making investment decisions.

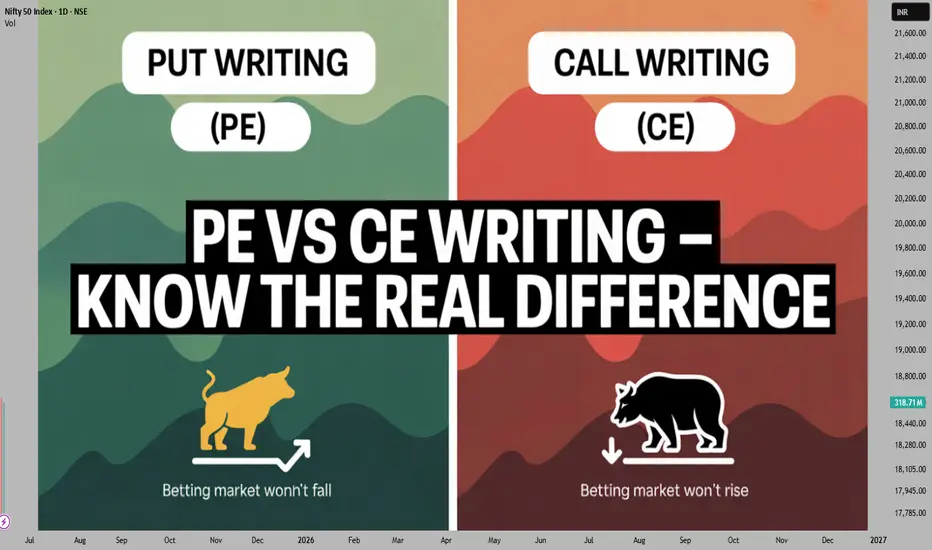
PE Writing vs CE Writing – Core Difference Explained!Hello Traders!
When it comes to Option Writing , many beginners jump into selling Calls (CE) and Puts (PE) without understanding the key differences. But PE Writing and CE Writing are not just two sides of the same coin — each comes with its own psychology, risk profile, and best-use scenario. Let’s break it down so you can write options like a pro.
What is CE Writing (Call Writing)?
Definition: Selling a Call Option (CE) means you're betting that the market will not go above a certain level by expiry.
Bias: It’s a bearish to neutral strategy. You profit if the market falls or stays flat.
Common Use Case: Ideal when the market is at resistance or when data shows strong supply zones or heavy CE OI buildup.
Risk Profile: Unlimited loss if market rallies sharply — hence better when combined with hedging.
What is PE Writing (Put Writing)?
Definition: Selling a Put Option (PE) means you're betting that the market will not go below a certain level.
Bias: It’s a bullish to neutral strategy. You profit if the market rises or remains sideways above the strike.
Common Use Case: Works best when market is near support or when strong Put OI build-up suggests buyers are defending levels.
Risk Profile: Unlimited loss if market crashes — especially dangerous during high-volatility or news-driven sessions.
PE Writing vs CE Writing – Key Differences
Sentiment: PE writing is bullish-biased, CE writing is bearish-biased.
Market Structure: PE writers want market to stay above their strike, CE writers want market to stay below theirs.
Risk Exposure: Both carry unlimited loss potential — proper SL and hedging are essential.
Expiry Day Behavior: CE premiums fall faster in strong downtrends; PE premiums decay faster in rising markets.
Rahul’s Tip
Don’t blindly sell PE or CE just because premiums are high. Use data like OI shifts, support/resistance, VIX, and structure to choose the right side.
Conclusion
Both PE Writing and CE Writing are powerful tools — if you know when and how to use them. Writing without context is gambling; writing with structure is strategy. Always trade with risk defined, bias clear, and exit planned.
Do you prefer PE or CE writing? Let me know your favorite setup in the comments!
Sell Options After 12:30 PM? Use This “Theta Killer” Setup!Hello Traders!
We all know that time decay (Theta) accelerates in the second half of the trading day — especially post 12:30 PM. But most traders either miss this golden window or use the wrong strategy. Today, I’m sharing my favorite “Theta Killer” Setup to sell options with high confidence after 12:30 PM , using pure logic, structure, and risk control.
Why Post 12:30 PM is a Sweet Spot for Option Sellers
Theta Decay Accelerates: Option premiums melt faster in the 2nd half, especially on expiry week.
Market Direction is Often Clear: By now, breakouts have happened or ranges are set.
Low Volatility = Premium Traps: Perfect time to eat theta with minimal risk.
The “Theta Killer” Strategy – Step by Step
Step 1 – Identify a Stable Range or Confirmed Trend
→ If market is sideways, look for VWAP + CPR compression .
→ If trending, identify break-retest zones.
Step 2 – Check OI Data & VIX
→ Low VIX (<14) + OI buildup on both CE & PE sides = perfect theta trap.
Step 3 – Deploy Short Straddle or Strangle
→ Choose ATM (Straddle) or OTM (Strangle) strikes with high OI and low IV.
→ Make sure the range is unlikely to break in the last 2 hours.
Step 4 – Exit Rules
→ Exit by 3:10 PM or when you hit 60–70% profit
→ SL = 30% of combined premium or breakout of your defined range.
Bonus Tip – Hedge If Needed
Buy deep OTM CE & PE as insurance
Adjust position into Iron Fly if market starts compressing further
Rahul’s Tip
“Selling options post 12:30 isn’t about volume — it’s about timing decay.” Let the market do nothing… and you profit from it!
Conclusion
This “Theta Killer” post-lunch strategy is ideal for traders who want low-risk, time-decay-focused profits . It’s not about prediction — it’s about structure, timing, and letting Theta do the work.
Have you tried trading after 12:30 PM? What’s your go-to setup? Drop your style in the comments!

Straddle Selling in Sideways Market – Full Risk-Reward Strategy!Hello Traders!
Sideways market eating your premiums? Don’t worry — this is where option sellers shine the brightest. One of the most reliable setups in a consolidating market is the Short Straddle Strategy . Today, I’ll break down exactly how to deploy a straddle in a range-bound market , along with proper risk-reward planning, adjustments, and exit rules .
What is a Short Straddle?
You sell both a Call (CE) and a Put (PE) at the same strike price (ATM) .
Ideal for low volatility , range-bound days where you expect limited movement in either direction.
The maximum profit is earned when the index or stock stays near the strike price till expiry or exit.
When to Use This Strategy
CPR Narrow + Inside Previous Day Range → Indicates consolidation
VIX Falling or Low (Below 13–14): → Lower volatility supports premium decay
No Major Events or News Expected: → Avoid directional shocks
OI Buildup at ATM Strike: → Signals strong range expectation
Risk-Reward Setup & Management
Entry Time: Ideal between 9:45–10:15 AM after range is confirmed.
Stop Loss: Set a combined premium SL of 25–30% or exit on sharp one-sided breakout.
Adjustments: If breakout starts, shift legs (convert into strangle) or buy hedge OTM options.
Exit Time: Usually 1:1.5 RR is achievable by 12:30–2:30 PM on calm days.
Rahul’s Tip
“Straddle selling is not about predicting direction — it’s about predicting no direction.” Respect the structure. If price stays inside the trap, you win by default.
Conclusion
The Short Straddle Setup is perfect for range-bound conditions, especially in Bank Nifty or Nifty. With clear entry, SL, and adjustment rules , you can earn steady returns from time decay — but only if you stay disciplined.
Do you use straddles? What’s your favorite expiry day setup? Drop it in the comments below!

The Expiry Day “Premium Decay Trap” – This Setup Can Save You!Hello Traders!
Thursday comes, volatility spikes, and suddenly your option premium starts vanishing. Sound familiar? That’s the Expiry Day Premium Decay Trap — a classic scenario where most option buyers get trapped, and smart option sellers quietly eat the premium. Today, I’ll share a simple setup to avoid this trap and trade expiry days smartly .
Why Expiry Days Are Dangerous for Buyers
Rapid Theta Decay: Time value melts fast, especially in the second half of the day.
False Breakouts Trap Buyers: Market shows breakout moves, only to reverse within minutes.
Low VIX + High OI = STUCK OPTIONS: When volatility is low and OI is high, premiums don’t expand even with movement.
The Safe Setup to Trade Expiry Days
Step 1 – Wait for First 15-30 Min Candle to Form
→ Don’t rush in. Let price discovery settle.
Step 2 – Mark High/Low & CPR Levels
→ Use those as breakout zones. Avoid trading inside a narrow range.
Step 3 – Confirm with Option Chain
→ Entry only if there’s OI unwinding on one side and buildup on the other .
Step 4 – Trade Near ATM Options (Avoid Deep OTM)
→ Only buy when there's a confirmed breakout with volume.
Step 5 – Quick Entry, Quick Exit
→ No holding dreams. Exit at 30–40% move or when structure breaks.
Pro Tip for Sellers
Short Straddles/Strangles Work Best After 11:30 AM
→ Let direction settle, then start writing premiums once movement fades.
Always Use SL or Hedge Legs
→ One big move can wipe out entire profits — expiry day is not a gamble!
Rahul’s Tip
Don’t chase expiry moves. Let the market give you the setup — not your emotions. Entry after confirmation saves capital and confidence.
Conclusion
Expiry days are premium-eating monsters for careless buyers . But if you follow structure, watch OI, and stay quick on execution — you can still trade profitably and safely.
What’s your expiry day setup? Drop it in the comments and let’s grow together!

1% Rule in Option Selling – Wealth Building Formula!Hello Traders!
Today, let’s decode one of the most powerful money management strategies in option selling – the 1% Rule . If you’re serious about generating consistent income and preserving capital while growing your account, this rule might become your best friend. Let’s understand how this simple risk formula can be a game-changer for option writers .
What is the 1% Rule in Option Selling?
The 1% Rule simply means you should not risk more than 1% of your total capital on a single trade. It’s a powerful rule that helps you control losses, stay disciplined, and survive during volatile market phases.
Why Option Sellers Love the 1% Rule
Capital Protection: You stay in the game longer even after multiple losing trades because your capital isn’t exposed to large drawdowns.
Emotion Control: Knowing your risk is capped helps you stay calm and execute your strategy without panic.
Consistency: Following the 1% Rule creates a systematic approach to trading and avoids over-leveraging.
Compounding Growth: By protecting capital and adding small, steady returns, your account grows exponentially over time.
How to Apply the 1% Rule in Real Trading
Know Your Capital: If your capital is ₹5,00,000 – risk only ₹5,000 per trade (1% of total capital).
Define Max Loss Before Entry: Calculate the worst-case loss scenario based on stop loss or adjustment strategy.
Choose Safe Strategies: Use credit spreads, iron condors, or short straddles with proper hedging to keep max loss in check.
Stick to Risk Plan: Even if the trade “looks perfect,” don’t risk more than 1% – protect first, profit later.
Conclusion
The 1% Rule in Option Selling isn’t just a technique—it’s a mindset. Traders who follow this rule last longer, lose less, and win big over time . It’s not about being right every time—it’s about surviving and compounding.
Do you follow the 1% Rule in your option selling strategy? Let me know in the comments below and let’s grow together, and yes Guys, if you’re interested in learning Option Writing from scratch, do let me know in the comment box. I’m planning to bring a complete educational series right here with simple explanations and real examples, so that you can understand Option Writing step-by-step – from Zero to Pro! Drop a comment if you're excited, and let’s start this journey together!

Option Buying, Selling & Hedging: Key Nifty Strategies
Hey traders! Today, we’re diving into the exciting world of options trading. We’ll compare three key strategies: Option Buying , Option Selling , and Option Hedging . Let’s break them down with a real-time example of Nifty options and understand how each of them works.
Option Buying (Call Option)
Trade Details:
Strike Price: 22950 CE
Expiry Date: 27th February 2025
Premium: 191
Probability of Profit: 33.36%
Maximum Profit: Undefined
Maximum Loss: 14,325 (-99.85%)
Breakeven Point: 23141.0
Payoff Chart Analysis:
When you buy a Call Option , your loss is limited to the premium you paid (14,325).
The profit potential is unlimited if the underlying asset (Nifty) moves significantly higher.
The payoff chart shows a steep upward curve , indicating significant profit if the market goes up, but also highlighting the steep loss if the market doesn’t move in your favor.
Option Selling (Put Option)
Trade Details:
Strike Price: 22950 PE
Expiry Date: 27th February 2025
Premium: 189.6
Probability of Profit: 61.54%
Maximum Profit: 14,220 (7.41%)
Maximum Loss: Undefined
Breakeven Point: 22761.0
Payoff Chart Analysis:
When you sell a Put Option , you receive premium upfront and aim to profit from minimal market movement.
Maximum loss is potentially unlimited if the market falls drastically.
Profit is capped at the premium received (14,220), making it a strategy suited for range-bound markets .
The payoff chart shows a gradual upward slope , with limited profit potential and high risk if the market moves sharply lower.
Option Hedging (Buy and Sell Combination)
Trade Details:
Sell Put Option (22950 PE) at 189.6
Buy Put Option (22850 PE) at 146.65
Net Credit: 3,221 (7.72%)
Maximum Loss: 4,279 (-10.26%)
Breakeven Point: 22908.0
Payoff Chart Analysis:
Option Hedging involves combining option buying and option selling to limit risk while maintaining profit potential.
The maximum loss is capped , which is crucial for managing risk in volatile markets.
This strategy offers moderate profit (3,221) with a relatively higher probability of profit (50.49%).
The risk-to-reward ratio (1:0.75) suggests a more balanced approach than buying or selling options alone.
Real-World Application:
Option Hedging is beneficial when you expect volatility but want to control potential losses by limiting exposure.
Example: Combining a short Put with a long Put to create a bullish or neutral strategy in uncertain market conditions.
Key Comparisons
Profit Potential:
Buying options offers unlimited profit .
Selling options offers limited profit but carries unlimited risk .
Hedging offers a moderate profit with capped loss , balancing risk and reward.
Risk and Loss:
Buying options has a limited loss (premium paid).
Selling options exposes you to unlimited loss .
Hedging reduces risk by capping both profit and loss, offering more control.
Probability of Profit:
Selling options usually has a higher probability of profit due to premium collection .
Buying options typically has a lower probability due to the need for significant market movement.
Hedging strikes a balance, with 50.49% probability of profit .
Break-even Point:
For option buyers , the break-even point is above the strike price, meaning the underlying asset needs to rise substantially for you to profit.
For option sellers , the break-even point is lower than the strike price, meaning the underlying asset can drop slightly before you start losing money.
Hedging combines both, providing a controlled risk environment.
Real-World Application
Option Buying (Call):
Great for when you expect sharp upward moves .
Example: You buy a Call option because you believe the market is going to soar, and you want to capture that upside.
Option Selling (Put):
Ideal for stable or slightly bullish markets .
Example: You sell a Put option because you believe the market will stay the same or rise slightly, and you’re comfortable taking the risk in exchange for the premium.
Option Hedging:
Perfect when you expect volatility but don’t want to take on excessive risk.
Example: You combine a short Put with a long Put to create a bullish or neutral strategy in uncertain market conditions.
Risk Management Considerations
For Option Buying:
Know your maximum loss (the premium you paid) and never risk more than you can afford to lose.
Control your risk by picking options that fit your risk tolerance and market expectations.
For Option Selling:
Ensure you have enough margin to cover potential losses.
Always be aware of the unlimited risk that comes with selling options.
For Hedging:
Balance risk and reward effectively by using both buying and selling strategies.
Helps you minimize the impact of extreme market movements while still being in the game.
Conclusion
All three strategies— Option Buying , Option Selling , and Option Hedging —have their pros and cons. The best one for you depends on your market outlook, risk tolerance, and trading goals.
What strategy do you prefer? Let me know in the comments!

Nifty Intraday Levels | 4-DEC-2024Nifty Options Scalping
1️⃣ Zones to Watch:
👉Green Zone: Institutional support
👉Red Zone: Institutional resistance
👉Gap: 100-200 points between zones
👉Zone Creation: Based on pivot points and Fibonacci
👉Chart: Use Nifty futures chart for reference
2️⃣ Trade Execution:
👉Order Flow: Triggers trades
👉Timeframes: 1-min & 5-min for scalping
👉Risk-Reward: 1:2 (Risk 1 to gain 2)
👉Strike Price: ATM or slightly ITM options
👉Position Sizing: Adjust to risk tolerance
3️⃣ Rules:
👉9:15 AM Sharp: Ready for market open
👉Risk Management: Top priority
👉Quick Trades: "Morning breakfast" scalps
👉Stop-Loss: 10 points
#ThankU For Checking Out Our IDEA , We Hope U Liked IT 📌
🙏 FOLLOW for more content!
👍 LIKE if you found it useful!
✍️ COMMENT below with your thoughts and feedback

BANK NIFTY STRANGLE 27 NOVSELL 48000 PE AT 48 AND 53000Call at 22
Total premium 70
General tic of strangle apply, hedge by buying respective legs or put SL at 2.5 x of buying

15 Feb ’24 — Nifty within kissing distance of a Bullish breakoutNifty Analysis - Stance Neutral ➡️
Recap from yesterday: “In the 63mts chart, see the encircled region — the strength of the green candles stands out prominently. This has given Nifty a total makeover, till yesterday we were neutral with a moderate bearish bias. Today we are still neutral but with a bullish bias — as the resistance of 21913 is much closer than the support of 21491.”
4mts chart
Nifty has lived up to the expectation today, the momentum it gained yesterday post 14.07 was legitimate. Not only did Nifty hold its ground today but showed intent to take out the 21913 resistance. The open was right at that zone but we quickly lost a few points. The candle at 09.47 carried the hidden message that a breakout was in the cards. That single candle had a swing range of 73 points. Even though we did not do anything unusual till 13.31 - the options premium was going crazy. One mistake I made was to switch to the next-weekly instead of the current one as I felt a breakout would happen post 3 PM. The break came early at 13.35 and what it did was shoot up the CE premiums, nothing unusual in that. But the PEs were not dropping in value. So on one side, my short CEs were trading in deep RED whereas the short PEs were not going into green.
Meanwhile, the breakout did not prove successful - but it definitely woke up the bulls. Almost all the top 8 components were reacting positively to this break. The final close was right near the 21913 SR zone. Over the last week, Nifty rose 166 points ~ 0.76% and if you notice the 63-minute time frame - it has formed a triple bottom-like formation on a descending trendline. Since Nifty already retraced back to the resistance level - we assume it is ready for the next leg of outperformance. The first thing it has to make sure tomorrow is to defend the 21913 levels - if it falls below that, the bullish breakout will not pick up pace. A gap-up is ideal as it will quickly tip the balance to the Bulls as short sellers will have to run for cover. We wish to change the status from neutral to bullish only if we get a 63mts candle above the 21913 resistance line.
63mts chart

Bank Nifty Analysis 17th Jan'24As mentioned previously avoid and beware of false break outs and traps same happend today in morning unable to break 48280 to 42300 false breakout and then back to days low at 48000
Stills looks buyer have controlled from falling below 48000. looks tomorrow may have gap opening in Bank nifty.
See Bank nifty also making range between support & resistance keep eye on opening for tomorrow also expiry may turned out to be trend day.
Support 48000
Resistance 48200 to 42300

Options: Buying vs. Selling - A Comprehensive GuideExploring the realm of options trading unveils two key players: Buyers and Sellers.
Each wields unique strategies with its mix of risks and rewards.
Let's break it down in simple terms.
# Option Buyers: Riding on Possibilities
Chances of Making Money (PoP):
Buyers aim for good market moves, counting on accurate predictions within a specific time.
Risk:
For buyers, risks are limited. Losses only go as far as the premium paid.
Time Pressure:
Buyers fight against time. Being right means aligning predictions with a set timeframe.
Volatility Impact:
Buyers gain when things get more uncertain, making their options potentially more valuable.
Market Moves Matter:
Buyers thrive when the market goes up or down; they bet on a specific direction.
Skill Needed:
While simpler than selling, buyers need a good sense of market trends.
# Option Sellers: Crafting Strategies with Care
Chances of Making Money (PoP):
Sellers prefer stable or slightly tricky markets, benefitting from time passing by.
Risk Check:
Sellers face unlimited risks if the market moves too much against them.
Time on Their Side:
Sellers like time passing; it works in their favor.
Volatility Impact:
Less drama is better for sellers; it makes their options lose less value.
Direction Doesn’t Matter Much:
Sellers can make money in quieter markets; they have more room to move.
Skill Level:
Selling needs more skill, involving clever strategies and calculations.
# What Decides Success: A Mix of Factors
Winning in the options game is about reading the market, knowing your risk appetite, and being smart with strategies.
- Chances of Making Money: Buyers look for clear market trends, while sellers like it stable.
- Risk Game: Buyers have limits on losses; sellers need to watch out for big market moves.
- Time’s Effect: Buyers fight against time; sellers make time work for them.
- Cost and Volatility: Buyers pay more, and gain from more drama. Sellers earn from premiums and like calm markets.
Succeeding in options trading is about thinking smart, adapting to what the market gives, and keeping your skills sharp.
Grateful for Your Support! 🌟
To our amazing 150+ followers, your enthusiasm fuels our journey! 🚀 Thank you for being part of our community, and decoding financial mysteries together. Here's to more insights and learning ahead.

19th Dec ’23 - BankNifty and NiftyIT collusion to get N50 to ATHBankNifty Analysis
Going neutral on BankNifty worked out pretty well today. But things were not looking in favor till we got the reversal at 10.03. Till then BN was following the falling price action from yesterday. I was kind of worried that we may even re-renter the ascending channel today.
4mts chart link - click here
How and why we got the reversal - No clue. But BN climbed an impressive 369pts ~ 0.78pts to 48010 levels before giving up gains to close flat. The final close is 0.01% - how much more neutral can we be??
4mts chart link - click here
The ATH on Nifty50 looks like was planted. NiftyIT was falling pretty strongly and it was looking like a one-way trip down. NiftyIT recovered an impressive 423pts ~ 1.21% to help N50 take out the ATHs. So the Sync between NiftyIT, Reliance, and BankNifty was perfectly aligned to get the job done. And after that - things went back to normal. NiftyIt gave up 239pts and BN also dropped 227pts.
63mts chart link - click here
The neutral zone is highlighted by 2 horizontal blue lines. Since tomorrow is BankNifty expiry - I am really looking forward to seeing a directional attempt. I wish to stay neutral till then. BankNifty options premiums were looking pretty good today and were unlike the usual Tuesdays we see. VIX near the 14 range is really helping the option sellers.

Indexes analysis for 18th December 2023 for educational purposeIndexes analysis for 18th December 2023 for educational purpose
This video is for educational purpose and my personal view . We are NOT SEBI registered Advisor, we only give the level on our practical trading experience. Kindly take the trade according to your risk and reward position and consulting your advisor. It is advisable to take the advice of SEBI registered advisor.
YOUR QUERY -
Trading analysis for tomorrow
Nifty price action analysis
Nifty bank nifty analysis
Nifty option chain analysis for tomorrow
Monday bank nifty analysis
Bank nifty daily analysis
Nifty analysis for tomorrow
Option trading daily analysis
Bank nifty weekly analysis
Bank nifty analysis for Monday
Nifty prediction and bank nifty analysis
Tomorrow market prediction
Nifty open interest analysis tomorrow
Nse option chain analysis
Daily option chain analysis
Nifty option chain analysis for tomorrow
Option chain analysis
Today option chain analysis
Option chain analysis for tomorrow
Nifty trader option chain analysis
Today nifty option trading
Nifty trader option chain analysis
Today nifty opening prediction
Nifty post market analysis
Morning nifty prediction
Bank nifty post market analysis
@vijayanjum
#nse
#nsebse
#Nifty
#niftyfifty
#bankniftytrading
#nfitybank
#niftypredictionfortomorrow
#niftyoptions
#NiftyBank
#nifty50
#nifty500
#niftytomorrow
#niftytoday
#NiftyCE
#bankniftyoptions
#sensex
#sensexindia
#sensextoday
#bankniftytips
#bankniftyanalysis
#bankniftytrading
#bankniftyoptions
#finnifty
#bankniftystrategies
#niftystrategies
#bse#bseindia
#bsesensex
#nsenifty
#nsebse
#nseindia
#STOCKMARKETEDUCATION
#STOCKMARKETUPTODATE
#STOCKMARKETTODAY
#stockmarkets
#tommorrowMarketPrediction
#nfityoutlookfornextweek
#bankniftyoutlookfornext week
#bankniftyoutlookformonday
#niftyforecast
#bankniftyforecast
#niftyshareprice
#bankniftyshareprice
#tommorrowniftyprediction
#tommorrobankniftypredicton
#niftytargettommrrow
#bankniftytargettommrrow
#bankniftylive
#banknifty
#bankniftyoptions
#bankniftystrategies
#bankniftyfuture
#bankniftyoptionstrategy
#bankniftycalls
#bankniftyintraday
#bankniftylivetrading
#bankniftyweeklyexpiry
#bankniftycrash
#bankniftytomorrow
#bankniftypredictions
#bankniftychart
#bankniftytips
#bankniftypremium
#bankniftyoptions
#bankniftyfuture
#bankniftytomorrowprediction
#bankniftyoption
#niftyweeklyexpiry
#stockmarketinindia
#derivatives
#niftypredictions
#niftytips
#bank nifty analysis,
#bank nifty prediction for tomorrow,
#bank nifty analysis
#bank nifty tomorrow,
#nifty prediction for tomorrow,
#nifty prediction,
#nifty analysis,
#banknifty tomorrow,
#bank nifty tomorrow analysis,
#nifty tomorrow,
#bank nifty analysis for tomorrow,
#nifty analysis for tomorrow,
#stock market crash,
#stock market latest news today,
#bank nifty live,
#live trading bank nifty,
#nifty live trading,
#live trading,
#bank nifty live trading
#OPTIONS
#OPTION
#optionbuying
#optiontrader
#optionselling
#optiontrading
#optionstrategey
#optioncall
#optionput
#optionexpiry

As Per Data Market BearishAs Per Option Data Market Show Bearish . so Whats Plan For Tommrow If you Are a New Trader then I recommend not trading on Friday. Tomorrow's Market More Interesting As Per data CE Writer Today More At 44000 current Condition CE Writer Greater Then Pe Writer and Also
Retail Full Bearish At Future/ce/pe
DII Future Bearish
FII CE Bearish
What Is The Main Support Zone For Tomorrow in Bank Nifty 44000 is a Big Support For Bank nifty if Market Again Tomorrow then More Fall is possible In Upper Side market have To Much Resistance 44200/44300/44400/
We Only See a Good Move Above 44200 for Buying In Downside if the market Sustence Below 44000 then i not taking any support nearby

Expiry Day Special analysis || FinNifty Hero Zero Trade 01/08/23Hello Traders, Good Morning, i hope you will be doing good in your trading and your life as well as. I have done analysis on Finance nifty as today is weekly expiry. So let's start,,
We have seen some pull back in all indian indices in yesterday's session, i think this should continue, as global market also supporting. Finance nifty also done same, let's see what is going to happen today.
If i talk about support and resistance for Finance nifty, then There is support in the zone of 20175-20200 in downside and i think Finance nifty will give respect for this today's session. Guy's try to buy in support zone also, if you see any price reversal pattern on downside and keep stop loss at 20125.
For Resistance we can see in the range of 20358-20375, and if Finance nifty will break above these levels and trade at least for 30 mints then our buying order should triggered, as then we can see bullishness in Finance Nifty and that momentum will lead the rally towards 20450-20500 levels.
Important Levels for Finance Nifty:-
Buy above 20358, if levels got sustained at least for 30 mints.
Target we can see in upside 20441/20481/20537.
Keep stop loss at 20200.
Sale below 20200, if levels got sustained at least for 30 mints.
Target we can see in downside 20125/20065/20011.
Keep stop loss at 20358.
Note:- Hero Zero Trade will be in 2nd half somewhere 1:15pm. So, we will update in afternoon according to price action, so stick with us and follow us to get notity at right time. Till then enjoy but don't overtrade and Always wait for the best entry or levels to execute trades. And always follow strict stop loss to save your capital from unexpected market direction.
Disclaimer:- Please always do your own analysis or consult with your financial advisor before taking any kind of trades.
Dear traders, If you like my work then do not forget to hit like and follow me, and guy's let me know what do you think about this idea in comment box, i would be love to reply all of you guy's.
Thankyou.

13 Jul '23 Post Mortem on Nifty + Weekly expiry analysisNifty Weekly Analysis
Between the last expiry & today, Nifty50 is actually down 40pts ~ 0.21%. That seems quite hard to believe especially when we had an ATH break today right?
The fact is N50 broke out from the 19500 levels today & that would have created the perception that nifty had a gaining week. Also on 7th July we had a red day and almost touched the 19300 levels. So credit goes to N50 since it recovered all its losses & hit a new ATH of 19567 today!
---
Nifty Daily Analysis
We had 2 strong moves today
A gap up open and then a race to take out the ATH, a total swing of 182pts ~ 0.94%
A similar fall of 180pts ~ 0.92% to touch the prev. close value
Both the directional move would have given ample opportunity for options traders to mint money today.
Final close was 0.15% higher mainly supported by the NiftyIT index. The dramatic inverted U shape price action was due to RELIANCE which fell from 2799 to 2743. HDFCBK, KOTAKBK & SBIN also dragged the index.
Trades Taken
Other than the regular expiry trades, I reopened a bullish PE credit spread between 10 to 10.30 AM. 19500/19400 PE for 67.45/40.65. This was taken when Nifty was at the ATH and due to the reversal this position is currently in loss.
Will take a decision tomorrow to hold on to bullish bias or exit at a loss.

Exide Option tradeBull Put Spread
EXIDEIND 29JUN2023 202.5PE Buy @3.2
EXIDEIND 29JUN2023 205PE Sell @4.2
Net Credit ₹ +3,600
Max. Profit +3,600 (11.32%) = net credit
Max. Loss -5,400 (-16.99%)
Max. RR Ratio 1:0.67
Breakevens 204.0
Margin req to trade 35000 (aprox.)

When to adjust Options - 5 Guidelines to stop your lossesIn this video, I discuss 5 Options selling guidelines which you can use to exit your option trades when they go wrong.
Selling options come with the risk of unlimited losses . That's why, the main aim of adjusting options is to put a cap to the losses , reassess the situation and increase profitability.
Follow @piyushrawtani for more!
Cheers =)

PostMortem on BankNifty Today & Analysis of 24 APR 2023By 09.15 around 90% of traders would have guessed how NSE:BANKNIFTY is going to trade today. Thats because NSE:ICICIBANK had an excellent quarterly results to boast for.
The predictability of banknifty is, one leading bank is enough to pull up the sentiment of others. Same on the downside as well.
Opening was gap up at 42469, and it took a while before it started climbing to the resistance zone. Till 12.40 there was no directional bias - banknifty was maintaining the opening gap and not yielding ground.
There was no attempt to close the gap too, meanwhile NSE:NIFTY went to slightly negative zone. Just compare the price action of banknifty vs nifty50, banks did not show any weakness at all whereas nifty50 was unable to maintain the gap.
---
From 12.40 banknifty took-off breaking the resistance of 42576 very easily, It just required a small upmove of 287pts to get rid of this important resistance.
There was also a test of support at 14.35 to 15.05 - but the momentum was too strong and bank nifty held its ground.
I am starting to wonder how are these banks able to provide this stellar results? How are Indian firms able to outperform the global peers so efficiently and effortlessly? Unbelievable.
The global banking fear of Silvergate, SVB, Credit Suisse has not lifted a finger in India. Not even a glitch!
---
15mts TF get a new bullish tone after today's move and the resistance getting broker. This temporarily gives the bull the edge from the rangebound trade we had till 21st Apr.
---
1hr chart is scaling new heights, with the next resistance seen at 43012. You would have noticed banknifty usually uses gaps to move the distance from 2022 onwards. Only rarely we see banknifty making huge moves during the day.
This has cooled off the options premium again, I shorted few PUT options today very well knowing that they are already near the fair value. I was not surprised to end the day in losses as there was no further decay left in the options I traded. Literally pointing that option-selling is getting very unattractive at low volatility levels.

Basics of Option's Delta: With ExamplesOption's DELTA represents the change in price of an option with respect to change in price of an underlying.
Let's understand briefly with the help of Nifty example.
1️⃣
In the above Nifty example,
17750 is an At the Money CE option.
Delta of ATM CE is near 0.5
Which means that if spot moves 10 points, 17750 CE will move 5 points.
Normally ATM options are highly volatile options.
2️⃣
17700 is slightly In the Money CE.
Delta is 0.7, means if spot moves up 10 points, the CE option will move up by 7 points.
Volatility is fairly high in this one too but less compared to 17750.
⚡If you open the chart of the above options, you will see spikes with lot of wicks above and below the candles (if market stays around these levels). Also, there will be a lot of breakout/breakdown failures over the swing highs and lows in the intraday. This is due to highly volatile nature of ATM options.
3️⃣
17650 and 17600 are deeper In the Money CE options.
You can see that the delta is around 0.9
It means that if index moves 10 points, these CE option will move 8-9 points also.
These options are less volatile compared to ATM options.
⚡The deeper the CE option, the higher would be the delta, but the value of Delta never exceeds 1.
You should note that deep ITM options just behave like the underlying Futures. Means a 1-point movement in the underlying equals 1 point move in the option.
So, if you don't want to trade futures for some reason, you can trade with deep ITM options.
⚡⚡Remember that Delta varies as the market moves.
Ex if market moves down by 100 points, in this example, then Delta of 17650 CE will become 0.5 as it will be ATM at that point.
This behavior along with higher Theta of ATM needs more attention.
⚡Needless to mention, the Delta of Out of the Money CE options remains less than 0.5 and it keeps on decreasing as we move deeper into OTM CE options.
Ex Delta of 17900 CE is 0.05 while publishing this post on the expiry day. This is the reason that an OTM CE will have bare minimum movement with respect to movement in the underlying.
Disclaimer: I don't call myself an option expert and I am not much into complex option strategies. But this is the least that one should know as an option trader.
Do like for more informative posts in the future.
Regards

PostMortem on BankNifty Today & Analysis of 10 APR 2023I am making some changes in the chart layout from today's report. It will be in white background going forward. This is after the feedback I got from the kindle publishing team that images with dark layout will look awkward when made into paperback.
note: I will still continue to use the dark-mode chart for my trading purpose, only for the reports I will be using the white-mode
NSE:BANKNIFTY opened today at 41116, it might look as a gap-up open but when the price action is considered it looks perfectly in line.
The entire market was quite subdued today, the option premium at the lowest when we compare an average Monday. The good-friday holiday might have played its part, but I still think the premiums were restrictive for any option sellers to have made money today.
I waited till 10.45 to find any mis-priced option, the moment I saw the premiums were all dead - I called it a day. I was just waiting on the sidelines just waiting for something to happen.
From 10.10 to 11.35 NSE:BANKNIFTY tested its first support at 40880 but did not break it. The rejection came at 11.40 when a short surge helped it gain 192pts.
The real move came from 12.45 to 14.15, in fact the 5mt candle at 14.15 had a bid dip. In spite of this the options premium hardly felt any threat. I am referring to OTM premiums which captures the threat more evidently.
Now we have the 40880 support broken decently as the close was below that level. The next support 40704 did not break today, below which the bears would have exerted some additional pressure.
---
15mts TF does not look bearish yet, NSE:BANKNIFTY might be taking a small break before the bullish continuation.
It could also mean a short term top if the further trades are held below the current levels. Ideally this should be the case wherein the bears get some control on the market & drive up the premiums.
---
1hr was in a perfect downward trend till the moves from 27 March 2023 to 06 April 2023 ruined it.
As it stands we have just entered back the top level of the descending channel. Further trades below this channel will give the bears lot of confidence to push down the bank-nifty prices & drive up the options premium.
The implied volatility which is staying so low is causing all the trouble for the option sellers.
