#BANKNIFTY PE & CE Levels(28/01/2026)A gap-up opening in Bank Nifty indicates a positive start to the session, supported by short-covering and fresh buying interest from lower levels. The index has opened above the immediate intraday support zone, which suggests that bulls are attempting to regain control after recent consolidation. However, despite the gap-up, the market is still trading within a broader range, so confirmation through price sustain is crucial before assuming a strong trending move.
From a technical structure point of view, the 59050–59100 zone is acting as a major demand and decision area. Holding above this region keeps the bullish bias intact for the intraday session. If Bank Nifty sustains above 59050, buying Call options becomes favorable, with upside targets placed near 59250, followed by 59350, and then 59450+. These levels correspond to previous supply zones and minor swing highs, where profit booking or partial exit should be considered due to potential resistance.
A stronger bullish continuation will only be confirmed if the index manages to break and sustain above 59550. Above this level, momentum buying can accelerate, opening the path towards 59750, 59850, and eventually 59950+, which is a major resistance area marked by previous rejections. This zone is critical, as failure to cross it decisively may again push the index back into consolidation or minor correction.
On the downside, 59450–59400 is the first intraday support. A breakdown below this zone may trigger short-term weakness, making Put options attractive with targets around 59250, 59150, and 59050. If selling pressure increases and Bank Nifty slips below 58950, the structure turns weaker, and further downside targets open up towards 58750, 58650, and 58550, which are stronger demand zones from where bounce-back attempts can emerge.
Overall, the gap-up opening reflects positive sentiment, but the market is still trading near crucial resistance bands. Traders should avoid chasing the gap and instead focus on price acceptance above key levels. A sustained move above resistance confirms bullish strength, while rejection from higher zones can quickly lead to a pullback. Maintaining strict stop-losses, booking partial profits near targets, and trading strictly based on levels will be essential due to expected volatility around these zones.
Community ideas


SBICARDS : Everyone Gave Up… That’s When Bases Are Born📊 SBI Cards & Payment Services Limited – Weekly Technical Analysis
Timeframe: Weekly
CMP: ~₹771
Trend Context: Larger base formation after extended correction
Structure: ABC corrective wave + potential Cup & Handle completion
🔍 Big Picture Structure (What’s Really Happening)
SBI Cards earlier witnessed strong selling from an extended retracement / supply zone (113%–127%), which is a classic area where:
Long-term holders book profits
Institutions reduce exposure
Late breakout buyers get trapped
This led to a controlled ABC correction, not a breakdown of the long-term structure.
📘 Markets correct to reset positioning, not to punish everyone.
📐 Why the Marked Levels Matter (Trading Psychology Explained)
🟦 ABC Completion / Demand Zone: ₹720 – ₹770
This is the most important zone on the chart.
🧠 Why price can react here:
Sellers from higher levels have largely exited
Value buyers step in near prior accumulation areas
Shorts start covering as downside momentum fades
👉 This zone represents fear exhaustion, where selling pressure typically dries up.
📌 It also aligns with a potential “handle” completion of a larger Cup & Handle pattern.
🔴 Invalidation / Risk Level: ₹690 (Day Close Below)
Breakdown below this level damages base structure
Psychology shifts from “buying dips” to “capital protection”
Confidence erosion can invite fresh selling
📉 Below ₹690, downside risk increases sharply.
🔑 Upside Levels & Targets (Why They Matter)
🟠 First Target Zone: ₹990 – ₹1,020
Prior supply memory
Trapped traders look to exit here
Profit booking likely on first approach
📘 Markets often hesitate where pain was previously created.
🟢 Second Target: ₹1,127
Larger pattern projection
Psychological round-number magnet
Momentum & FOMO participation zone
📈 Acceptance above ₹1,020 can accelerate price toward this zone.
🟢 Bullish Scenario (Primary Probability)
If price:
Holds above ₹720–770
Forms a base or higher low on weekly chart
Then:
Gradual recovery toward ₹990–1,020
Break & sustain → ₹1,127
Confirms base-to-expansion transition
📘 Strong bases often look boring before they explode.
🔴 Bearish Risk Scenario
If price:
Closes below ₹690
Then:
Base structure weakens
Buyers step aside
Market searches for deeper liquidity zones
📉 This reflects loss of confidence, not just technical damage.
🎓 Educational Takeaways
Corrections end where fear peaks, not where hope feels strong
Fibonacci & pattern zones work because crowds react together
Bases form quietly; breakouts are loud
The best opportunities feel uncomfortable at entry
🧠 Emotion Map of This Chart
Zone Dominant Emotion
Highs Greed & Euphoria
Decline Denial
Base zone Fear vs Opportunity
Breakout Relief & Momentum
Targets FOMO
📘 Charts are stories of crowd psychology, not just price.
🔮 Price Outlook (Educational Projection)
Above ₹770: Base confirmation improves
Above ₹1,020: Momentum revival
Upside targets: ₹1,127
Below ₹690: Caution, structure weakens
🧾 Conclusion
SBI Cards appears to be transitioning from correction to base formation.
The ₹720–770 zone is a decision area that can decide whether the stock moves into a new accumulation phase or slips into deeper weakness.
📌 Big moves are born from boring bases.
⚠️ Disclaimer
This analysis is for educational purposes only.
I am not a SEBI registered analyst. Markets involve risk, and I can be wrong.
Please consult your financial advisor before making any trading or investment decisions.

Market Outlook & Trade Setup – Wednesday, 28th January 2025🔹 NIFTY
* Previous Close: 25,175
* Expected Range: 25,000 – 25,200
🔹 SENSEX
* Previous Close: 81,857
* Expected Range: 81,500 - 82,000
🌍 Global & Market Sentiment
* DJIA: -408 | S&P: +28
💰 Institutional Activity (Cash Market)
* FII: Net Sellers: - ₹ 3068 Cr
* DII: Net Buyers: + 9000 Cr
🔥 Events this Week: US --- Trump Speech & FED Rate announcement
📌 Sectoral Focus
Metal, PSU Bank, Pvt Bank
👉 Commodities in Focus: Gold, Silver
💯 Important Quarterly Results: BEL, Maruti, SBI Life, L&T, ACC
📈 Trade smart. Manage risk. Stay disciplined.

Gold in Decision Zone – GAP Reaction Defines Next MoveMarket Context (Fundamentals → Flow)
Recent sessions continue to be driven by elevated geopolitical and macro uncertainty. Risk sentiment remains fragile as markets reassess global political tensions and their implications for trade, energy routes, and monetary stability.
As a result:
USD remains under pressure, lacking strong follow-through buying.
Equities show signs of fatigue near highs.
Gold continues to attract defensive flows, keeping the broader bullish structure intact.
This environment supports trend continuation, but not without technical pullbacks.
Technical Structure (H1–H4)
Gold is trading within a well-defined ascending channel.
Multiple BOS (Break of Structure) confirm the bullish trend.
The recent impulsive leg created a bullish GAP / imbalance.
Price is now reacting near the mid-channel decision zone, where continuation vs. deeper retrace is decided.
➡️ Trend is bullish, but location matters.
Key Levels to Watch
Current resistance: 5,080 – 5,100
GAP / reaction zone: 5,020 – 5,000
Major demand (FVG): 4,960 – 4,940
Invalidation: H1 close below 4,940
Scenarios (If – Then)
Scenario 1 – GAP Holds (Primary Bias)
If price holds above 5,000
Buyers defend the imbalance
→ Continuation toward 5,120 – 5,180 within the channel.
Scenario 2 – Deeper Pullback (Healthy Correction)
If price loses 5,000
Expect a retrace into 4,960 – 4,940 FVG.
Bullish reaction here keeps the higher-timeframe trend intact.
Only a clean break and acceptance below 4,940 would weaken the bullish structure.
Summary
Gold is not topping — it is pausing at a decision zone. In a risk-sensitive environment, pullbacks are opportunities, not threats.

DXY : Decisive Move ComingDXY is stuck in a range for long and ascending triangle type formation can be seen on weekly charts. Any break either upside or downside can bring a big move and sharp move

UPDATE on previous EURUSD BULLISH IDEA!The price has claimed the highs which was a major level I marked and presented at :- 1.19206.
The TRADE IDEA is COMPLETE!
Congratulations to whoever took this.

REVERSED but will it sustain!? As we can see NIFTY did reversed exactly as analysed in our previous analysis as it was trading at important demand zone and a psychological level but the reversal wasn’t strong enough hence we may see weakness continuing in the index if fails to sustain itself above the psychological level so plan your trades accordingly and keep watching everyone.

#BANKNIFTY 1HR Hello Friends 👋
This Is The Key Level's Of Banknifty. Mark This Level's On Your Chart & Keep Eyes On Bullish Side View 📊

Gold Analysis & Trading Strategy | January 27–28Gold Analysis & Trading Strategy | January 27–28
🔥Congratulations to all members who followed our trading signals.
The long positions opened around 5050 have successfully captured over 500+ pips in profit!👏👏👏
✅ 4-Hour Chart (H4) Analysis
From the 4-hour timeframe, gold remains within a clear bullish structure. Price continues its previous stair-step rally, consistently forming higher highs and higher lows, confirming that the medium-term uptrend is still intact.
The moving averages (MA5 / MA10 / MA20) maintain a strong bullish alignment, with MA20 steadily sloping upward and providing dynamic support. Price continues to trade above these key moving averages, indicating that buyers remain in control of the market.
However, after testing the recent high near 5110, upside momentum has started to slow. Recent candles show smaller bodies and more upper wicks, while the upper Bollinger Band is flattening and the band width is narrowing. This suggests that the market is transitioning from a strong trending phase into high-level consolidation.
This behavior is more likely a healthy technical correction and position rotation after the rally, rather than a trend reversal. As long as price holds above the key support zone at 5020–5050, the bullish structure remains valid, and pullbacks should still be treated as buying opportunities.
✅ 1-Hour Chart (H1) Analysis
On the 1-hour timeframe, short-term price action has clearly shifted into a sideways consolidation phase. Price has tested the resistance above 5110 multiple times without a decisive breakout, while higher lows continue to form below. Overall, gold is trading repeatedly within the 5070–5110 range, forming a typical high-level range-bound or box consolidation structure.
The moving averages are gradually flattening and intertwining, with price frequently crossing above and below them, indicating weakening short-term momentum and a transition into a corrective phase.
This type of tight consolidation near the highs is usually a continuation pattern within a broader trend. It suggests accumulation and momentum building rather than distribution. Therefore, unless key supports break, the short-term bias remains slightly bullish.
From a trading perspective, it is more favorable to buy near support or follow breakout moves, rather than chasing price in the middle of the range.
🔴 Resistance Levels
• 5095–5110
• 5130–5150
🟢 Support Levels
• 5070–5080
• 5045–5050
• 5020–5010
✅ Trading Strategy Reference
🔰 Strategy 1: Buy on Pullbacks (Primary Plan ✅)
📍 Entry 1: 5050–5045
📍 Entry 2: 5020–5010
🎯 TP1: 5095
🎯 TP2: 5110
🎯 TP3: 5130+
🔰 Strategy 2: Breakout Buy (Momentum Plan)
📍 Entry: Break and hold above 5110
🎯 TP1: 5130
🎯 TP2: 5150
⛔ SL: Below 5095
🔰 Strategy 3: Short Setup (Only if breakdown ❌)
Short positions should only be considered if:
• Price breaks below 5020
• The H4 structure weakens
• Moving averages turn bearish
Otherwise, avoid counter-trend shorts.
✅ Trend Summary
Gold remains bullish on the H4 timeframe and is consolidating on H1.
The current move represents a high-level correction rather than a reversal.
👉 Buy the dips, avoid chasing shorts, and wait for either support or breakout entries.

NIFTY – Detailed Intraday Trading Plan | 28 JAN 2026📊
Timeframe: 15-Min
Instrument: NIFTY (Index)
Gap Considered: 100+ Points
🔍 MARKET CONTEXT & STRUCTURE
NIFTY has shown volatile price action with sharp intraday swings, indicating active participation from both buyers and sellers.
The current structure suggests the market is transitioning from panic selling to selective buying, making key levels extremely important for the next session.
This plan is reaction-based, not prediction-based — we trade how price behaves at levels, not assumptions.
📌 IMPORTANT LEVELS FOR THE DAY
Opening Support Zone: 25,177 – 25,234
Opening Resistance: 25,327
Major Resistance / Profit Booking Zone: 25,469 – 25,508
Last Intraday Support: 25,030
🔼 SCENARIO 1: GAP UP OPENING (100+ POINTS) 🚀
A gap-up open signals short-covering or global support, but sustainability is key.
🟢 Bullish Continuation Plan
Price opens above 25,327
15-min candle closes above resistance
Retest of 25,327 holds as support
Upside targets: 25,469 → 25,508
🔴 Gap-Fill / Rejection Plan
Failure to sustain above 25,327
Long upper wicks / weak follow-through
Expect pullback towards 25,234
🧠 Trading Psychology:
Gap-up moves often trap late buyers near resistance. Acceptance above resistance confirms institutional participation.
➡️ SCENARIO 2: FLAT / NEUTRAL OPENING ⚖️
A flat open usually indicates indecision, leading to range-bound price action initially.
🟢 Upside Breakout Plan
Sustained price above 25,327
Volume expansion on breakout
Targets: 25,400 → 25,469
🔴 Downside Breakdown Plan
Breakdown below 25,177
Strong bearish 15-min candle
Targets: 25,100 → 25,030
🧠 Trading Psychology:
Flat opens create fake moves. Waiting for a 15-min confirmation avoids emotional entries and whipsaws.
🔽 SCENARIO 3: GAP DOWN OPENING (100+ POINTS) 📉
A gap-down open tests buyer strength immediately.
🟢 Support Hold / Pullback Buy
Price reacts positively from 25,177 – 25,234
Long lower wicks / higher-low structure
Bounce targets: 25,300 → 25,327
🔴 Breakdown Continuation
Acceptance below 25,177
Selling pressure increases
Targets: 25,030 → 24,950
🧠 Trading Psychology:
If key demand zones fail, sellers gain confidence and momentum accelerates.
🧠 OPTIONS TRADING STRATEGY (EDUCATIONAL)
Near resistance → Prefer Bull Call Spread, avoid naked CE buying
Inside range → Iron Condor / Short Strangle (low momentum)
Breakdown confirmed → Bear Put Spread
🛡 RISK MANAGEMENT RULES 🔐
Trade only after confirmation
Risk maximum 1–2% capital per trade
Avoid overtrading inside no-trade zones
Book partial profits near key levels
One setup = one trade
🧾 SUMMARY & CONCLUSION ✍️
25,177 – 25,234 is the most critical decision zone
Above 25,327 → buyers regain control
Below 25,177 → sellers dominate
Let price confirm direction — patience is the edge
Trade what you see, not what you feel 📊
⚠️ DISCLAIMER
This analysis is for educational purposes only.
I am not a SEBI registered analyst.
Markets involve risk — trade responsibly.

Dixon Ltd— A Fundamental Reset, Not a Broken StoryThe sharp decline in Dixon Technologies from its highs near ₹19,000 has raised concerns, but a fundamentals-only view suggests this move reflects a reset in expectations rather than deterioration in the business .
Business fundamentals remain intact. Dixon continues to deliver strong revenue growth, healthy free cash flow generation, and high returns on capital. The balance sheet shows no signs of stress, and there is no evidence of structural damage to the core EMS business.
The key constraint, however, lies in operating margins . Despite scale, PLI incentives, and diversification, margins have remained largely range-bound in the 3–4% zone . While typical for an EMS model, this limits operating leverage and caps earnings acceleration.
At the peak in September 2024 , the stock traded at its highest-ever valuation , with the P/E nearing ~193 .
A P/E of ~193 essentially meant investors were paying ₹193 for every ₹1 of annual earnings — a level that assumes strong future profit growth, not just revenue growth.
When margin expansion failed to materialise, the adjustment occurred through price compression rather than earnings collapse . In effect, the market corrected expectations, not the business.
This marks a shift from optimism-driven valuation to delivery-driven valuation , where revenue growth alone is insufficient to sustain premium multiples without visible improvement in profitability.
What to Watch Going Forward
Operating margins : Sustained expansion beyond the historical 3–4% range would materially change the valuation narrative.
Quality of growth : Revenue mix, customer concentration, and margin-accretive segments matter more than headline growth.
Free cash flow consistency : Stable cash generation remains critical in a low-margin business.
Conclusion
The correction in Dixon Technologies appears to be a rational valuation reset , not a rejection of the business model. The long-term story remains intact, but any future re-rating will need to be earned through margins and cash flows , not anticipated.
Disclaimer:
This analysis is for educational purposes only and does not constitute investment advice. Please do your own research (DYOR) before making any trading decisions.

#GBP/AUD Buy Trade Scenario.Here’s an up-to-date GBP/AUD Buy trade outlook (technical + fundamental) to help you assess whether positioning for a Upside makes sense right now.
Thank You......

Hindcopper 27 Jan | bullish | 52 wk, high, breakout#hindcopper
It can, give a 52wk high, breakout from here.
Can go towards 650-680.
Trade with a stop loss.
On going copper demand and bullish signs are here which can, lead a fresh 52wk, high.

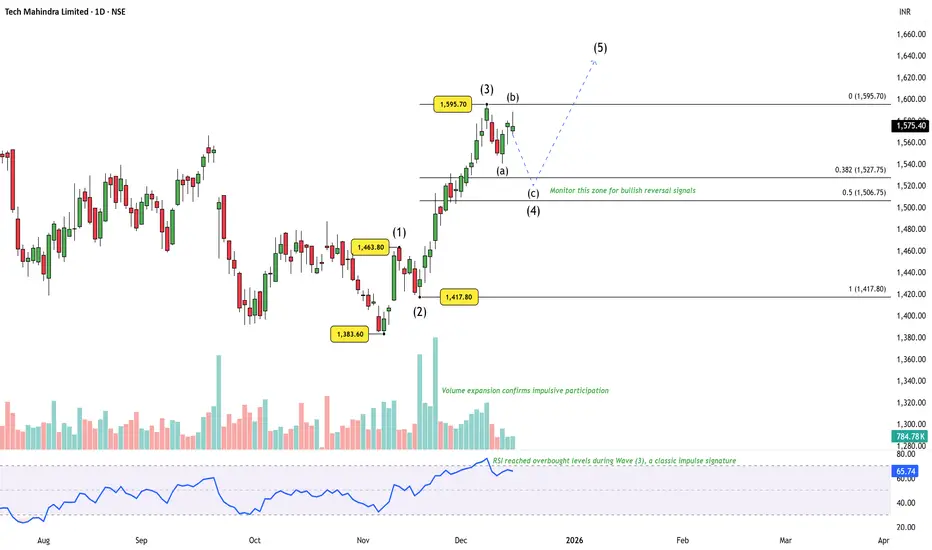
Tech Mahindra: Structure Still Favors One More Upside LegPrice action from the ₹1383.60 low has unfolded as a clean impulsive sequence, with Waves (1), (2), and a strong Wave (3) already in place. The advance was supported by clear volume expansion , validating the impulsive nature of the move. Momentum also peaked during Wave (3) , with RSI reaching overbought levels — a classic third-wave signature .
Following the Wave (3) high near ₹1595.70 , price has transitioned into a corrective phase. The decline is best interpreted as Wave (4) in progress , with only the (a),(b) legs formed so far. The structure continues to respect the typical Fibonacci retracement zone , keeping the broader bullish setup intact. A final (c) leg is still expected before Wave (4) can be considered complete.
Importantly, the higher-degree context does not materially alter the forward expectation . Whether the move from ₹1383.60 marks the start of a fresh impulsive advance , or represents the internal Wave C of a larger corrective pattern unfolding as a five-wave structure, the current setup continues to favor one more upside leg — Wave (5) .
That said, patience remains key . Focus remains on identifying a proper Wave (4) termination before anticipating continuation higher.
Disclaimer: This analysis is for educational purposes only and does not constitute investment advice. Please do your own research (DYOR) before making any trading decisions.
Nifty 50 for 28 Jan 2026Important levels and trendlines for Nifty 50.
Disclaimer: This is for educational purposes only. Trading involves risk. Please consult with a SEBI-registered advisor before making any financial decisions.

CHFJPY 4HR T/F ANALYSIS----
chfjpy 4hr t/f analysis----- in this image we have a new retesting area which are sell side retesting here we do measure top recent demand and demand will be also completed so now we can see recent full supply here so we can go with supply let`s see---

BANKNIFTY(28-01-2026)Please note this levels are for intraday trading only.
Soch Samajh ke 🐉
Technical Analysis of BANKNIFTY
[This is for educational purposes only

$DXY | Macro Breakdown Continues | Target 80Timeframe: Monthly / 6M
Bias: Bearish
DXY has confirmed a multi-decade structural breakdown on higher time frames.
This is not a pullback — it’s a cycle shift.
Previous support flipped into resistance
Failed reclaim = continuation signal
Similar structure last seen pre-2008
🎯 Target: 80
❌ Invalidation: Monthly close above 100
Weak dollar = strong hard assets.
🟡 GOLD | Dollar Breakdown Fuel | Multi-Year Bull Case
Timeframe: Weekly / Monthly
Bias: Strong Bullish
With DXY breaking down on HTF, gold enters a macro expansion phase.
Inverse correlation with DXY
Central bank accumulation
Currency debasement hedge
🎯 Expectation: New ATHs over coming quarters
📌 Pullbacks = accumulation, not distribution
Gold moves first when trust in currency fades.
₿ BITCOIN | Late Reaction, Explosive Outcome
Timeframe: Weekly
Bias: Bullish (Lagging but Powerful)
Bitcoin historically reacts after DXY breakdown is accepted by markets.
Sequence: DXY ↓ → Liquidity ↑ → Gold ↑ → Bitcoin explodes
Fixed supply asset
Digital hedge against fiat dilution
Volatility = opportunity
🎯 Expectation: Sharp upside once narrative shifts fully to “weak dollar”
🔥 One-Line Macro Thesis (Perfect for caption)
This is not a bull market. This is a currency reset trade.

Nifty closed around its 200DMANifty amidst volatility managed to close around its 200DMA of 25154, this would act as pivot for next few sessions. Fiis unwinded 29% of their net positions on expiry day, they still holds heavy short positions of 88% among total net open positions.
For Nifty to bounce back further it has to hold above 200DMA.

NIFTY (28-01-2026)Please note this levels are for intraday trading only.
Soch Samajh ke 🐉
Technical Analysis of Nifty
[This is for educational purposes only

getting turn up or elseHell Yeah! Else better. See the roughness its forming and the global sentiments...

HDFCLIFE: Potential Stock for Feb EXP. & Positional LevelsHDFCLIFE: Potential Stock for Feb EXP. & also an Investment Idea
👇🏼 Comparative Study of some of leading Insurance compaanies.
👇🏼 Screenshot of HDFCLIFE Intraday Level for 28th Jan 2026
💥Level Interpretation / description:
L#1: If the candle crossed & stays above the “Buy Gen”, it is treated / considered as Bullish bias.
L#2: Possibility / Probability of REVERSAL near RLB#1 & UBTgt
L#3: If the candle stays above “Sell Gen” but below “Buy Gen”, it is treated / considered as Sidewise. Aggressive Traders can take Long position near “Sell Gen” either retesting or crossed from Below & vice-versa i.e. can take Short position near “Buy Gen” either retesting or crossed downward from Above.
L#4: If the candle crossed & stays below the “Sell Gen”, it is treated / considered a Bearish bias.
L#5: Possibility / Probability of REVERSAL near RLS#1 & USTgt
HZB (Buy side) & HZS (Sell side) => Hurdle Zone,
*** Specialty of “HZB#1, HZB#2 HZS#1 & HZS#2” is Sidewise (behaviour in Nature)
Rest Plotted and Mentioned on Chart
Color code Used:
Green =. Positive bias.
Red =. Negative bias.
RED in Between Green means Trend Finder / Momentum Change
/ CYCLE Change and Vice Versa.
Notice One thing: HOW LEVELS are Working.
Use any Momentum Indicator / Oscillator or as you "USED to" to Take entry.
━━━━━━━━━━━━━━━━━━━━━━━━━━━━━━━━━━━━━━━━━━━
⚠️ DISCLAIMER:
The information, views, and ideas shared here are purely for educational and informational purposes only. They are not intended as investment advice or a recommendation to buy, sell, or hold any financial instruments. I am not a SEBI-registered financial adviser.
Trading and investing in the stock market involves risk, and you should do your own research and analysis. You are solely responsible for any decisions made based on this research.
"As HARD EARNED MONEY IS YOUR's, So DECISION SHOULD HAVE TO BE YOUR's".
━━━━━━━━━━━━━━━━━━━━━━━━━━━━━━━━━
❇️ Follow notification about periodical View
💥 Do Comment for Stock WEEKLY Level Analysis.🚀
📊 Do you agree with this view?
✈️ HIT THE PLANE ICON if this technical observation resonates with you. It will Motivate me.
━━━━━━━━━━━━━━━━━━━━━━━━━━━━━━━━━
💡 If You LOOKING any CHART & want for Level and ANALYZE?
Share your desired stock names in the comments below! I will try to analyze the chart Levels, patterns and share my technical view (so far my Knowledge).
If Viewers think It can identify meaningful setups. Looking forward to hearing from all of you — let's keep this discussion going and help each other make better trading decisions.
