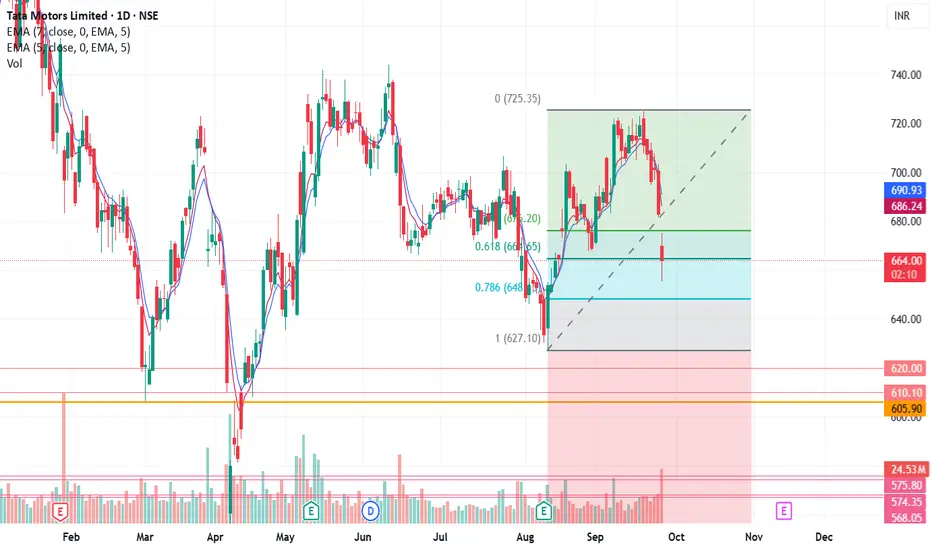
On Golden level of Fibonacci RetracementWith recent bullish momentum in the Auto industry, this looks like a good time to catch Tatamotors as it is on the Fibonacci Retracement golden level. I am bullish on this. Pinbar candle on the bottom on a daily basis gives me more confidence.
Pin Bar
USD/JPY(202509008Today's AnalysisMarket News:
Non-farm payroll growth fell significantly short of expectations, with June's data revised downward to negative territory, marking the first contraction since 2020. The unemployment rate hit a nearly four-year high.
Technical Analysis:
Today's buy/sell levels:
147.57
Support and resistance levels:
149.28
148.64
148.23
146.92
146.51
145.87
Trading Strategy:
On a breakout above 148.23, consider a buy entry, with the first target price being 148.64.
On a breakout below 147.57, consider a sell entry, with the first target price being 146.92

Weekly CT Breakout + 200EMA Flip | GALAXYSURF Structure📉 Main CT Line (Dotted White)
A well-defined counter-trendline finally gave way after weeks of price compression. The breakout was clean, with a strong bullish candle closing decisively above it.
📊 Volume Confirmation
Breakout candle posted a solid spike in volume — the highest weekly volume in months. 💥
📈 200 EMA Broken (Blue Line)
Price has also cleared the 200-week EMA, a key dynamic resistance, now potentially flipping to support. 📉
🟧 Higher Timeframe Supply (Orange Line) / ⚪ (White Lines)
The breakout candle has also stepped into a tight zone between Weekly + Monthly supply, marked by the orange line.
📌 As always, the chart tells the story. No predictions. No assumptions, just structure.

Max Financial Services Ltd – Trend Reversal in Play?🚀 Technical Analysis Breakdown:
The yellow trendline shows a long-term support, which has held well despite recent corrections.
The red downtrend line indicates a recent bearish phase, which has now been broken with a strong bullish candle.
The stock has bounced from the trendline support, showing signs of strength.
Above all the strong Pinbar candle looks amazing for a candle close .
🔎 Your Take? Do you see further upside or a pullback? Comment below! 👇

1D BIRLACORPN (BIRLA CORP)- Short Entry1. Nice Pinbar formed at Big Round Number 1000.00
2. EMA 365 acts as Resistance for that Pinbar.
3. Fibonacci Retracement at 61.8% level.
4. Watch that trendline which is also acts as resistance.
5. Take Profit and Stop Loss level clearly mentioned in the chart window.

1D FIBERWEB - Short Position1. Nice Pinbar formed at S/R zone.
2. 50.0% Fibonacci Retracement confirmed that is superb S/R zone with pin bar.
3. EMA 150 & 200 acts as resistance for that pin bar.
4. Note down entry point very well and TP & SL clearly mentioned in the chart window.

1D MCDOWELL_N (UNITED SPIRITS) SHORT1. Pinbar occured at S/R zone.
2. Fibonacci Retracement correctly placed at 61.8%
3. MACD Divergence.
4. Big Round Number 800.00

1D BANKINDIA (Bank Of India) - Short Position1. Pinbar formed at S/R level
2. Fibonacci Retracement 61.8% confirms that S/R level.
3. Trendline is in perfect position for the pinbar which acts as trendline.
4. Stop Loss and Take Profit levels are perfectly mentioned in the chart window.
5. Once Take profit level reached, try to sell half of your stocks position there and move your stop loss to breakeven and run another half stocks for freedom.
Thanks by
Pupathi Sadagopan

EURCAD 1H LongA nice pinbar occurs at support level...ie on trendline..It will better moves up..So go for long option.

NIFTY 50NIFTY 50 Analysis
Time Frame - Daily
Study - Bullish Butterfly Pattern and two pin bars after big downtrend
Conclusion and Targets -
View 1 - If Nifty sustains above 16751 , Then Immediate target would be , 17267,17450,17820
View 2 - If Nifty breaks 16751, then expected big correction below 16500
Disclaimer - This Chart is only for educational purpose. Do your on study before taking any trades

Power of a simple TrendlineAnother Simple Technical Analysis which shows that market is easy and money can be made by doing simple things also.
This Time there is a very simple TRENDLINE drawn in weekly time frame which had worked multiple times and again which has given another opportunity and made a Pin Bar candle at the support of the Trendline.
It seems true that more than 80% is the Psychology (Money management , Position Sizing , Execution and other things) and only around 20% is the SETUP. Because Setup is easy but following it religiously is what a makes a person, TRADER
ENTRY - can be made if it crosses this Pin Bar Candle or can be purchased at the current market price of 6.95 for aggressive trading.
RISK - The Stoploss would be at the low of the same candle on closing basis or whenever it gives a closing before the trendline after crossing this pin bar's High.
Reward - there is major resistance( at price - 10) which has been retested 3 time and there is a high probability that it will go again to retest that resistance.
** Stop loss and Reward has no significance if the Psychology is not strong. Do not hope and just exit at the Stop Loss level and do not greed , just exit at the reward level.
**There are always a lot of opportunities in the market.
#KeepLearning.


US crude oil ... pin bar in 2 hour chartUS CRUDE oil paused near important fib ratio 50% & 61.8% near $116
if sustains above $116 than will see move towards $130
currently wave 2 (c) consolidation going on....
no shorting will be recommended till it is above $100
views are educational

Titan... pin bar & double top intradayTitan pin bar and double top intraday given a free fall from 2380 to 2325
During the intraday if one develops the habit of reading candlesticks and patterns
than the dependency on indicator will reduce and more clear picture of movement can be seen
without confusion
loading of many indicators makes difficult to take action..
keep your chart clean and neat... load only needed information which makes you comfertable while trading..
views are just for EDUCATIONAL...

MCX Natural Gas in rising wedge with pin bar candlestickMCX Natural gas trading in a rising wedge...
and risingwedge always checks the traders patience...
it has made pin bar at the top in 30 min chart..
breaking down of the wedge will bring weakness towards 388---380 levle

PVR pin bar candlestick with volumPVR mae pin bar candlestick pattern with volume
and once the low of pin bar broken down... it has given free of 50 points..
never ignore the pin bars with volume
P

AUBANK [for intraday]for intraday
pin bar strategy
send next day ...why this selected for intraday .........
IF YOU LIKE MY IDEA …PLEASE .FOLLOW ME
Disclosure : I am not SEBI registered. The information provided here is for Education Purposes only. Consult your financial advisor before taking any decisions

MARICO [pin bar] 1) support
2) most rejection candle
3) bullish pin bar
"my study is stock bullish"
Disclosure : I am not SEBI registered. The information provided here is for Education Purposes only. Consult your financial advisor before taking any decisions

Hester Bio || Pin Bar/Hammer Candle Formation || RR 1:2The Trade is based on the following observations :
~ Broken a multi-year resistance with high volume.
~ Potential flag and pole pattern formation.
~ Sellers have very very low volume.
~ Retest candle is a Pin Bar Formation.
~ RR > 1:2.0
The chances of trade playing out are 75 % (premium members are already triggered) DO NOT MISS!

Rubfila International || Pin Bar Candle Formation || RR 1:3The Trade is based on the following observations :
~ Broken form a channel pattern.
~ Potential low volume retest.
~ Retest candle is a Pin Bar Formation.
~ RR > 1:3
The chances of trade playing out are 70 % (premium members are already triggered) DO NOT MISS !

EURGBP 1H Moves Up Now!A nice pin bar occurs at trendline which act as support and resistance.. Better it will move up..So go for Long option here...

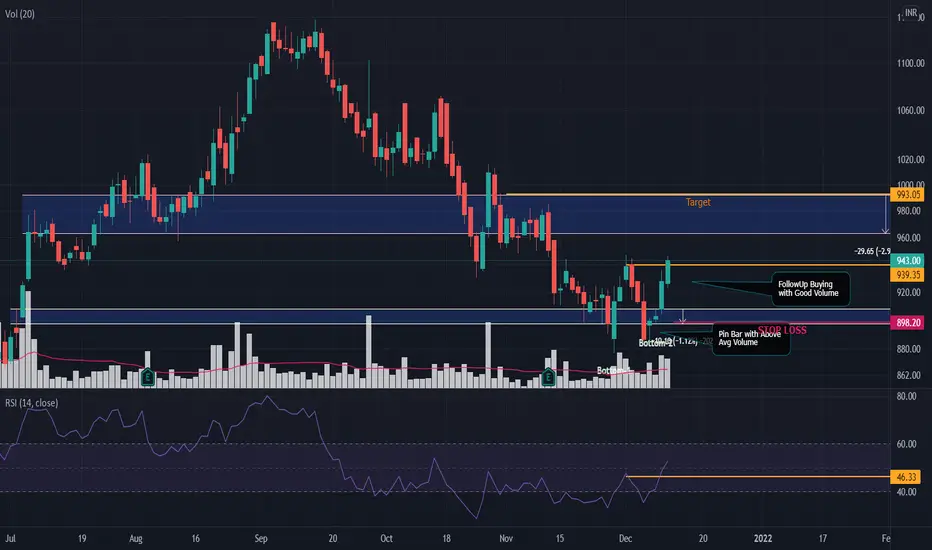
GODREJCP - Double Bottom SetupDouble Bottom Setup , Pin Bar and Followup buying seen. Good time to Enter